This image shows the 4-hour chart of BNB/USDT, where the market analysis can be done using the MACD indicator and price candles.
📉 Current Situation:
Price: 785.20 USDT (approximately -3.56% decrease)
24-hour high: 816.70
24-hour low: 779.01
---
📊 MACD Indicator Analysis:
MACD Line = -6.66
Signal Line (DEA) = 6.30
Histogram = Red (Red Bars)
➡️ This indicates that the MACD is going down and giving a bearish signal, meaning a downward trend in price.
---
📉 Price Candlestick Analysis:
It can be clearly seen in the chart that:
The price has dropped from 861.10 to 785.20.
Continuous red candles (bearish candles) are forming.
This is a clear downtrend.
---
🔻 Conclusion:
The market is currently going down (bearish trend)
MACD is also down → possibility of further decline.
If you want to take an entry, it’s better to wait a bit until the MACD starts to reverse or the price comes to support.
---
🔑 Recommendation:
Entry Point (potential): 770 – 752 (strong support zone)
Stop Loss: Around 745
Take Profit (TP): 800 – 820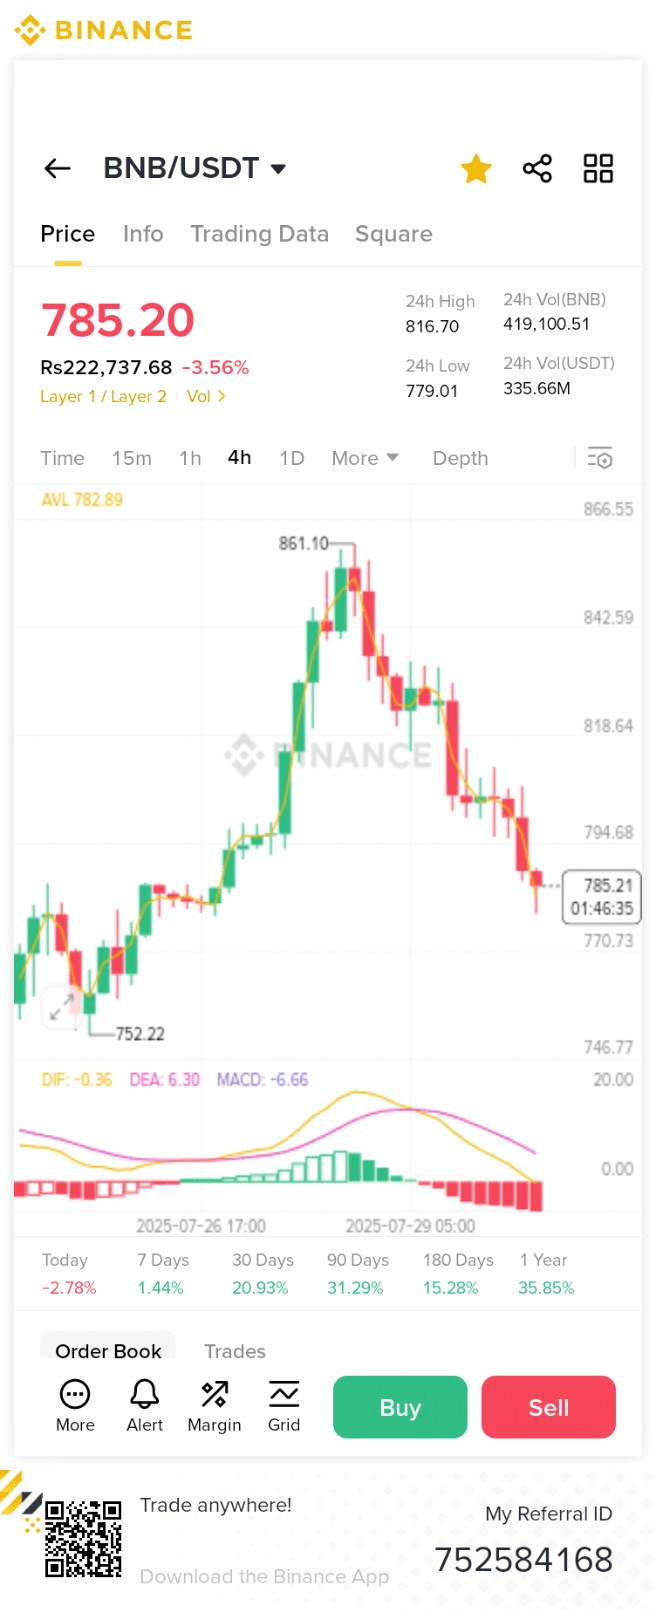
📌 More technical analysis:
🔹 Support and Resistance Levels (Key Prices):
Strong Resistance: 816 – 820 (where the price fell from)
Current Resistance: 794 – 800
Current Price: 785
Strong Support: 770 – 752 (previous bounce area)
🔄 What could happen in the market? (Possible Scenarios)
1. 📉 If the market goes down:
The next support level may test 770 and then 752.
If 752 breaks, the price may go down further.
2. 📈 If the market reverses:
First, the price will go to 800 (minor resistance)
If 820 breaks, a new recovery may start.
📘 Current Decision:
⛔ It may be a dangerous time to buy right now
✅ Better buying place: 770 or below
📍 MACD is also down → waiting would be a better strategy.
If you:
Next Signal,
Long-term analysis,
or need the complete strategy in Urdu
So just write: "Give more guidance" or "Yes"
✅ Ready!

