Bitcoin (BTC) closed the month of July with a rise of +8%. However, the last days had already started to show some signs of weakness. The first day of August was negative with -2.17%, and at the time of writing, it is priced at 114,150 USD.
Bitcoin closes July with +8%, but August starts weak.
On the attached monthly chart, it can be observed how the close of July represents the fourth consecutive positive month, an event that has occurred ten times in Bitcoin's history. More significant than the closing in green, however, is the new all-time high reached at 123,236 USDT.
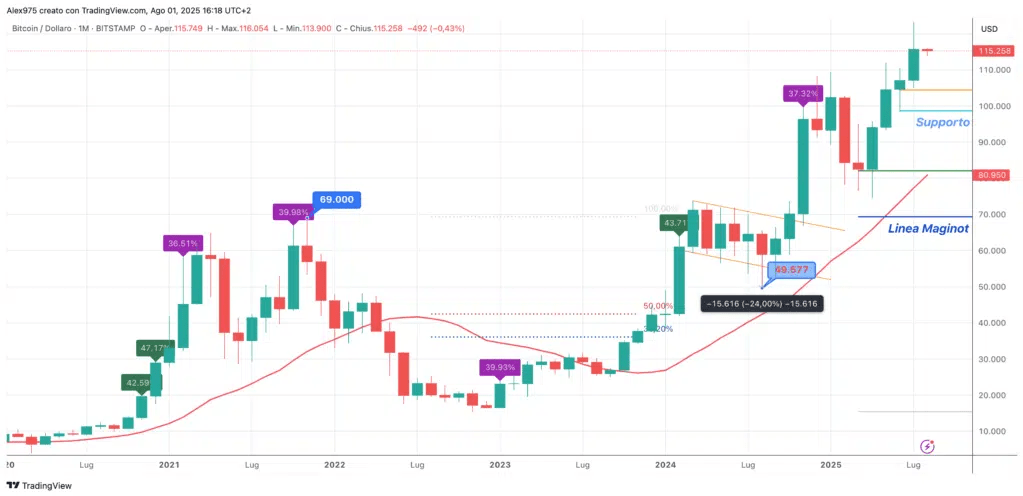
Four consecutive months of increases.
The attached table shows that July is historically one of the most favorable months for Bitcoin, with 10 positive closes out of 15. However, July also marks the beginning of what is statistically the weakest quarter for the market. In particular, the months of August and September present a negative historical series.
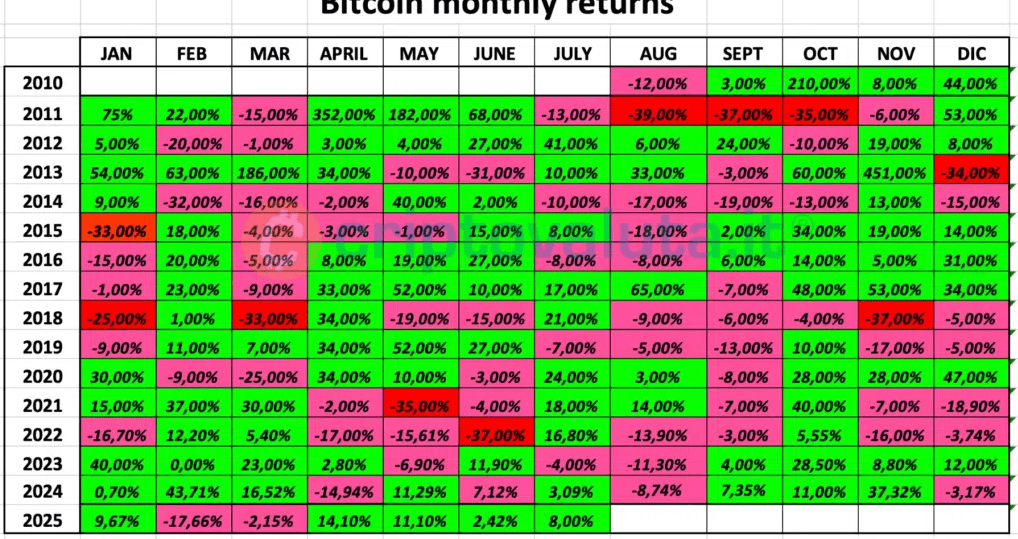
Q3 is statistically the worst but not always...
Historically, Bitcoin's third quarter (Q3) is the weakest of the year, with an average return of +6.5% but a median around -2.6%. However, in the years following the halving (like 2025), Q3 has often marked strong increases, even after initial corrective phases.
Another favorable data point comes from the fact that BTC returns in August, in the years post-halving, have mostly been positive, with gains recorded of +30% in 2013, +65% in 2017, and +14% in 2021. We will see if this positive series will also be confirmed in 2025. From this halving-related scenario, we refer you to a reflection already addressed in the article of July 26, which hypothesizes that there may still be three months of margin for a new ATH.
