The crypto market is experiencing a phase of weakness, especially in the last 24 hours, resulting in generalized declines. This trend marks a sharp contrast to what happened in July, which was an exceptionally positive month.
Bear market around the corner?
As highlighted in this morning's analysis, July closed with some of the best monthly performances of the year for many cryptos, although the last few days have started to show negative signals.
To find a better performance of Ethereum, we must go back to July 2022 when it closed with a +56.58%.
Historical overview of Ethereum
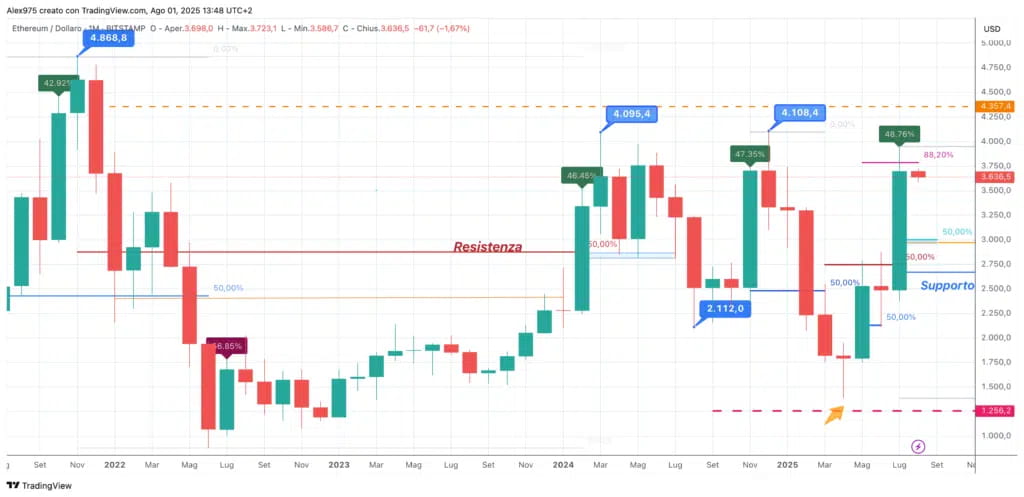
On the monthly chart of Ethereum, we have a historical overview from its ATH at $4,868 in November 2021. Here we can observe all the various phases of corrective and bullish swings, with the low at $880 reached in June 2022 and the subsequent rebound phase with a high in March 2024, summer correction, and acceleration in November 2024, with a high of $4,095 USD.
In 2025, a corrective phase resumed, pushing the price of ETH to the April low of $1,385, followed by a new bullish swing that led to a high of $3,940 recorded last July.
The movement of ETH in 2025
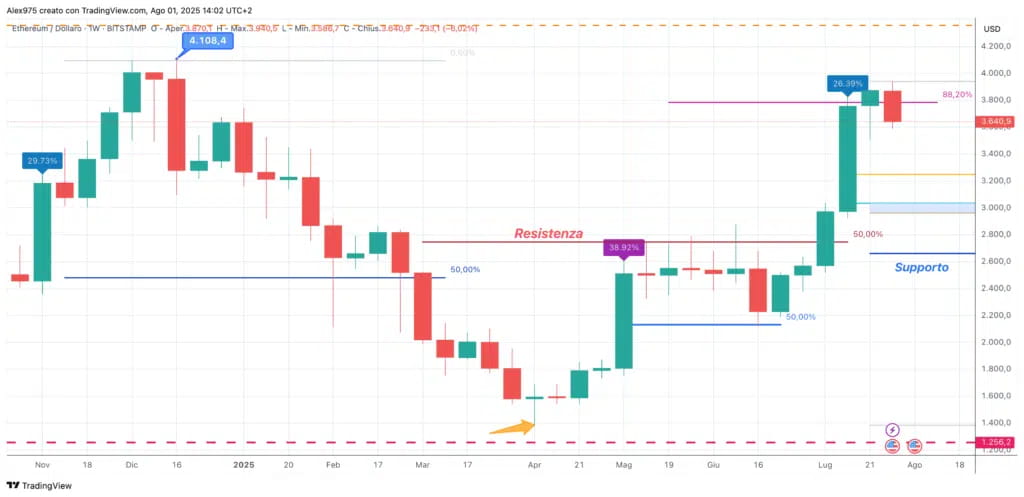
Analyzing the situation on the weekly chart, we can observe the phase of Ethereum's movement throughout 2025. The downtrend, which began from a high of $4,108, was very direct and accompanied by a significantly stronger movement compared to the downtrend of the rest of the crypto market.
Even the rise that started from the April low, after an initial phase where it stalled at the resistance area of $2,720, had a bullish acceleration that proved to be stronger than many other altcoins.
$ETH has grazed the area of $4,000 and has started to retrace with the weekly candle down -6%. Considering what happened during the retracement from the December high, the risk is that after a direct rise, it could also accelerate downward.
The support levels of Ethereum
Now we have a series of three main vector levels. The first is at $3,249, followed by an area between $3,050 and $2,960, with the main support at around $2,650. The last two levels correspond to the Fibonacci retracements of the vector from the April low to the recent July high.
Short-term scenario for Ethereum
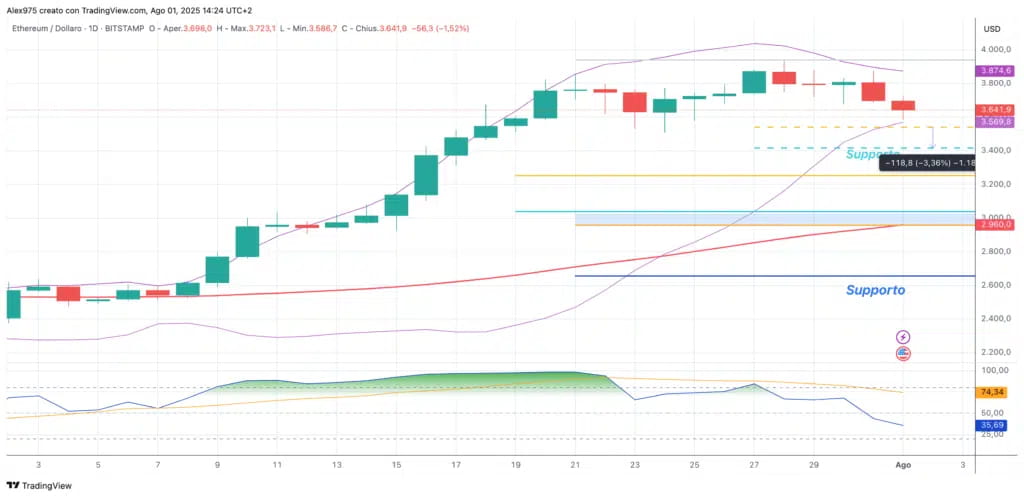
Speaking about Ethereum's short-term situation and analyzing the scenario analytically, the first support level that should not be violated is around $3,410 USD. A drop below this level could trigger a downward phase, activating subsequent supports.
On the daily chart, it can be observed that the moving average (Sma50) is currently passing through the supportive area around $3,000 USD. A drop to this level would still be compatible with a swing within the bullish leg that started in April. A break below, however, would seriously compromise the current uptrend.
In terms of indicators, the fast RSI has not yet entered the oversold zone, nor has the price broken below the lower Bollinger band. However, the bands are narrowing, especially due to the strong upward movement recorded in previous months.