Several technical indicators and charts suggest that the price of XRP has the potential for a parabolic rally in the coming weeks.
Key points:
The price of XRP has just hit multi-year highs of $3.66, but technicians suggest there is still room for growth.
Several XRP charts signal a potentially "explosive" movement, with targets of $7-$20 if key resistances were broken.
The price of XRP has increased significantly over the past seven days, reaching a new all-time high of $3.66 on Friday, up nearly 90% from April's lows.
Despite this impressive performance, several technical setups suggest that the price of XRP has yet to enter its parabolic phase, according to analysts.
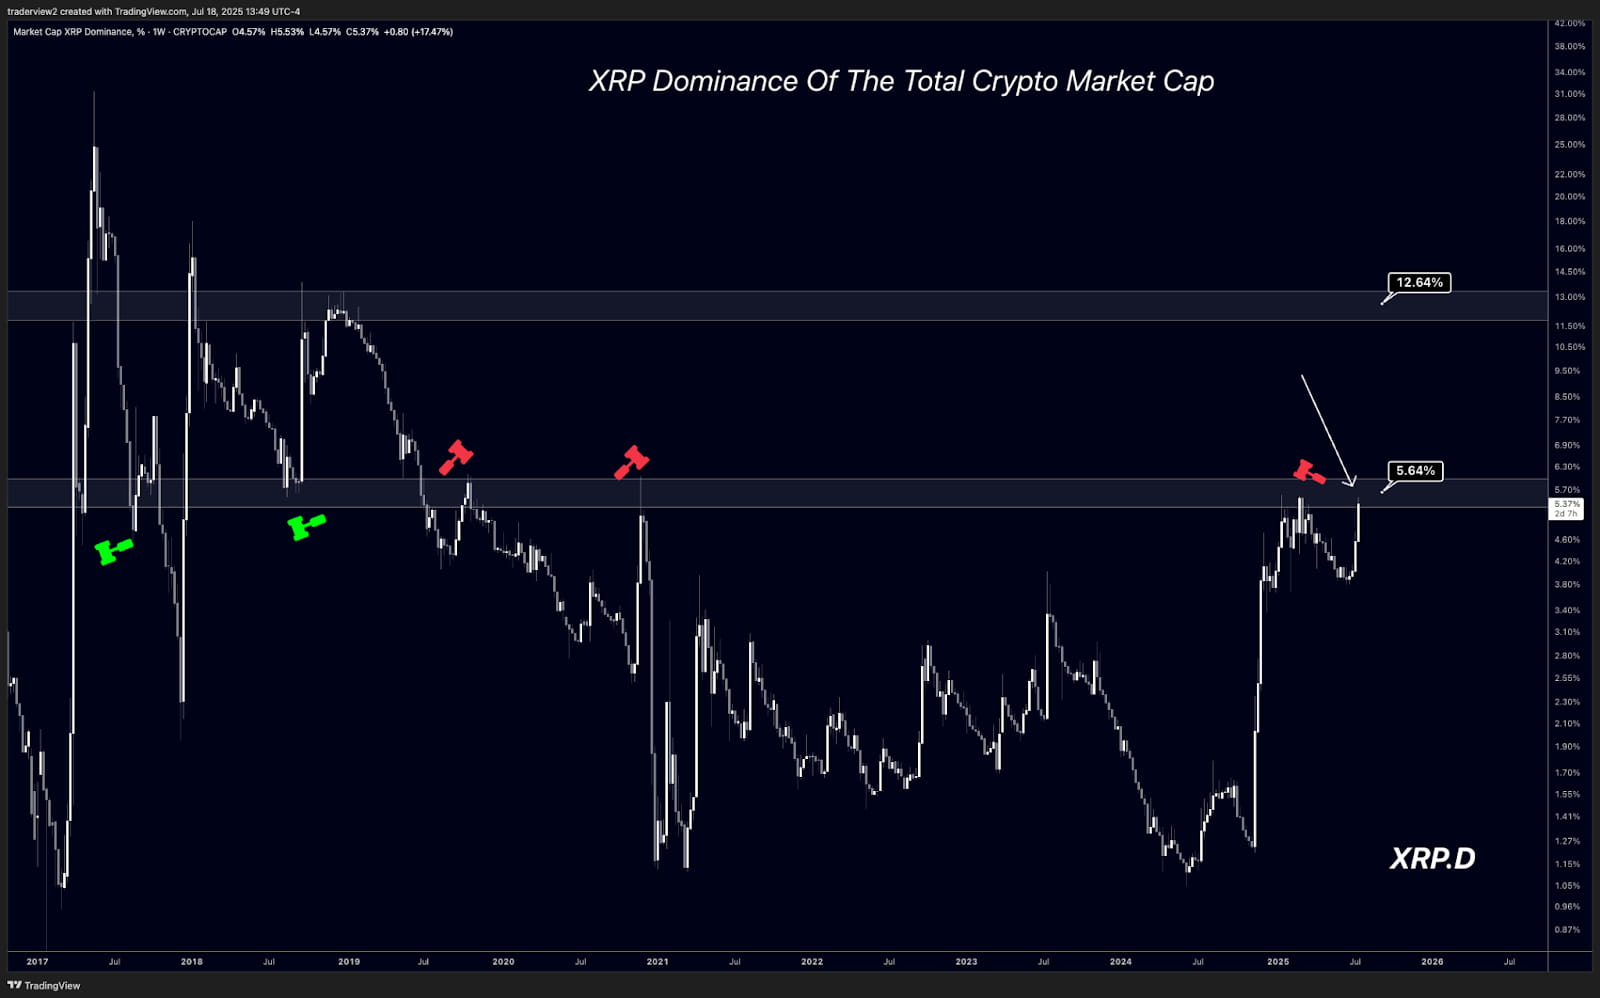
XRP dominance "signals a mega bullish wave."
The popular crypto analyst Dom stated that, despite XRP reaching multi-year highs on Friday, some charts "have not really signaled the true bull run yet."
One of these is the market share, or the dominance chart of XRP (XRP.D), which shows that XRP has returned to the weekly resistance level around 5.50%. This resistance has kept XRP.D in check for over 2,200 days.
"Every time XRP.D has broken the current resistance in the past, we have seen a 2x shortly thereafter," explained Dom, adding:
If history were to repeat itself after a breakout, this would bring us close to a target of $7-$10, depending on how the rest of the market moves.
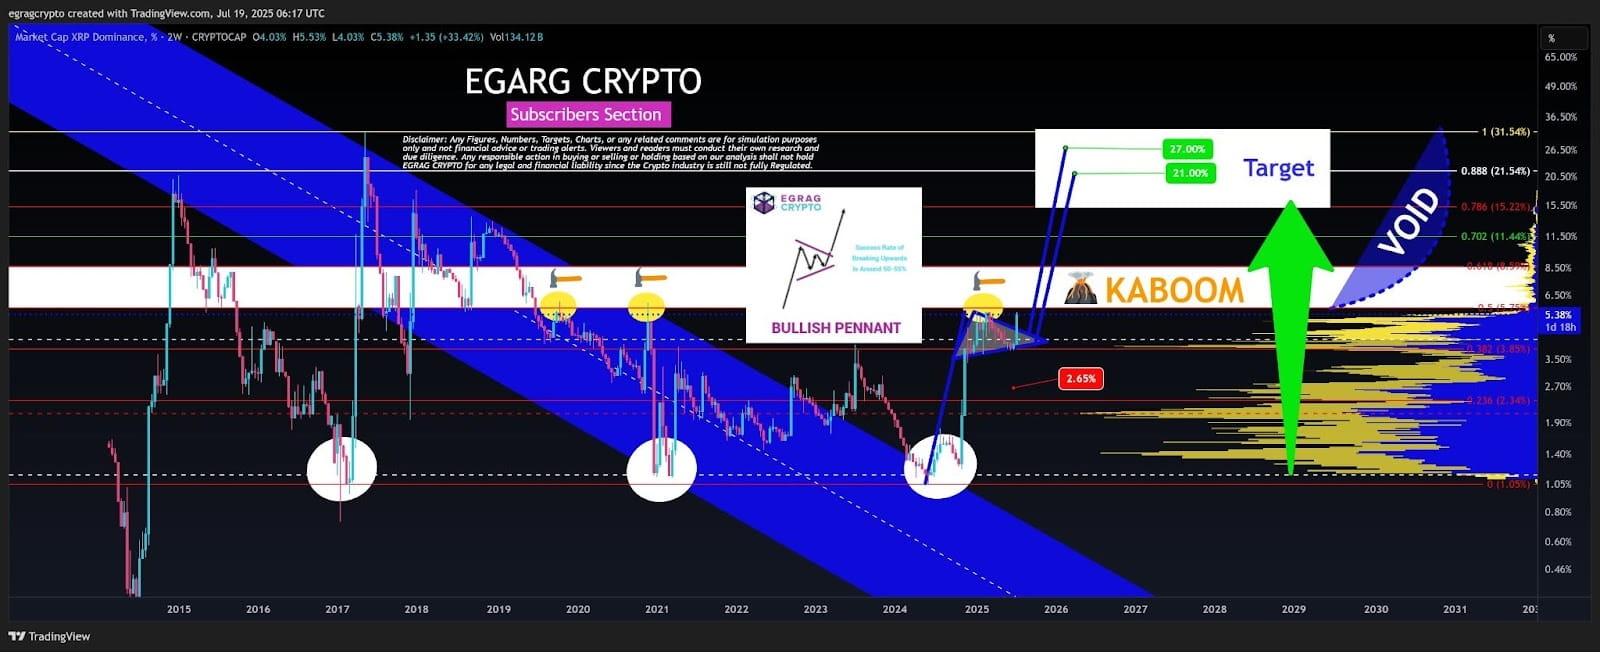
"Not everyone is paying attention to XRP Dominance, but I really believe it is signaling a mega bullish wave!" said analyst Egrag Crypto in a Saturday post.
The metric has broken a bull pennant on the two-week timeframe, projecting an XRP dominance between 21% and 275%.
The analyst explained that the Visible Range Volume Profile (VRVP) reveals a significant gap above 5.75%, which aligns with the resistance identified by Dom.
This means that any close above 5.75%, which aligns with the Fib levels of 0.5 and 0.618 (8.59%), could trigger the bullish phase for XRP Dominance!
XRP/BTC suggests an "explosive" upward movement.
XRP is showing bullish signals even in terms of Bitcoin (BTC). The strong technical setup of XRP/BTC supports the thesis that XRP's best run is yet to come. XRP is attempting to break above a key resistance zone that has suppressed the price since mid-2019.
If the level is surpassed, it could trigger a massive upward move, as it did in 2018.
XRP price charts point to $20.
The monthly chart shows the price of XRP validating a bull pennant pattern, with the price facing resistance from the all-time high of $3.84.
A bull pennant is a continuation pattern that occurs after a significant increase, followed by a consolidation period at the top of the price range.
A monthly close above the upper trendline of the pennant at $2.55 will clear the way for XRP towards a target above $18, representing a 417% increase from the current price.

