What does Shiba Inu breaking below the 50-day EMA mean for its price?
Breaking below the 50-day moving average is an important technical indicator that indicates a weakening bullish momentum for Shiba Inu. This breakdown typically signals a shift in market sentiment towards bearishness, increasing the likelihood of further price declines. Currently, SHIB is trading close to $0.00001223, approaching a key support level that will determine its short-term trend.
How do bull traps affect Shiba Inu's market sentiment?
Initially, SHIB seemed to rebound strongly, testing the $0.00001400 area. However, this movement ultimately proved to be a typical bull trap, with prices spiking briefly to attract buyers before quickly falling back below the key moving average. This reversal led to increased selling pressure and a loss of confidence among traders, reflected in the spike in volume during the decline.
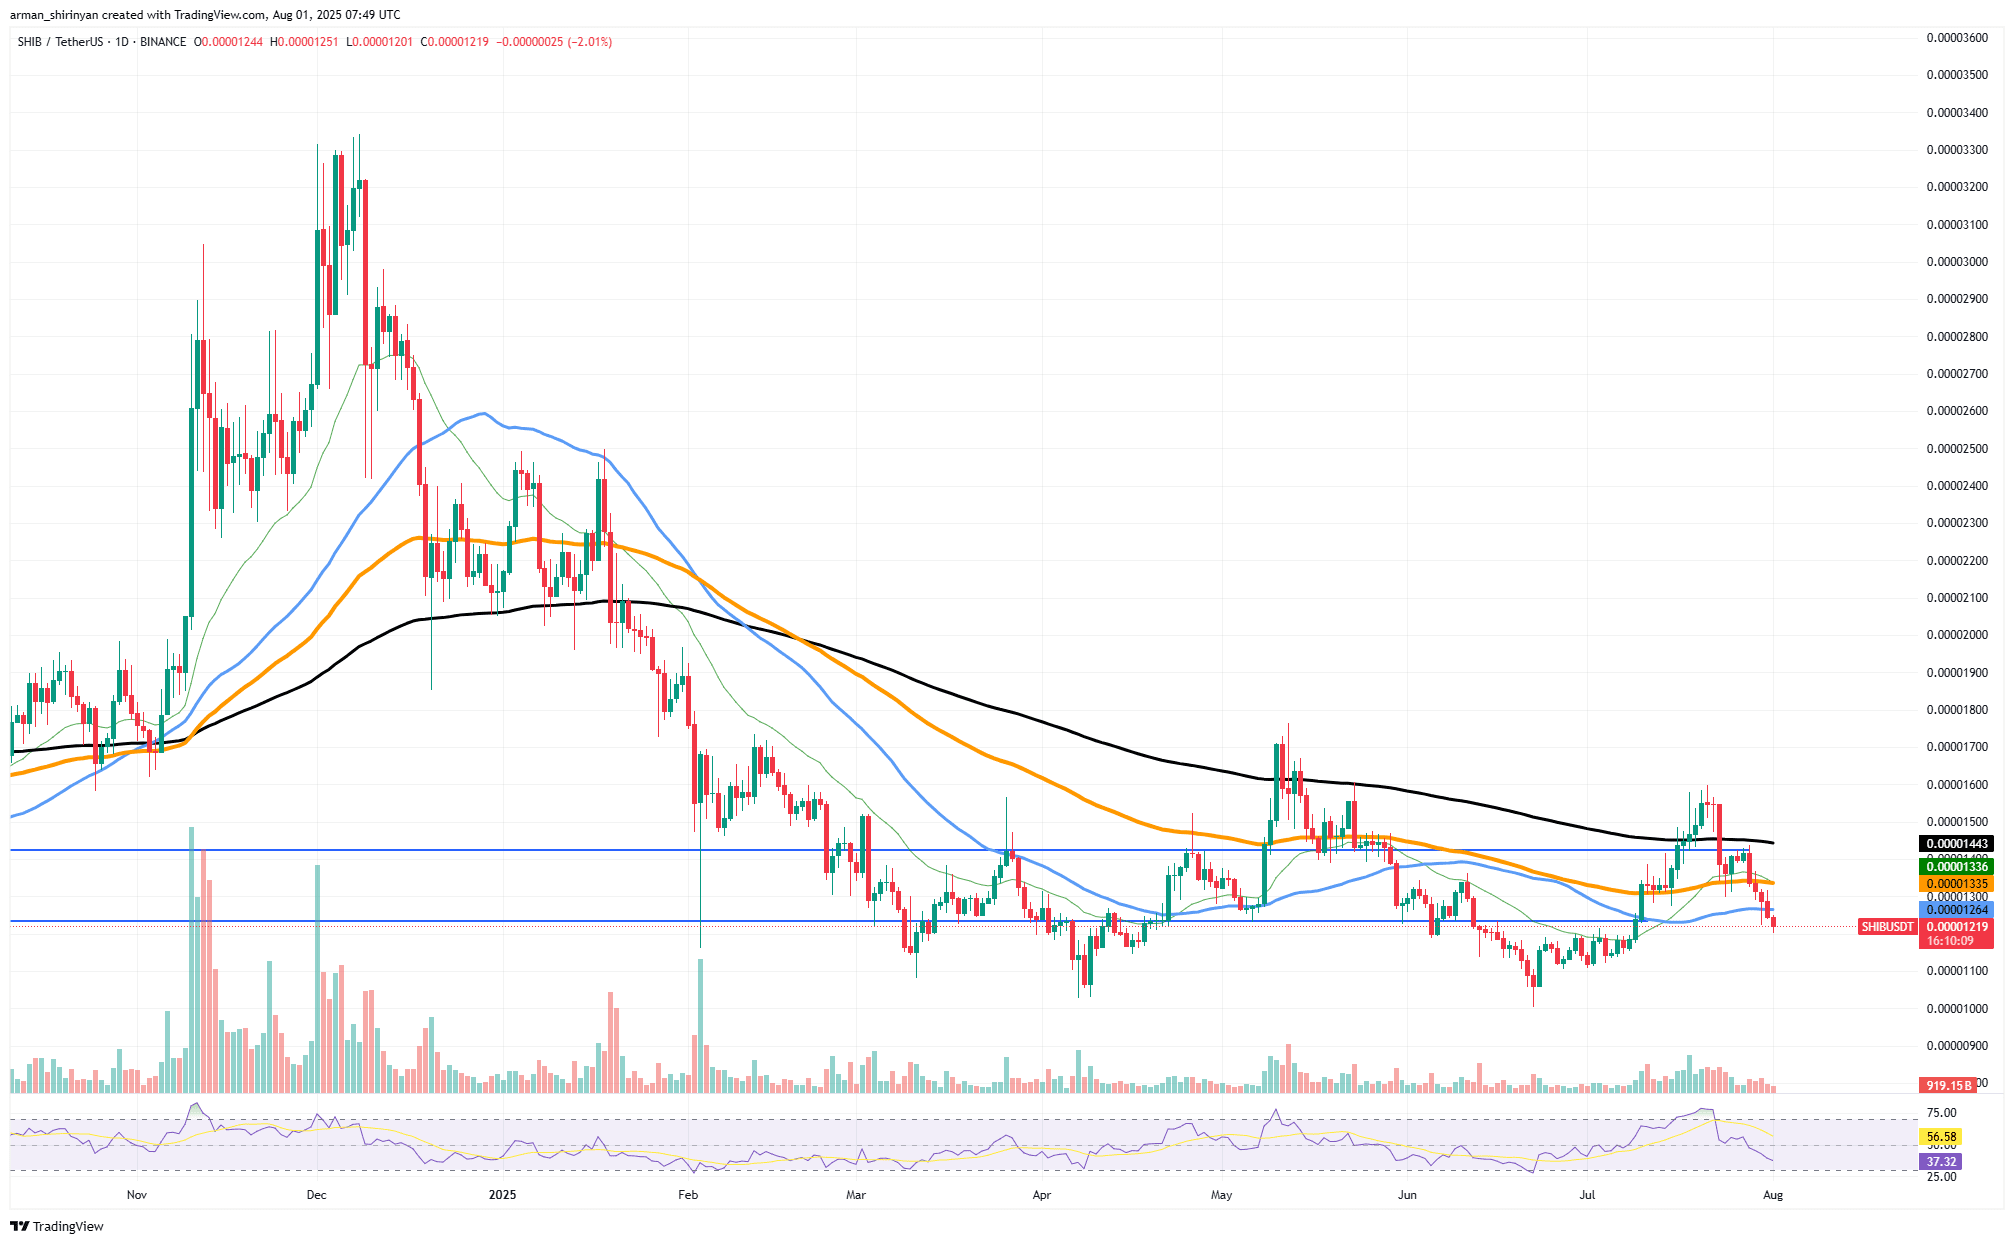
SHIB/USDT Chart (provided by TradingView)
What are the key technical indicators for Shiba Inu?
The Relative Strength Index (RSI) is trending towards oversold levels but shows no signs of divergence or rebound, indicating continued bearish momentum. Volume analysis shows that the recent price decline was accompanied by increased selling activity, confirming insufficient buying support. These technical signals suggest that investors considering adding new positions should proceed with caution.
What will happen if SHIB breaks below the next support level?
If SHIB breaks below the next structural support level around $0.00001100, it could trigger a more severe downward trend or long-term price stagnation. Historically, SHIB breaking below key moving averages has led to prolonged bear markets, highlighting the importance of this support level for market stability.
Current values of technical indicators: 50-day EMA price dropped to ~$0.00001223, bearish signal, potential downward trend; Relative Strength Index below 50, close to oversold, bearish momentum, not yet rebounding; volume indicates increased selling pressure, strong selling activity confirms the decline.
Frequently Asked Questions
What are the reasons for the recent decline in Shiba Inu's price?
The decline in Shiba Inu prices is mainly due to breaking below the 50-day EMA, triggering a shift in bearish sentiment and increasing selling pressure from traders.
How should investors view SHIB in the current market environment?
Investors should proceed with caution and avoid hasty buying on dips, as technical indicators suggest that bearish momentum will persist until SHIB can reclaim the key moving average.
How to respond to the current market conditions of Shiba Inu?
To manage risk in the bearish trend of SHIB, investors should:
Closely monitor the critical support level around $0.00001100.
Wait for confirmation of a reversal above the 50-day EMA before increasing exposure.
Use technical indicators such as RSI and volume trends to gauge market sentiment.
Key Points
Bearish breakout: SHIB breaking below the 50-day EMA indicates a shift towards negative momentum.
Critical support level: The level of $0.00001100 is crucial for observing potential further declines.
Investor Notice: Technical indicators advise cautious risk management to avoid impulsive buying.
Conclusion
Shiba Inu's recent technical breakdown below the 50-day moving average highlights a significant shift towards bearish trends, increased selling pressure, and weakened momentum. Investors should remain vigilant and pay attention to key support levels and market signals before making decisions. The coming weeks will determine whether SHIB can rebound or faces prolonged downward pressure.
#加密市场回调 #美国加征关税 #柴犬币 #稳定币热潮 #以太坊十周年
Continue to monitor A2Z NIL ATM SPK SC