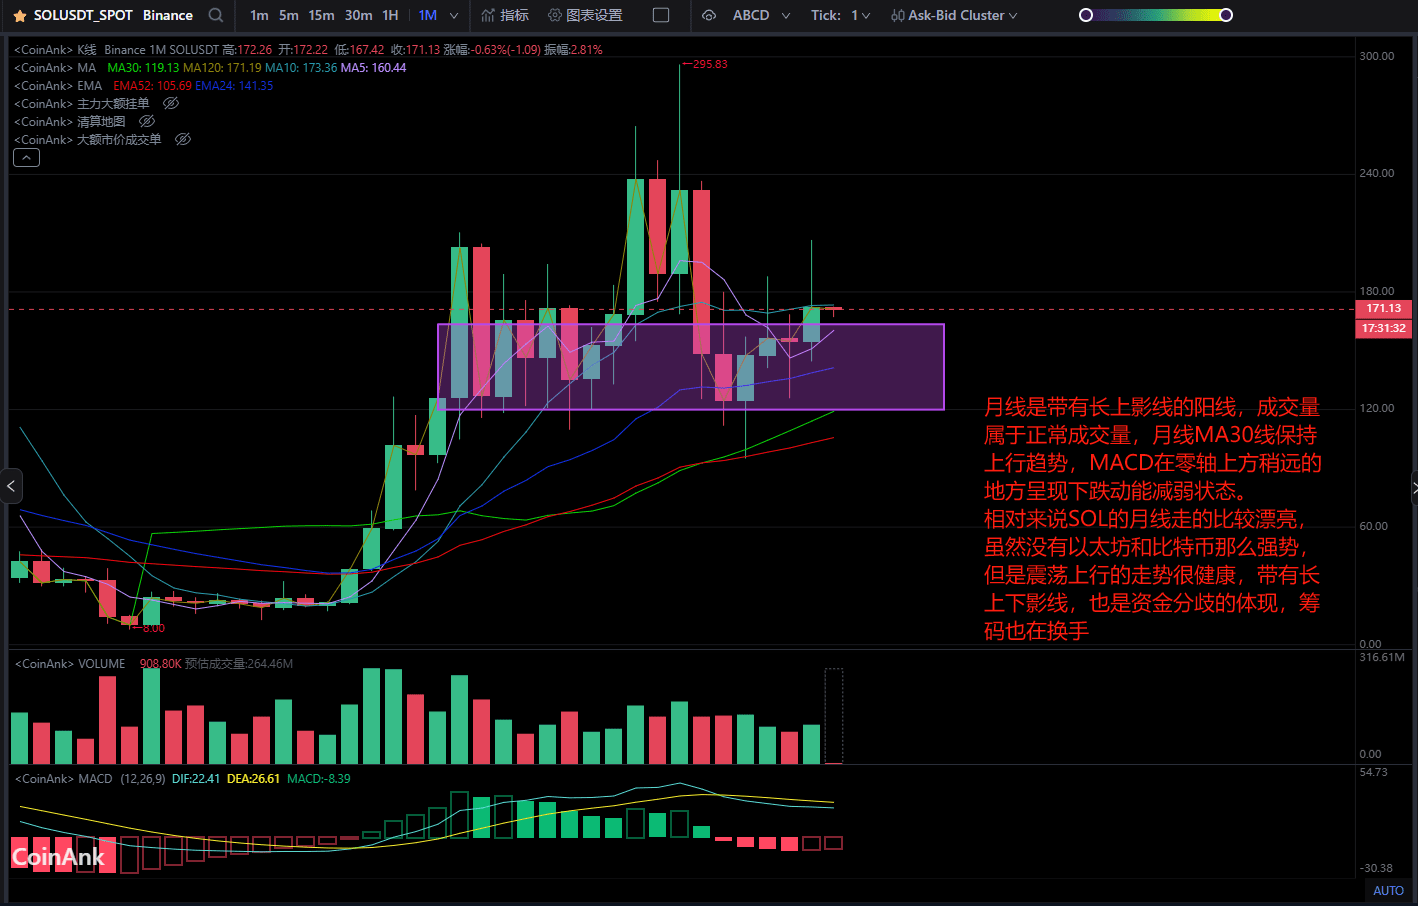
The monthly chart shows a bullish candle with a long upper shadow, and the trading volume is within a normal range. The monthly MA30 line maintains an upward trend, while the MACD shows a weakening of bearish momentum slightly above the zero axis.
Relatively speaking, SOL's monthly chart looks quite good. Although it is not as strong as Ethereum and Bitcoin, the upward consolidation trend is very healthy, featuring long upper and lower shadows, which also reflects capital divergence as the chips are being rotated.
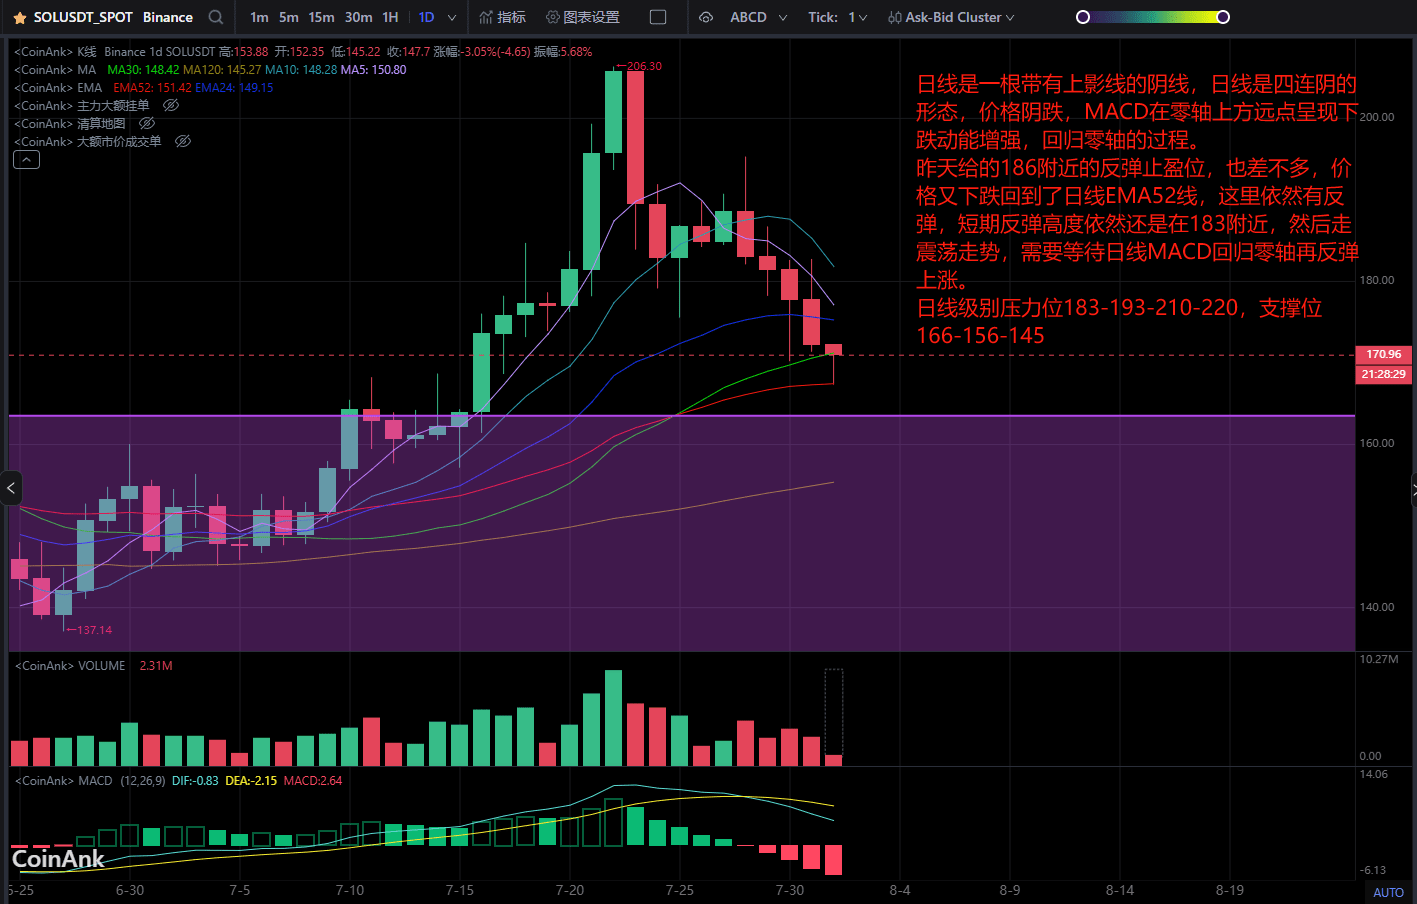
The daily chart shows a bearish candle with an upper shadow, forming four consecutive bearish candles. The price is declining, and the MACD is showing an increase in bearish momentum above the zero axis while returning to the zero axis.
The take-profit level for the rebound near 186 given yesterday is also about the same. The price has dropped back to the daily EMA52 line, where there is still a possibility of a rebound. The short-term rebound height is still around 183, followed by a consolidation trend. We need to wait for the daily MACD to return to the zero axis before rebounding and rising.
Daily resistance levels are 183-193-210-220, support levels are 166-156-145.