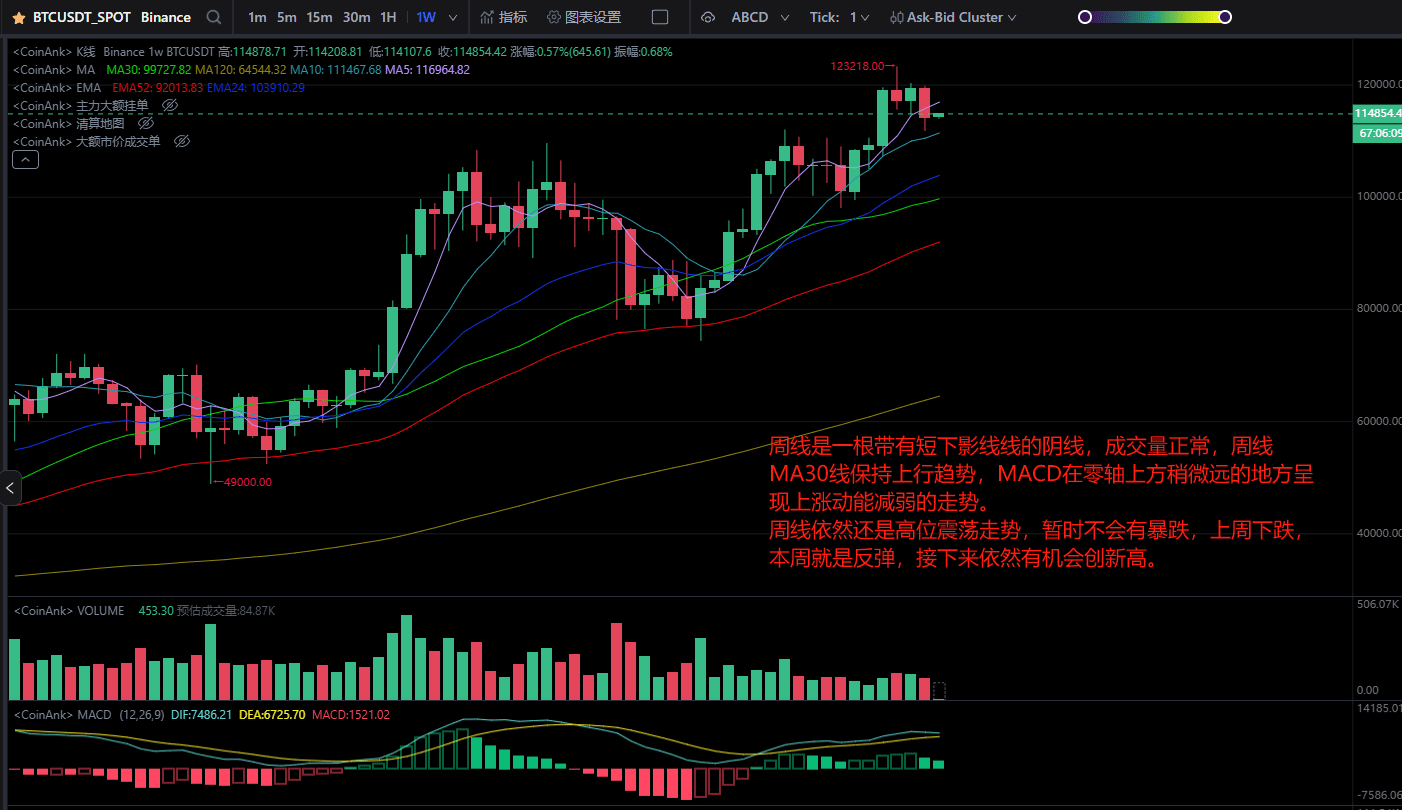
The weekly chart shows a bearish candle with a short lower shadow, with normal trading volume. The weekly MA30 line maintains an upward trend, and the MACD shows a weakening upward momentum slightly above the zero axis.
The weekly chart is still in a high-level oscillation trend, and a sharp drop is not expected for now. Last week saw a decline, and this week is a rebound, with further opportunities to reach new highs.
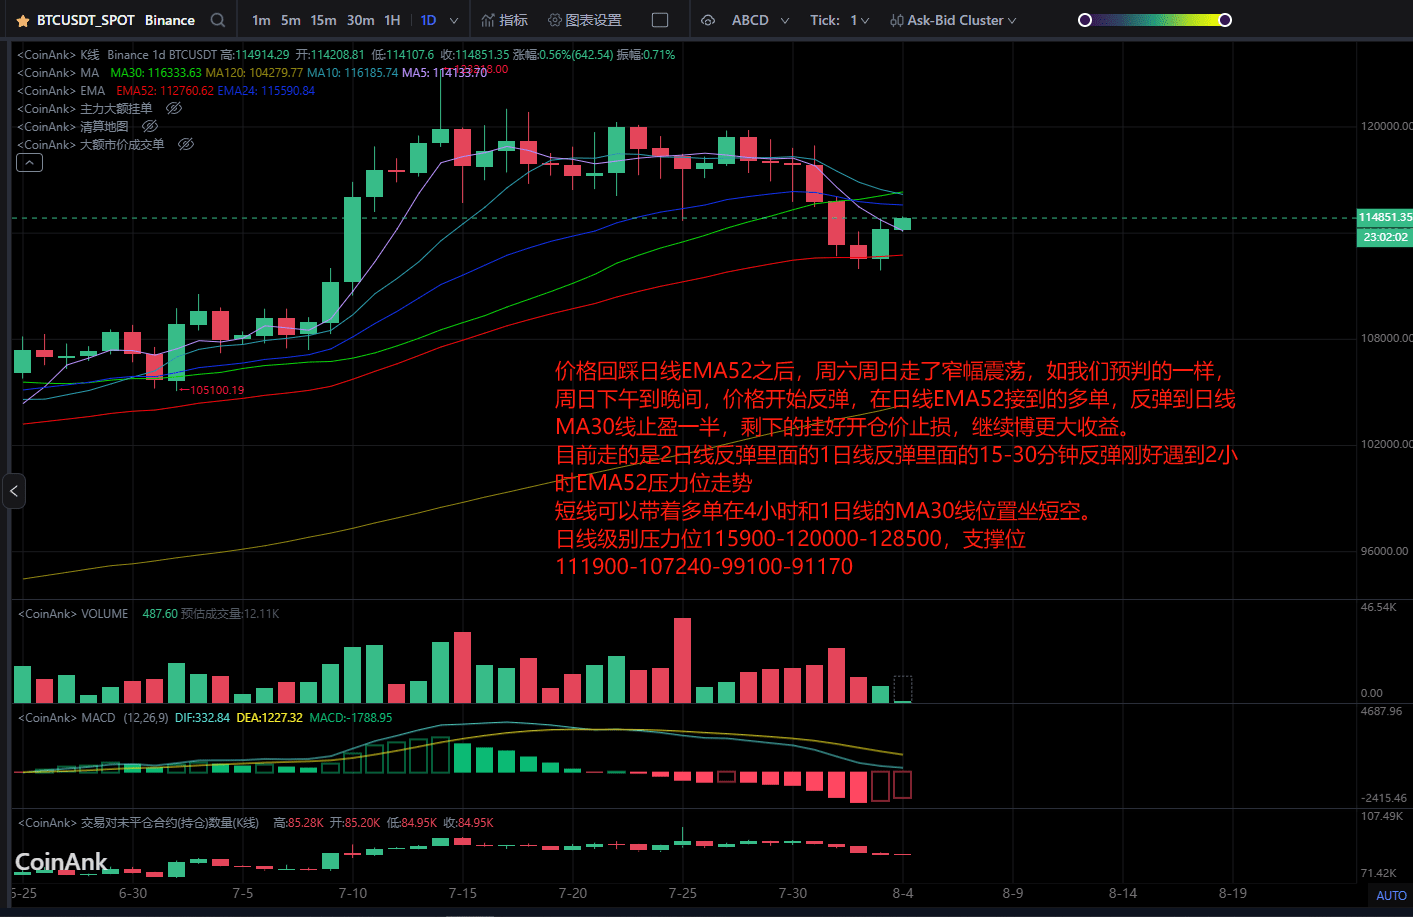
After the price retraced to the daily EMA52, it moved in a narrow range over the weekend. As we predicted, by Sunday afternoon to evening, the price began to rebound. The long positions opened at the daily EMA52 took profit halfway at the daily MA30 line, and the remaining positions were set with stop-loss at the opening price to continue aiming for greater gains.
Currently, we are experiencing a rebound on the 2-day line within a 1-day rebound, coinciding with the 15-30 minute rebound that just met the 2-hour EMA52 resistance level.
Short-term, you can hold long positions and short at the MA30 line positions on the 4-hour and daily charts.
Daily resistance levels 115900-120000-128500, support levels 111900-107240-99100-91170