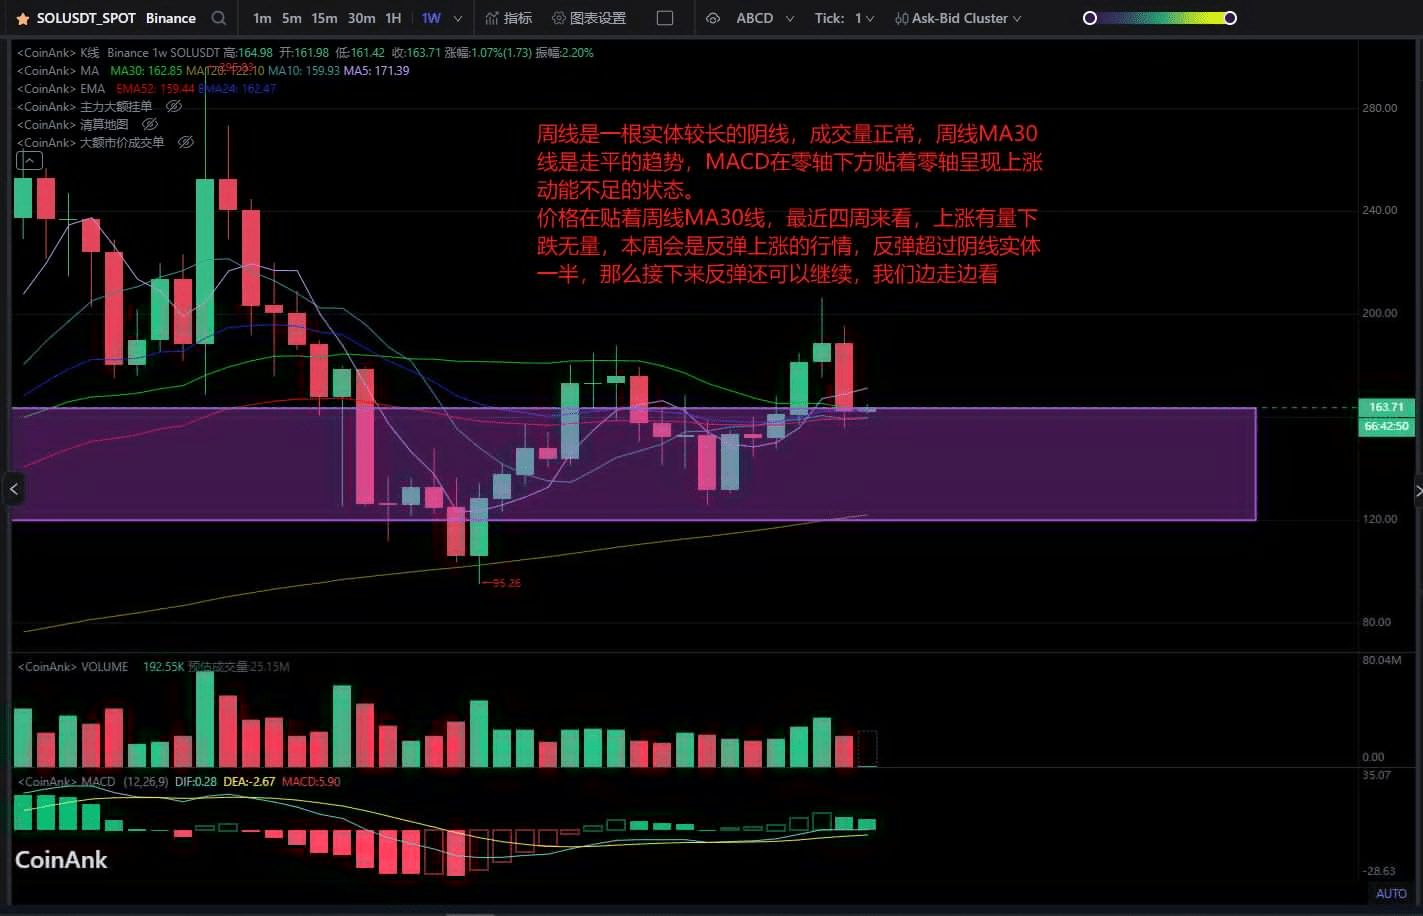
The weekly chart shows a long bearish candlestick with normal trading volume. The MA30 line on the weekly chart is trending flat, and the MACD is below the zero line, indicating a lack of upward momentum.
The price is close to the MA30 line on the weekly chart. Looking at the last four weeks, there has been volume during the rise and no volume during the decline. This week is expected to be a rebound upward. If the rebound exceeds half of the bearish candlestick's body, then the rebound can continue; we will observe as we go.
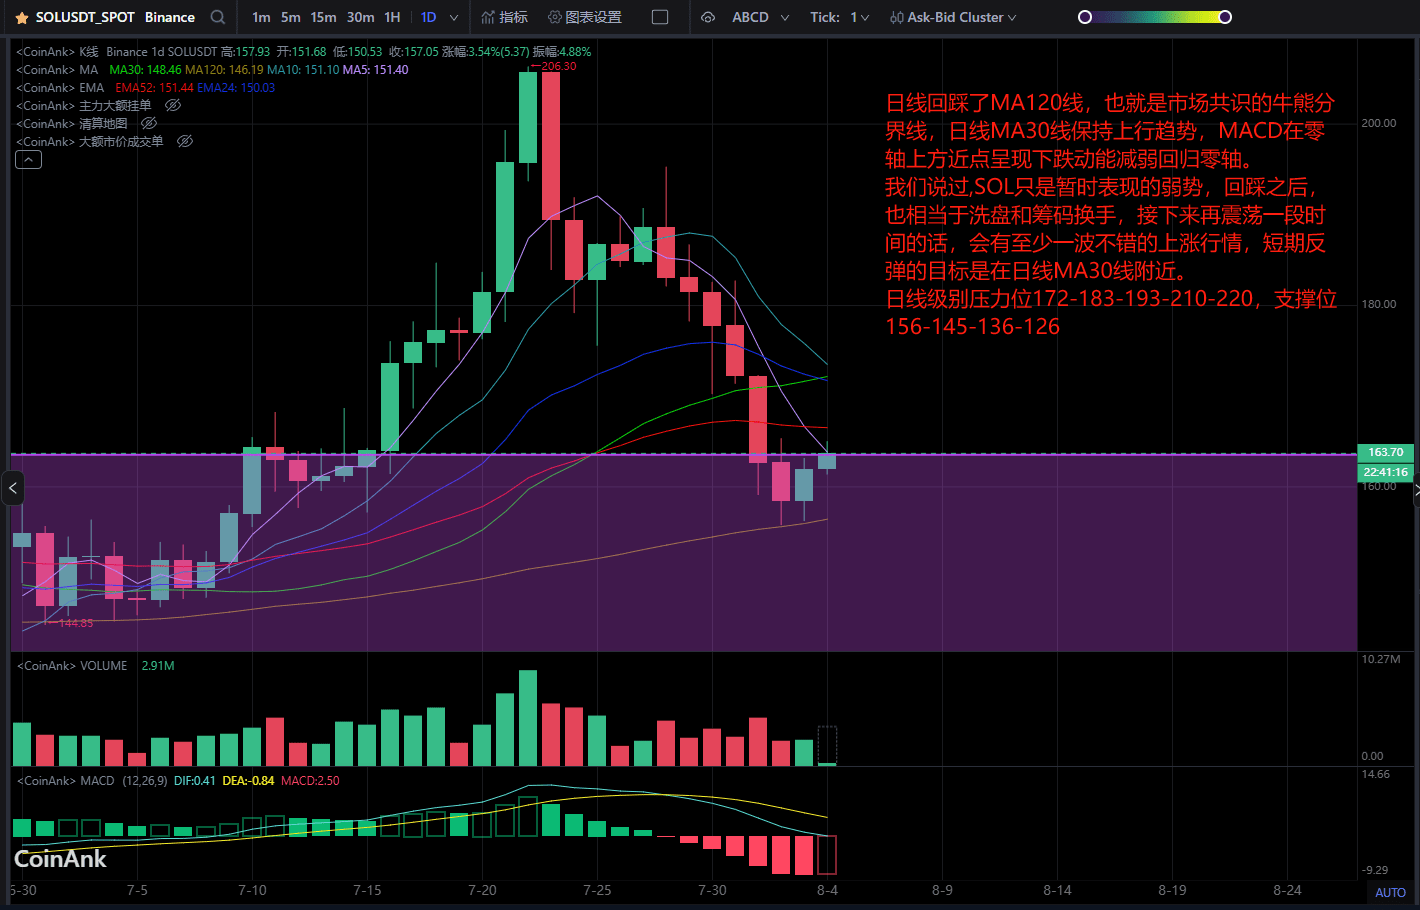
The daily chart has pulled back to the MA120 line, which is the market consensus dividing line between bullish and bearish. The MA30 line on the daily chart maintains an upward trend, and the MACD is showing a decrease in downward momentum as it approaches the zero line.
As we mentioned, SOL is only temporarily showing weakness. After a pullback, it is equivalent to a washout and a change of hands in the positions. If it continues to oscillate for a while, there will be at least one wave of decent upward movement. The short-term rebound target is near the MA30 line on the daily chart.
The daily chart resistance levels are 172-183-193-210-220, and the support levels are 156-145-136-126.