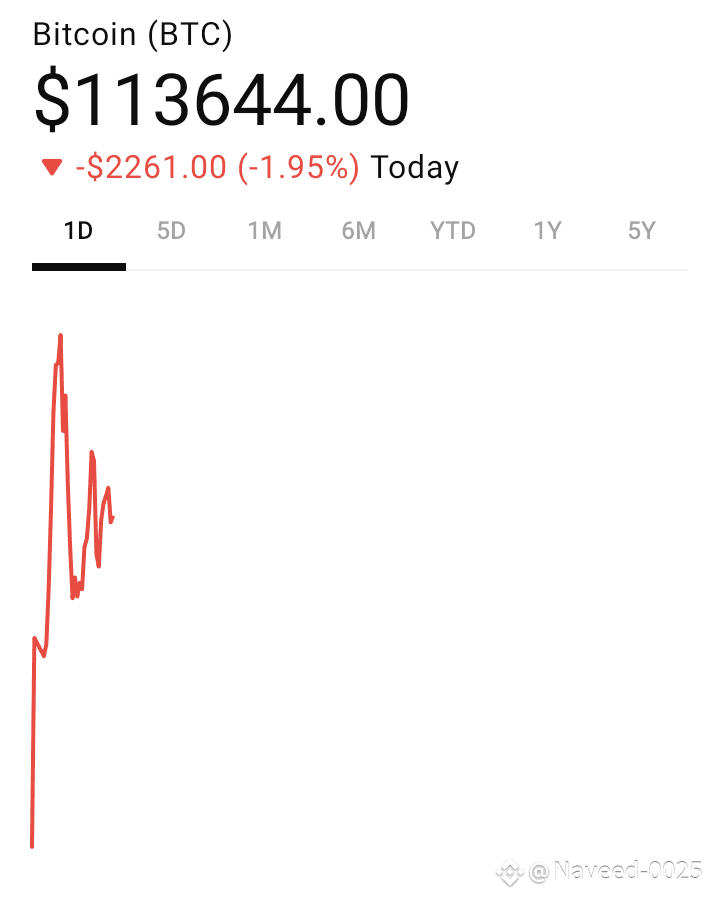
Here’s a snapshot of BTC’s current price and the recent plunge below the $113K mark:
📉 What’s Driving the Crash Below $113K?
1. Whale Selling & Long Liquidations
A dormant wallet moved $4.8B), triggering widespread profit-taking .
This action sparked over $450M in long-position liquidations and erased about $3.5B in unrealized gains across the market .
2. Failed Resistance Around $120–123K
BTC surged to all-time highs near $123K before forming a bearish engulfing candlestick, a classic reversal pattern .
Repeated rejections at $120K–$123K opened the door to selling pressure, pushing BTC back down .
3. Macroeconomic Pressure & Tariff Fears
Fresh U.S. tariff concerns rattled markets, prompting risk-off sentiment and broad crypto sell-offs, including in BTC .
That coincided with traders locking in profits amid uncertainty .
4. Diverging Technicals & Weakening Momentum
Weekly RSI now shows bearish divergence: price made higher highs but momentum made lower highs, signaling waning strength.
The Net Unrealized Profit/Loss (NUPL) is hovering in the 0.5–0.6 range—levels often associated with local market tops .
🔭 Technical Outlook & What May Come Next
Scenario Price Target Notes
Bounce from $115K support $115K–$116K Critical support zone; holding this may allow sideways consolidation or a bounce.
Break below support $110K–$112K Could trigger another round of liquidations toward this range.
Deeper correction **~$104K or lower** Weekly RSI setup echoes 2020‑2024 corrections; target ~$92K potential if momentum worsens .
If BTC reclaims $116K quickly, it could negate bearish pressures. Otherwise further downside is possible .
Analyst setups referencing the Quasimodo (QML) pattern suggest $113.6K as a key inflection zone .
✅ Why It Matters
This flagship flash crash underlines the power of institutional movements, macro shifts, and technical breakdowns all converging within hours.
It’s a reminder of how tightly pitched crypto markets are—where whale actions, ETF flows, and sentiment swings alike can deliver harsh, knee-jerk moves.
🧭 Strategy & What Traders May Watch
Short-term traders: watch for reclaim of $115K–$116K. Break below could signal short-term bearish continuation.
Long-term holders: dips toward $104K–$110K may offer opportunities if fundamentals remain intact (e.g. spot ETF inflows).
Macro watchers: keep an eye on U.S. tariff announcements, Fed actions, and trade-policy headlines that could reignite volatility.