

Solana hit $206.30 before settling at $197.89, breaking above key resistance and confirming bullish continuation since late June.
RSI at 73.06 shows overbought levels, but strong MACD and rising volume support potential for further upside moves.
Price may face resistance at $205–$210; support is at $185–$190, with long term breakout potential targeting $300.
Solana’s recent price surge has gained strength and now is pushing past key resistance levels, showing renewed momentum across the broader crypto market. Today, SOL reached a daily high of $206.30 before pulling back slightly to trade at $197.89.
This move follows a strong upward movement from late June’s levels near $140. The asset now is within a larger bullish structure, building toward a potential breakout beyond its historical highs.
Broadening Wedge Builds Pressure for Higher Moves
SOL’s price structure shows a consistent trend within a broadening ascending wedge on the 3-day timeframe. The token has respected two upward sloping trendlines since late 2023. This pattern has delivered cyclical highs and corrections while maintaining clear support and resistance boundaries.
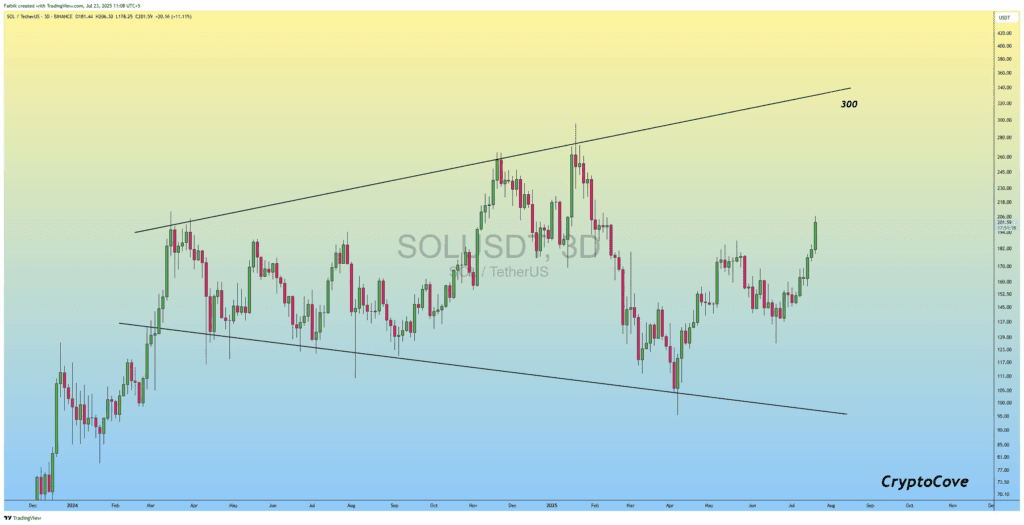 SOL/USDT 3-day price chart, Source: Captain Faibik on X
Notably, price action has now broken above previous highs near $180–$185. This confirms bullish continuation from the accumulation phase in May and June, where $120–$140 acted as a launchpad. With prices now testing $200 level, bullish pressure continues to rise.
Overbought Readings Signal Possible Near Term Pullback
While momentum remains strong, technical indicators show early signs of overextension. The RSI is at 73.06, above the overbought level of 70. This suggests a possible short term correction or consolidation phase.
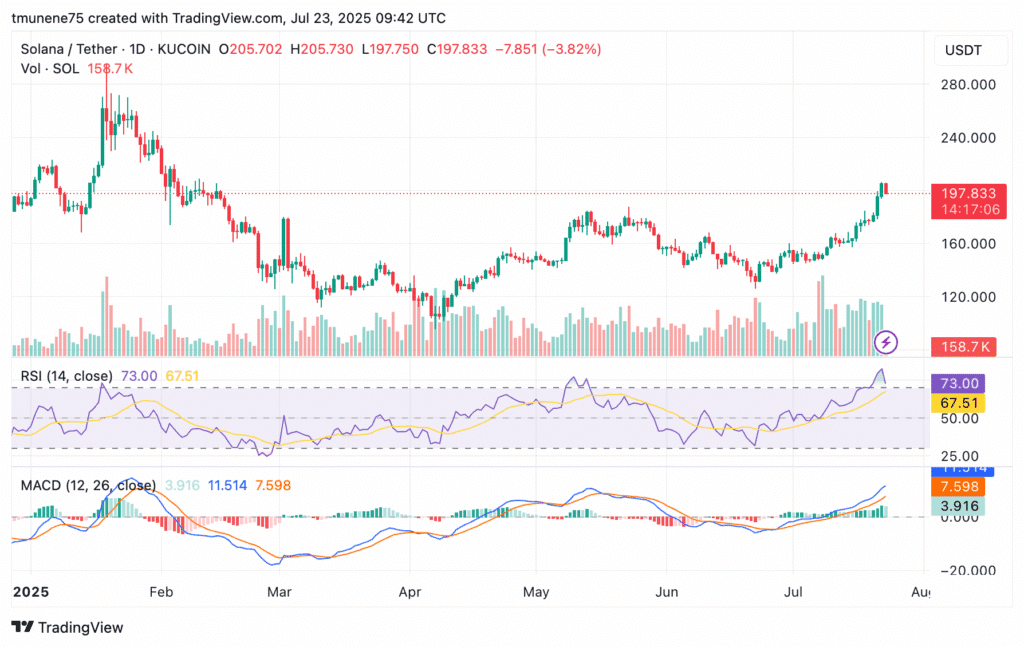 SOL/USDT 1-day price chart, Source: TradingView
However, the RSI support at 67.51 could act as a near term guide if selling pressure emerges. At the same time, the MACD is strongly bullish. The MACD line at 11.519 is well above the signal line at 7.599, with a positive histogram reading of +3.919.
Volume also supports the current uptrend. Trading activity is at 158.71K, a rise from previous sessions and strengthening confidence in the ongoing rally.
Key Zones to Watch as Price Tests Resistance
SOL faces immediate resistance around the $205–$210 zone, where today’s rejection at $205.73 formed a short pullback. If the price holds above $200, it could pave the way for a push toward $225–$240.
However, if momentum weakens, the token may retrace toward $185–$190, which now acts as a likely support range. A drop below $190 may extend losses toward $170, matching earlier consolidation levels.
The wedge’s upper boundary aligns with the $300 psychological mark, which is the broader technical target if current momentum persists.
Solana Maintains Momentum Amid Rising Volatility
Solana is trading within a strong macro structure, with bullish momentum building above previous resistance levels. RSI and MACD indicate strength but caution for short term pullbacks. The market is monitoring the $185–$210 zone as the next key decision area, while long term targets are valid above the $250 level.
The post Solana Breaks Above $200 as New All-Time High Comes Into View appears on Crypto Front News. Visit our website to read more interesting articles about cryptocurrency, blockchain technology, and digital assets.

