The market has finally caught its breath after a significant previous surge.

XRP is heating up again. After a strong breakout above the $2.80 resistance level, the asset's price briefly surpassed $350, erasing months of sideways consolidation. However, a second wave of price momentum may be brewing, pushing XRP to break through the highly anticipated $5 mark, indicating that the rally is not yet over.
From a technical perspective, XRP is performing excellently. The 200-day, 100-day, and 50-day moving averages are currently forming a perfect bullish trend, and the asset has broken through all the significant resistance zones that previously suppressed its rise. Currently, the prior consolidation area (between $2.40 and $2.80) provides strong support, creating an ideal foundation for XRP's secondary rise.
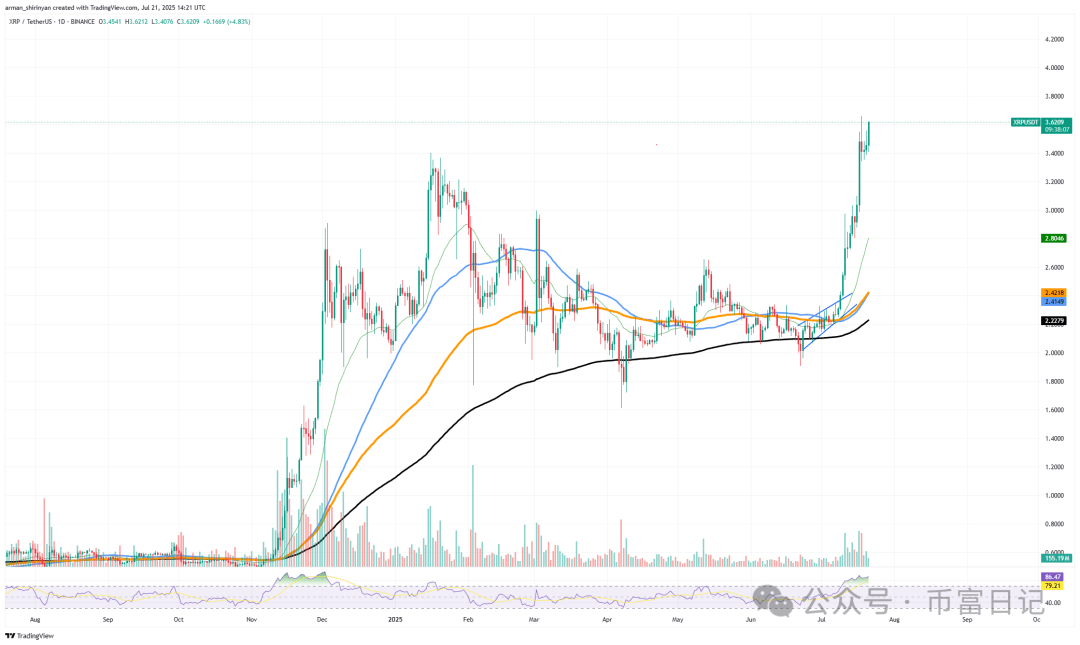
Although signs of stabilization are showing, momentum indicators remain high. The RSI has not significantly reversed, indicating that bulls are still hungry, even as the market remains in the overbought zone. In terms of price, it has formed a narrow range below recent highs, which typically occurs before a secondary wave begins, especially in a market with the current trend.
The key element that needs to recover is trading volume. After breaking above $3.50, trading volume has declined. XRP needs to accelerate upward again to break through the psychological barrier of $4 and approach $5, indicating that institutional and retail demand is beginning to influence the market again.
If XRP can maintain above $3.30 and trading volume increases again, then from a technical standpoint, the path to $5 for XRP is feasible. The road for a strong upward movement is open, as there is almost no historical resistance between the current price and $5, especially with Bitcoin and Ethereum continuing to provide macro support.
Solana is finally catching up
Finally, Solana is catching up. SOL has achieved one of the most convincing bullish trends in months, soaring above $180 after lagging behind other major assets like Ethereum and XRP. This breakout could allow the asset to get back on track after a long period of underperformance and signal the start of a full bull market.
From a technical perspective, SOL's structure has changed significantly. The typical ascending triangle pattern (which usually indicates a continuation of the uptrend) and strong volume support accompanied the breakout above the $180 area, so this is not just a coincidental surge. Additionally, SOL has boldly broken through all major moving averages, including the 50-day, 100-day, and even the critical 200-day EMA.
These moving averages have begun to tilt upward, which is a typical bullish signal. Months of consolidation and range-bound trading have ended with this upward move. Due to the immense pressure from the EMA, SOL had failed to regain bullish momentum from April to the end of June. However, this breakout has changed the course of events.
Solana's performance has far exceeded the market, rather than simply following it. From a broader perspective, this move keeps Solana aligned with the bullish trajectory of the entire market. ETH and XRP have already set local new highs, while SOL has been stagnant.
Due to the recent trends, it is finally catching up and gaining strong momentum. Looking ahead, the psychological barrier of $200 is the next important area to watch. If SOL breaks through this level, it may surge toward $230-$250.
Although the RSI is approaching the overbought zone, momentum remains strong. If the market remains optimistic, Solana may be able to reclaim its position in the market, becoming a leader rather than a follower.
The rapid rise of Dogecoin
Dogecoin (DOGE) has broken through the critical $0.20 resistance level (which has historically been a resistance and turning point for this meme coin), impressively indicating that its upward momentum is strong. After weeks of narrow consolidation, Dogecoin surged nearly 40% in just a few days, kicking off an important momentum-driven rebound.
From a technical perspective, Dogecoin's chart shows clear signs of a trend reversal. The asset has broken through three major moving averages—the 50, 100, and 200 EMA—of which the 50 EMA is currently rising sharply. However, recovering the area above the 200 EMA is the most important indicator that would turn the long-term bearish trend into a more bullish one.
Notably, Dogecoin has clearly broken through the ascending channel pattern formed at the end of June and early July. This opens the door for a rapid rise to the $0.27 to $0.28 range, and Dogecoin is currently still in that range after breaking through the pattern. While there is not much resistance on the way up to this level, from a price structure perspective, the next possible resistance level is around $0.30.
Trading volume has been steadily increasing, which is another important aspect of the rationality of this rebound. Additionally, the RSI has currently entered the overbought zone, which may indicate a upcoming slight pullback or even short-term consolidation. However, it is unlikely that Dogecoin will lag behind, as market sentiment favors high beta altcoins, and the overall bullish momentum is driving up all cryptocurrencies from Ethereum to Ripple.
If the resistance level at $0.30 is broken and bullish momentum continues, the next target price could reach $0.35 or even higher. Theoretically, this meme coin may seem like a joke, but its price chart currently is not amusing. Investors and traders seeking breakout opportunities should not underestimate Dogecoin.