For cryptocurrency traders, this week is a good time to invest in XRP, Ethereum, and Dogecoin. Of course, any other currencies are also an option, but considering that Bitcoin has performed relatively flat over the past seven days, these three currencies are especially noteworthy.
What exactly is happening? What do these charts suggest about the future movements of XRP, ETH, and DOGE? Let's dive deeper:
The cryptocurrency market is experiencing one of the most explosive rebounds since 2021, with the total market cap surging back to the second highest in history after briefly touching $4 trillion last week. Meanwhile, Bitcoin's price broke its historical high on July 14, reaching $122,838, triggering strong bullish sentiment among cryptocurrency perpetual bulls.
The overall macroeconomic situation is also optimistic for investors. The S&P 500 continues to approach the 6,000 point mark, while oil prices remain relatively stable at around $76 per barrel, despite ongoing tensions in the Middle East. More importantly, the passing and signing of the (Stablecoin Bill) (GENIUS Act) establishes a regulatory framework for stablecoins in the U.S., which is seen as a step in the right direction for institutional investors who have long sought regulatory transparency.
This perfect storm of favorable conditions has sparked a new Alt season, with its index soaring to 59 points, just 2 points shy of the annual high set on January 30.
Ethereum (ETH): The King of Altcoins Returns
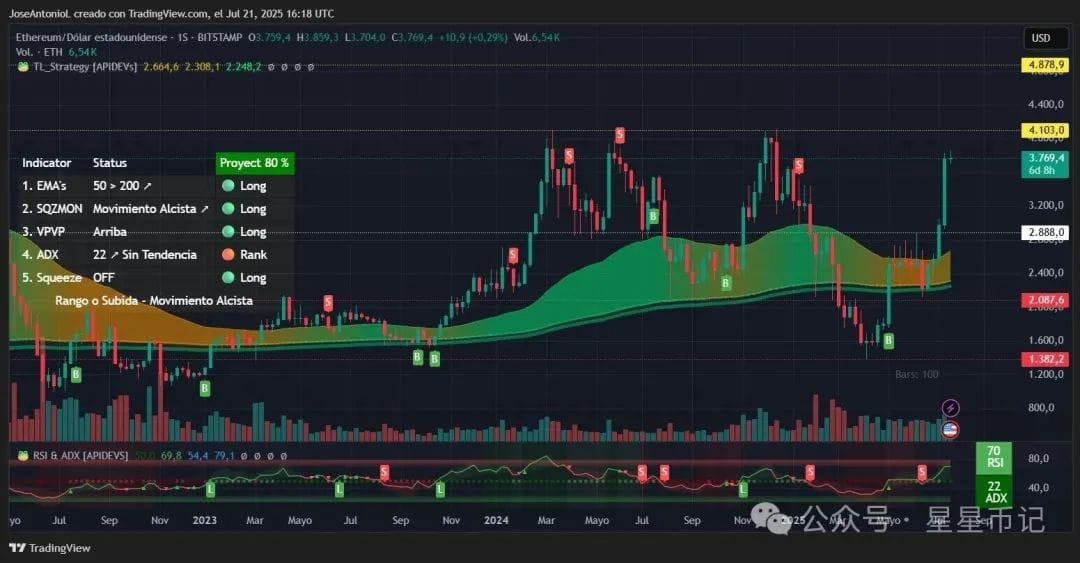
Ethereum has become a leader among major cryptocurrencies, rising 25.7% over the past week to $3,843, before retracing to around $3,769. This surge seems to have strong support from institutional investors, with the ETH spot ETF attracting $2.2 billion in weekly inflows.
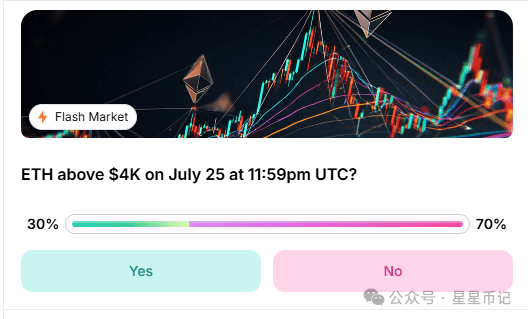
Myriad on Linea (a prediction market developed by Decrypt's parent company Dastan on Ethereum's Layer 2 network Linea) shows that predictors are not overly bullish in the short term. Myriad users believe that Ethereum has only a 40% chance of breaking the psychological resistance level of $4,000 on July 25.
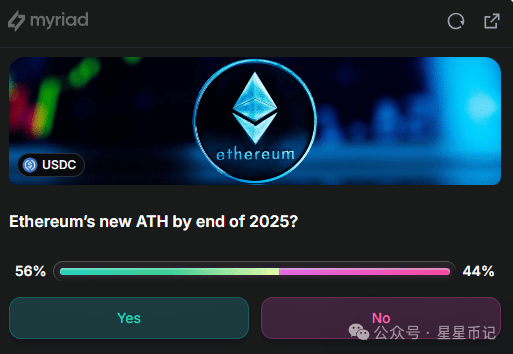
In contrast, Myriad traders are more certain, believing that Ethereum has a 63% chance of reaching a new historical high (over $4,891) by the end of the year.
The technical side of Ethereum is interesting. The relative strength index (RSI) is as high as 70, indicating extreme bullishness in the market. The RSI can be viewed as a speedometer for price momentum—when it reaches such a high level, it means buyers are stepping on the gas. While an RSI above 70 usually indicates overbought conditions, which might raise concerns for day traders, in the context of a significant breakout, it actually confirms real buying pressure rather than mere speculation.
Given the high readings, traders might consider setting stop-loss levels near the current price to avoid potential large-scale liquidations, while still being able to achieve possible bullish pressure given that most indicators point to a greener future for the token.
The Average Directional Index (ADX) is at 22, approaching the critical threshold of 25. The ADX measures trend strength, regardless of direction. An ADX below 20 indicates no clear trend, while an ADX above 25 indicates a strong directional trend is underway. For Ethereum, this indicates we are on the verge of sustained growth rather than a fleeting moment.
This also indicates that the trend strength is insufficient to prevent a slight pullback. This situation may occur but will not affect the overall bullish trend.
Most importantly, Ethereum's price action relative to its moving averages indicates a bullish market. The current trading price of ETH is well above the 50-day moving average ($2,888) and the 200-day moving average (lower). The widening gap between these moving averages (known as moving average divergence) usually appears before a trend that lasts for several months. When a short-term average pulls away from a long-term average like this, it is like a rubber band being stretched before a strong rise.
The squeeze momentum indicator (which measures whether the market is in a contraction phase before significant volatility) has also issued a bullish signal, indicating that volatility is expanding after a period of consolidation, favoring the bulls.
Key level:
Immediate support level: $3,417 (Fibonacci 23.6% retracement level)
Strong support level: $2,888 (50-day EMA)
Direct resistance level: $4,103 (visible on the chart)
Strong resistance level: $4,282 (127.2% Fibonacci extension level)
XRP: The King of Bank Currency Returns
XRP rose 20.9% weekly to $3.52, marking a complete redemption arc for a cryptocurrency that has been mired in regulatory turmoil since 2018. The token finally broke through the previous historical high of $3.40, entering a true price discovery mode for the first time in seven years.
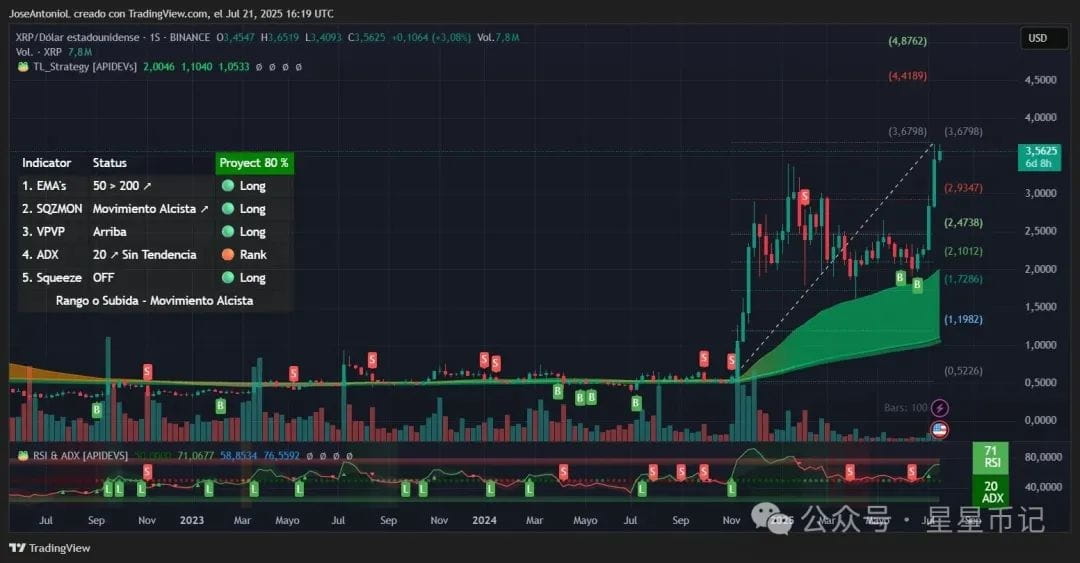
XRP's technical structure is fascinating. Its weekly chart appears somewhat unusual for a serious investment project: it has been flat for years, then suddenly experiences a parabolic surge. But that is the nature of cryptocurrency.
On the weekly chart, the RSI is at 71, just above the overbought threshold, but the background factors are crucial. After years of sideways consolidation, such readings could signal the beginning of a trend rather than an end. It is like a spiral spring that has finally been released—initial bursts may appear intense, but there is hidden energy built up over years.
Compared to other indicators, an ADX reading of 20 seems somewhat weak, but it is actually reasonable for XRP. After such a long period of consolidation, trend strength indicators naturally fall to low levels, making it difficult to overcome the norm that has existed for over five years. The fact that the ADX is rising to 25 indicates that a new trend has just begun to establish itself.
XRP's moving average configuration provides the strongest bullish signals. The 50-week EMA is significantly below the current level, and the gap with the 200-week EMA continues to widen. From the weekly chart perspective, this widening gap usually precedes a trend that lasts for several months, reflecting continued accumulation by long-term holders rather than short-term speculation.
Key level:
Immediate support level: $2.93 (previous resistance level turned support)
Strong support level: $2.47
Recent resistance level: $3.68 (recent high)
Strong resistance level: $4.4 - (Fibonacci extension target - theoretical natural target that may form during price trend period)
Dogecoin (DOGE): The King of Meme Coins Returns
Dogecoin surged 33.5% this week to $0.274, becoming the best-performing meme coin among the top 100, second only to Floki. Dogecoin is undergoing a fundamental transformation, with Nasdaq-listed Bit Origin announcing a $500 million Dogecoin reserve strategy, of which $40.5 million has already been completed in the initial purchase.
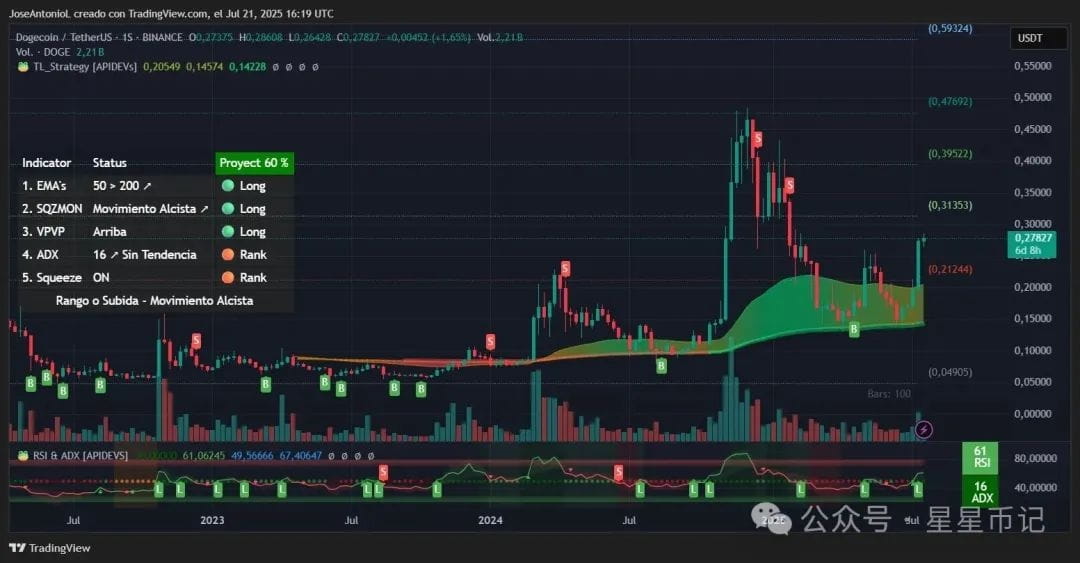
DOGE's technical indicators also show bullish momentum. The RSI is at 61, indicating strong buying pressure but not overextended—this is what traders refer to as the 'optimal point', where the trend can last for a long time.
An ADX of 16 means that the peak of the upward trend is actually weak, but remember that Dogecoin was in a long-term downtrend at that time. A low ADX reading after a strong trend usually foreshadows a consolidation before the next round of upward movement. If you are a Dogecoin trader, it is advisable to monitor this indicator in the coming days for a more accurate reading.
Notably, the squeeze momentum indicator shows an 'open' state, indicating that volatility has been compressed and is ready to expand. This might suggest that the bulls have failed to keep up after hitting price resistance, but given Dogecoin's successful breakout from a double bottom (a typically bullish formation where the price bounces off resistance twice, forming a 'W' shape with the 200-period EMA), conventional wisdom suggests that Dogecoin should encounter some resistance, but at least maintain its trend for several weeks.
Currently, the 50-day moving average (EMA) around $0.20 constitutes direct support, while the 200-day moving average (EMA) around $0.15 serves as support. Dogecoin (DOGE) is trading above both of these resistance levels, and the gap between them is steadily widening, confirming the bullish market structure.
Key level:
Immediate support level: $0.21 (psychological level and short-term EMA region)
Immediate resistance level: $0.28-0.30 (2025 high)


