In a market full of noise and volatility, the $ENA
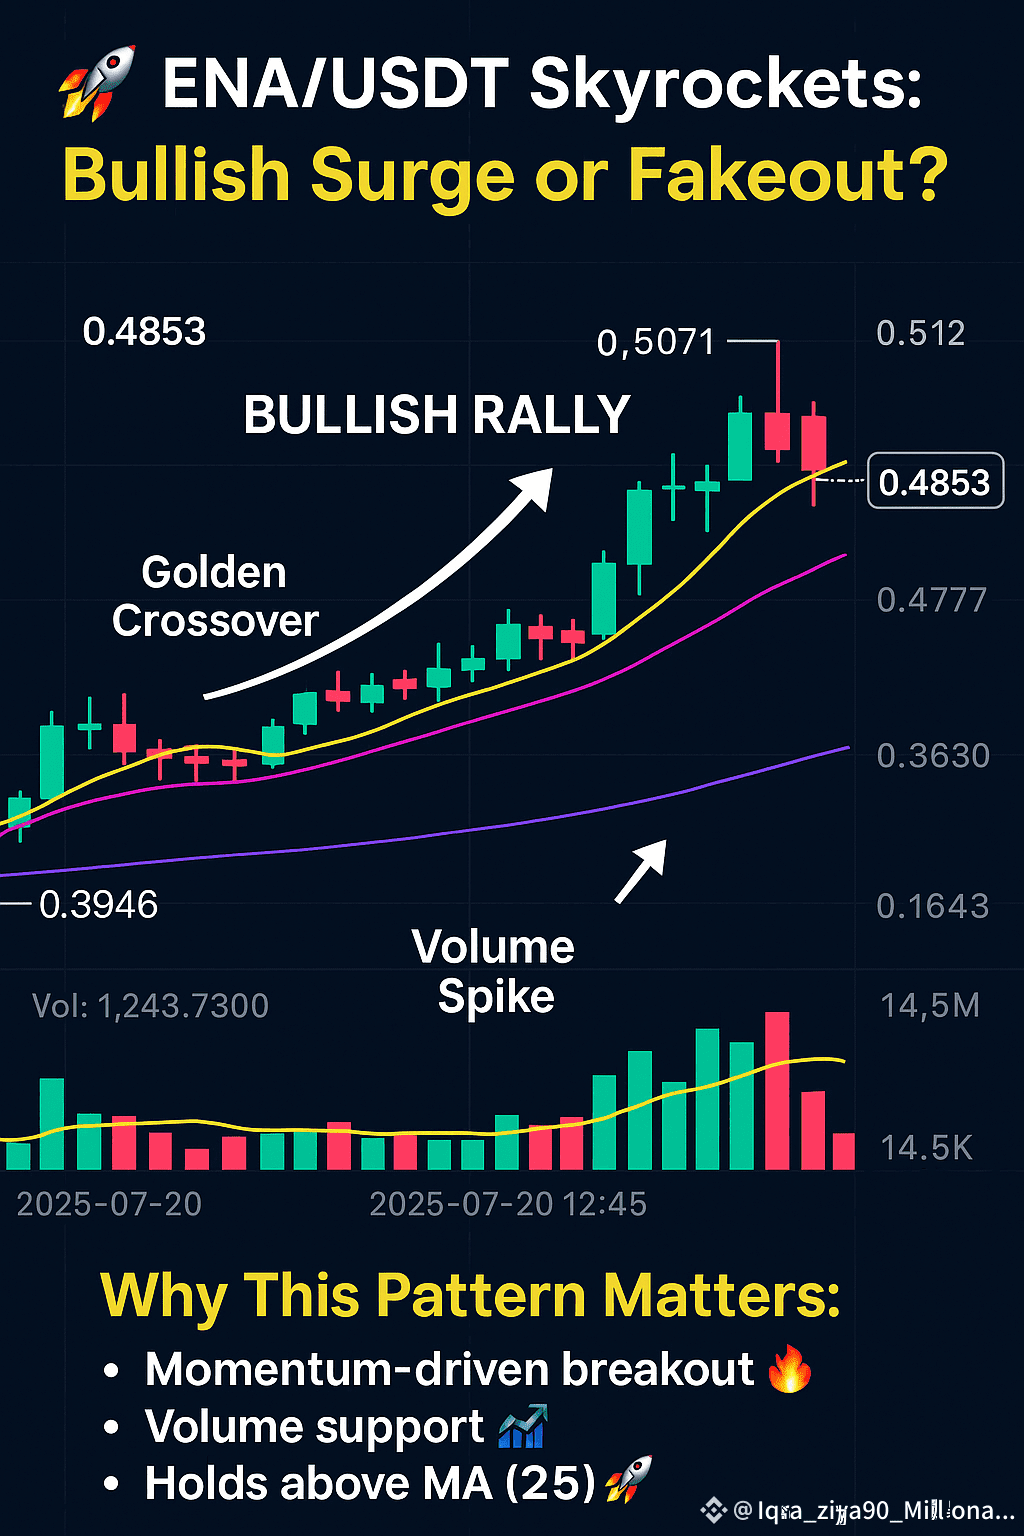
ENA/USDT chart has silently stolen the spotlight. With a 21.81% gain in 24 hours, this 15-minute chart showcases a textbook bullish rally that has traders buzzing.
What’s so special about this pattern? Let’s decode it 👇
🔍 Technical Breakdown:
From the lows of $0.3946, $ENA surged to a daily high of $0.5071, creating a steep and steady uptrend. The following indicators back this breakout:
MA(7) crossing above MA(25): A classic golden crossover signaling strong bullish momentum.
Candles consistently hugging the MA(7): Indicating healthy short-term buying pressure.
Support held firm above MA(25) even during pullbacks — showing strength and buyer confidence.
Volume spikes during breakouts, followed by healthy consolidation = Smart money is involved!
📈 Why This Pattern Matters:
This isn’t just another pump. It’s a momentum-driven breakout built on clean structure, volume support, and psychological levels. Every consolidation was bought up aggressively — a bullish sign that this rally is fueled by more than just hype.
If price consolidates above $0.48 and holds above MA(25), we could see another leg up. But if it breaks below $0.463, short-term profit-taking may push it into a correction zone.
🧠 Pro Tip for Traders:
🚨 Final Thought:
Whether you're a pro trader or a crypto enthusiast, this chart is a masterclass in breakout structure. It’s a pattern that tells a story — one of momentum, psychology, and market conviction. Eyes on $ENA . 👀
#ENA #crypto #BullishMomentum #CryptoChartAnalysis oon 🚀
