⚫ The recent $XLM
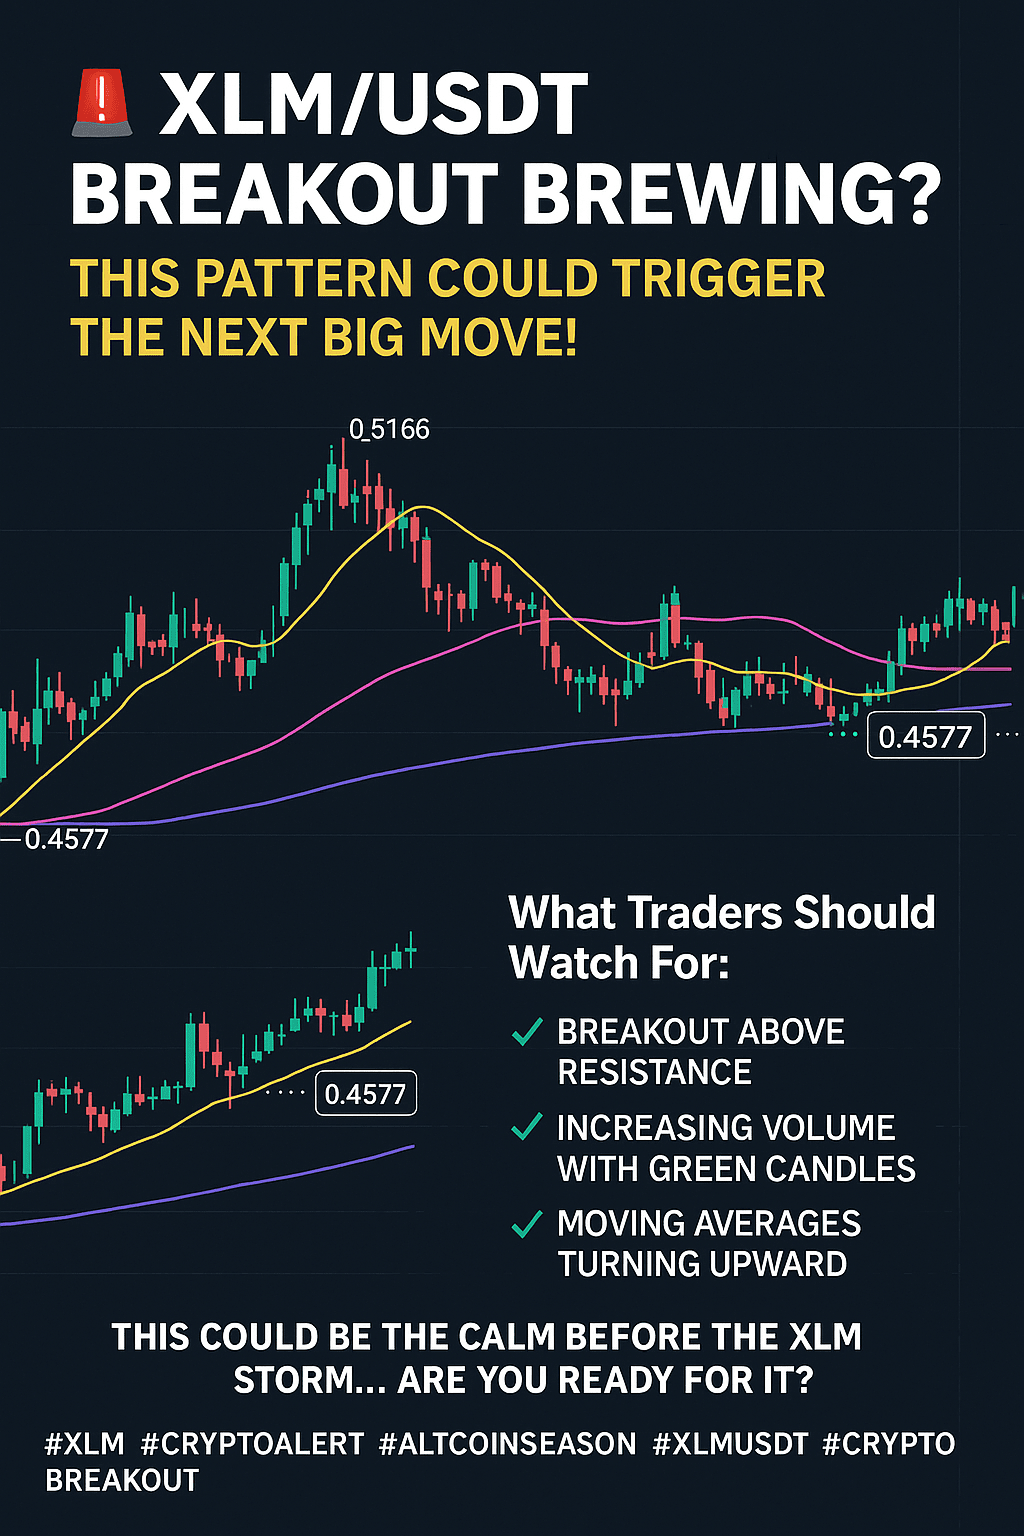
XLM/USDT 15-minute chart reveals a classic recovery pattern after a strong retracement from the local high of $XLM 0.5166. After a sharp dip to 0.4300, the bulls are showing signs of regaining control.
What’s catching traders’ eyes?
➡️A strong rebound from the 0.4300 support level.
➡️MA(7) crossing above MA(25) – a short-term bullish sign.
➡️Consistent volume surge – smart money may be loading up.
While the price is consolidating near 0.4577, this zone could act as a springboard. If the price breaks 0.4661, we could see a retest of the 0.4946 level — or even beyond if momentum builds.
🔎 What Traders Should Watch For:
✅ Breakout above resistance
✅ Increasing volume with green candles
✅ Moving averages turning upward
📈 This could be the calm before the $XLM storm… Are you ready for it?
#XLM #altcoinseason #crypto #BinanceSquareFamily #Binance