BTC/USDT Chart Signals a Hidden Comeback? Here’s What Traders Are Missing!"
$BTC
In the world of crypto, silence before a storm is often golden. The latest $BTC
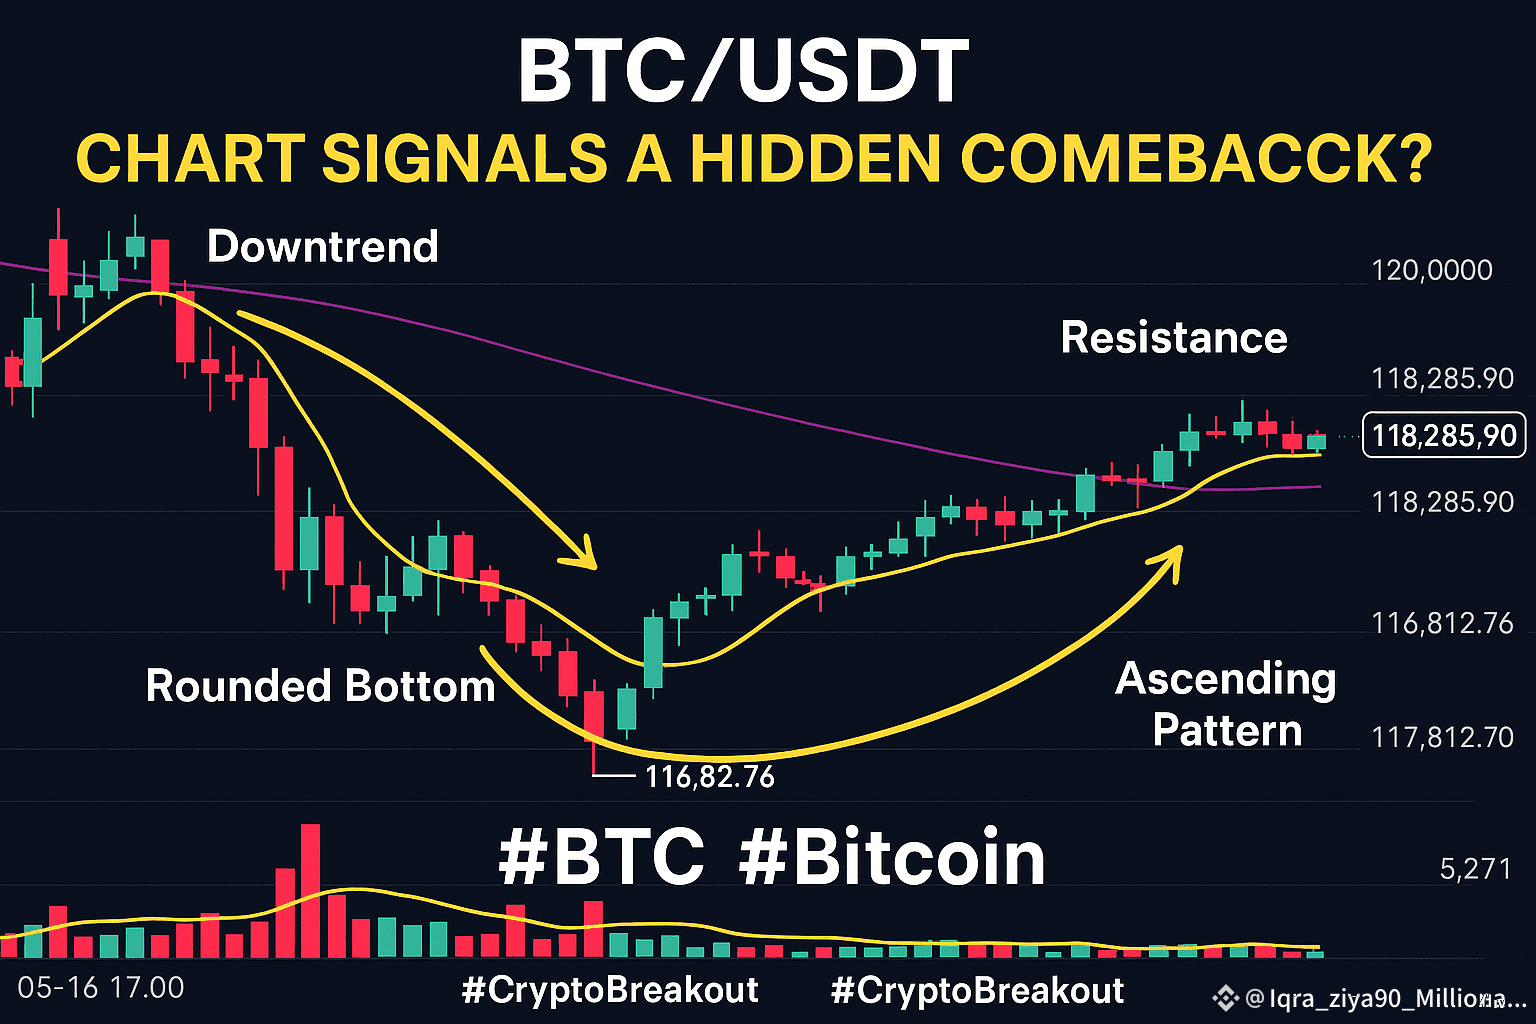
BTC/USDT 15-minute chart might look calm, but look closer — there’s a bullish whisper echoing through the candles.
After a strong downtrend where $BTC Bitcoin dipped as low as $116,812, the chart began crafting a silent but powerful ascending pattern. The buyers held the line, pushing against resistance and climbing steadily — a sign of growing bullish sentiment.
The moving averages (MA 7, MA 25, MA 99) are aligning for a possible crossover. If BTC breaks and sustains above $118,500, we could see a sharp rally toward $120K and beyond. On the flip side, support at $117,800 is crucial — if it holds, bulls stay in the driver’s seat.
🔍 Why This Chart Matters:
Shows resilience after heavy selling pressure.
Gradual recovery = strong hands accumulating.
MA convergence is often the calm before breakout.
This chart isn’t screaming “moon,” but it’s whispering opportunity for those who listen closely.
Disclaimer: Includes third-party opinions. No financial advice. May include sponsored content. See T&Cs. 