I know an old senior who invested 100,000 yuan in the cryptocurrency market, and his current market value is 42 million. He once told me something that enlightened me: "The cryptocurrency market is filled with a crowd; all you need to do is control your emotions, and this market is a cash machine!"
There are many methods for trading cryptocurrencies; however, not all methods can be mastered. We all hope to achieve good results using the simplest methods, while friends in the cryptocurrency world often struggle not due to lack of good coins but because they overthink!
Ten top mindsets that can help you thrive in the cryptocurrency world and earn big; I remind all cryptocurrency traders to keep these in mind:
1. The standard for judging skilled traders is primarily based on the duration of their cash positions: True experts do not simply profit during market upswings but are more importantly aware of when to decisively choose to be out of the market when it is unclear or risky. This patience and discipline are core elements leading to success.
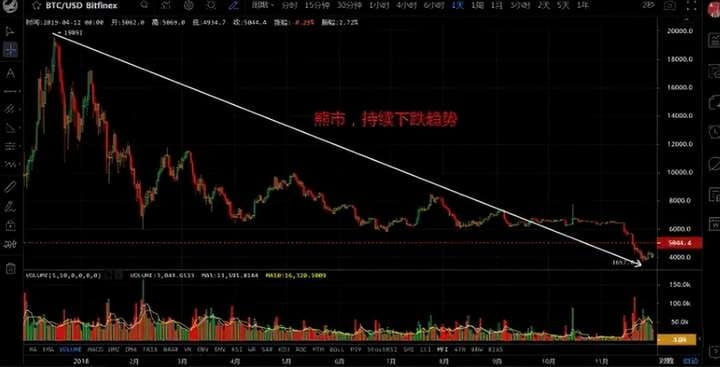
2. In a bear market, all purchases may be mistakes: During a bear market, the overall market trend is downward, making any buying action likely to encounter more significant declines. Therefore, maintaining a cautious attitude and minimizing trading, or refraining from trading until the market stabilizes or a bull market arrives, is the wisest choice.
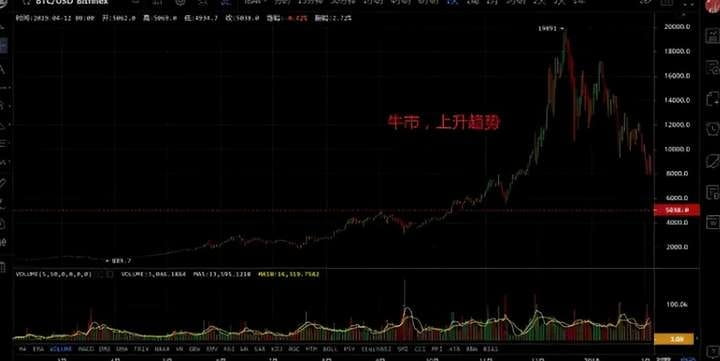
3. During a bull market, all sell-offs may be mistakes: In a bull market, prices continue to rise, and selling too early may result in missing out on greater profits. Persisting in holding positions and trading with the trend until a clear market reversal occurs is advisable.
4. The essence of investing is buying low and selling high: It seems incredibly simple, yet it is fraught with challenges in practice. The core point is to have enough patience to wait for the right entry and exit points, without being swayed by short-term market fluctuations.
5. The direction of the market is determined by the main funds: The primary direction of the market is driven by large-scale capital. Understanding the dynamics of the main funds can help us trade with the trend and avoid falling into counter-trend operations.
6. Technical and Fundamental Analysis Cannot Compete with Major Trends: Whether through technical analysis or fundamental analysis, both seem insignificant compared to the overall trend of the market. Following the major trend is key to achieving long-term profitability.
7. Negative news at the top indicates a bottom; one should sell decisively: When the market is at a high point, negative news often signifies an impending reversal, making it an excellent signal to exit the market.
8. Negative news at the bottom often indicates a bottom; one must buy boldly: In market bottom regions, negative news usually reflects extreme market panic, making it the best buying opportunity.
9. A lifetime of wealth once is enough; be sure to safeguard the wealth you have acquired: Do not be greedy; understand when to take profits at the right time and firmly protect the money you have already earned. This is a key point for achieving long-term success.
10. Bitcoin must be allocated; otherwise, profits may not be realized during a bull market: Bitcoin, as the leader of the cryptocurrency market, often sees the most significant price increases during bull markets. Proper allocation of Bitcoin can help achieve stable profits in a bull market.
These valuable pieces of advice are the crystallization of years of practical experience, worthy of our careful consideration and strict adherence. I hope these suggestions can help everyone avoid detours in the market and steadily move toward success.
Today's highlight is a simple yet highly effective cryptocurrency trading strategy - the trend strategy.
I. What is a trend?
Trends are the direction of market movement, whether upward, downward, or sideways. Trends are the regular conclusions drawn from observing financial trading markets (such as stocks, futures, forex, cryptocurrency, etc.). Changes in buying and selling decisions shape different trend forms. Trends always move in the direction of the least market resistance; thus, finding trends means finding the path of least resistance. Financial trading masters generally advocate that traders follow trends.
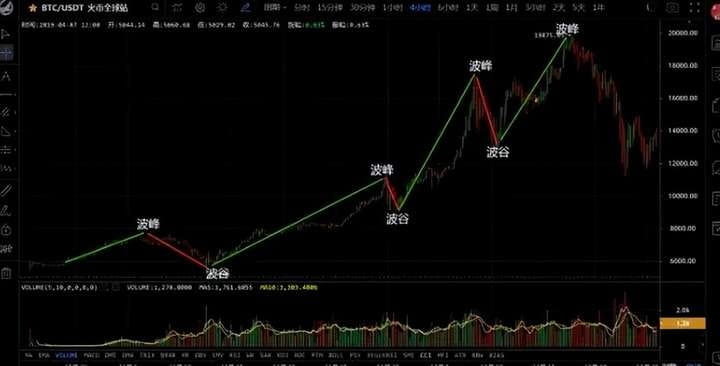
According to Dow Theory: Any trend will eventually reach its conclusion, meaning a bull market will inevitably be followed by a bear market, in a cyclical manner. Market prices do not rise straight in one direction; the trajectory of trend movements resembles waves that follow one after another, with clear peaks and troughs.
Peaks and troughs are the basic elements that constitute different trends. Based on the positions of peaks and troughs, trends can be divided into: upward trends, downward trends, and oscillating trends.
1. Upward Trend:
Judgment criteria: Both peaks and troughs are gradually rising.
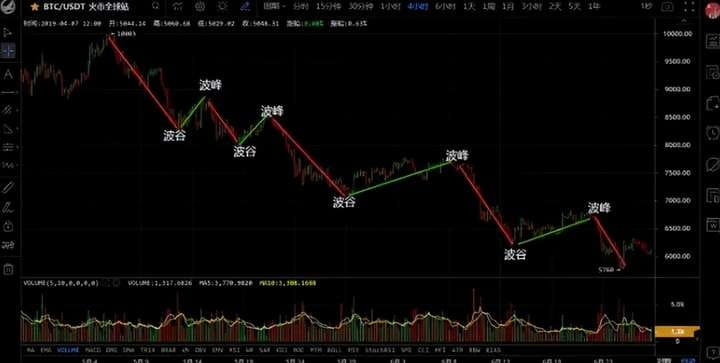
2. Downward Trend:
Judgment criteria: Both peaks and troughs are gradually declining.
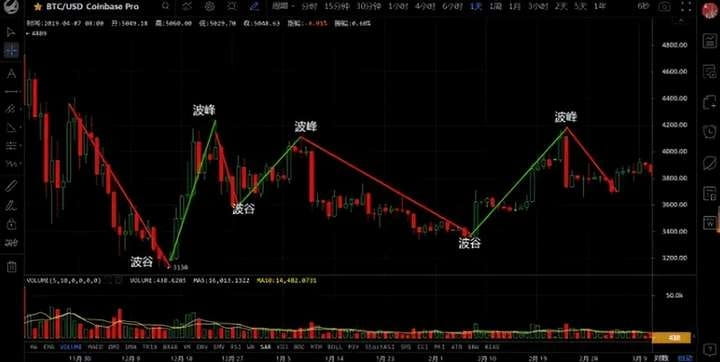
3. Oscillating Trends:
Judgment criteria: Peaks do not rise in a regular pattern, and troughs do not decline in a regular pattern. There is no clear pattern of rising or falling for peaks and troughs. In special forms, peaks and troughs can be on the same horizontal line.
II. Classification of Trends:
1. Depending on the different time cycles, trends are usually classified as short-term, medium-term, or long-term.
Trends lasting a few days are referred to as short-term trends, and short-term trading mainly refers to cycles.
Trends lasting from a few days to a few weeks are considered medium-term trends, and mid-line operations mainly refer to the cycle.
Trends lasting several months to years are considered long-term trends, and long-term trading mainly refers to cycles.
Multiple short-term trends compose a medium-term trend, and multiple medium-term trends compose a long-term trend. The bull and bear markets generally refer to long-term trends lasting several months to years.
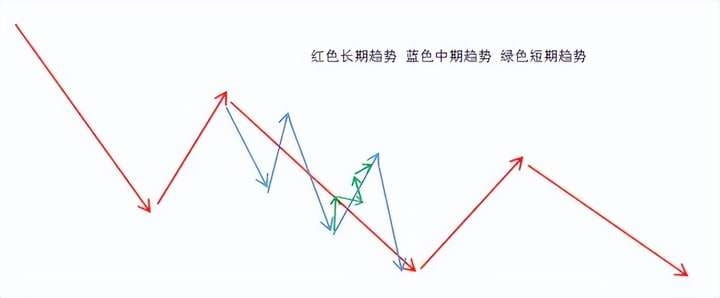
2. Types of Trends: Major trends, minor trends, and short-term trends (according to Dow Theory).
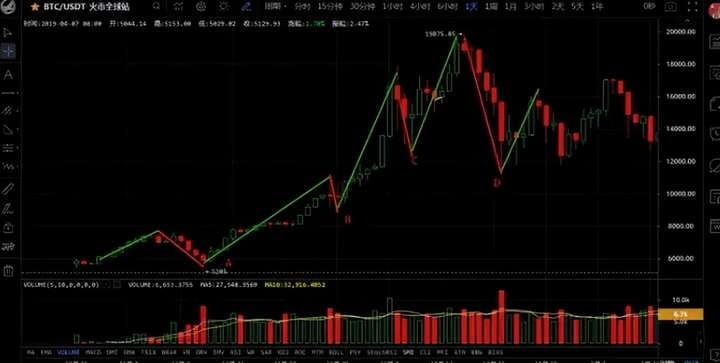
① Major trends: Represent the overall fundamental trend, indicating a comprehensive rise or fall in market prices, with the longest time span and significant price movements. Major trends typically take longer to form and involve more capital competition. As long as the next rise exceeds the previous high and the next drop is above the last low, the overall trend is upward, indicating a bull market. Conversely, if the overall trend is downward, it is referred to as a bear market. Trends shown in larger cycles, such as daily or weekly charts, are more reliable, as they are less likely to be manipulated by large players.
② Secondary trends: These exist within major trends and play a correcting role in the rise and fall of market prices, also known as corrective trends.
If the primary trend is a bull market, the secondary trend is the downward corrections during the upward process. Conversely, if the primary trend is a bear market, the secondary trend is the upward rebounds during the downward process. The adjustment amplitude of the secondary trend is generally between one-third to one-half of the primary trend.
③ Short-term trends: These are fluctuations within a day or smaller cycles and are components of the secondary trend. Short-term fluctuations are meaningless on their own, so using them to analyze larger trends can easily lead to erroneous conclusions. Short-lived trends have brief durations and are easily manipulated; trading them is not recommended for ordinary investors.
----------------------
Major trends are composed of minor trends, and minor trends often follow major trends. When a trend reverses, the sensitivity of minor trends is higher than that of major trends. In any market, these three types of trends must coexist. Each type of trend will eventually complete its course, meaning that a bull market will inevitably be accompanied by a bear market, in a cyclical manner.
Long-term traders are most concerned with major trends: daily, weekly, monthly, etc. Short-term investors focus on secondary and short-term trends.
Choose the type of trend that corresponds to your investor type.
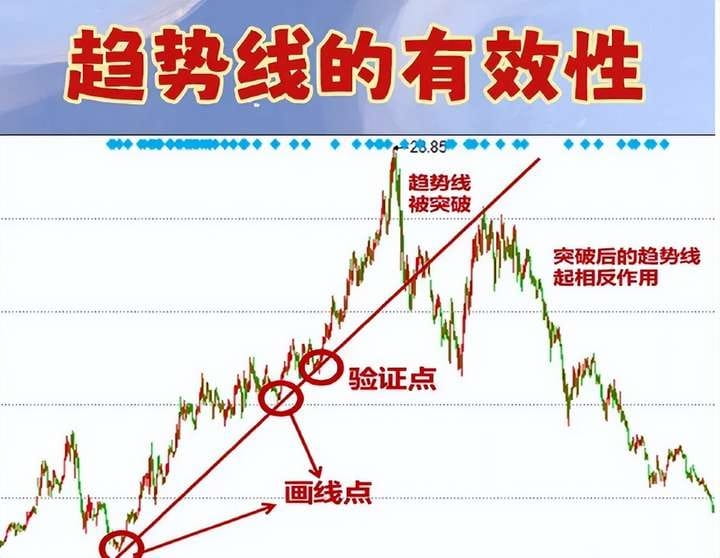
III. How to Draw Trend Lines:
Trend lines provide a more intuitive view of trend directions, used to predict future market changes and to judge support and resistance. The support or resistance functions of trend lines will eventually be broken, resulting in changes in price direction.
1. What is a trend line? 2. How to draw trend lines. 3. The functions and precautions of trend lines.
IV. Conditions for Trend Reversal End:
1. In the upward process, if the pullback low is below the previous low, the upward trend line ends. As shown, point D is below point C.
2. In a downward trend, when a rebound high exceeds the most recent downward starting point, the downward trend ends. As shown:
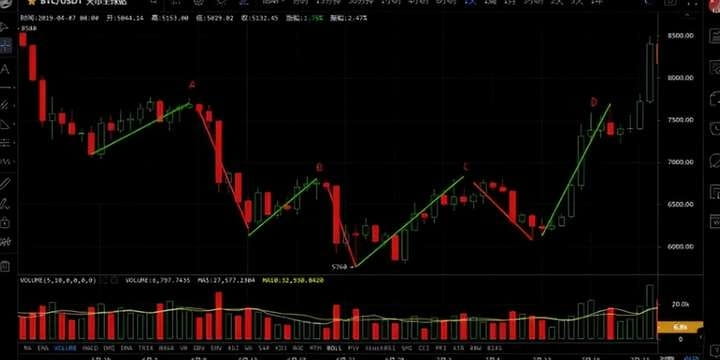
V. Judging Trends and Trading with the Trend:
Judging trends can be divided into major trends and minor trends. Major trends refer to whether it is a bear or bull market, while minor trends indicate whether prices are declining or rebounding in the short term. If the major trend has likely reached a significant bottom and is consolidating, and the short-term trend shows small-range oscillations, it is possible to buy at support.
For example, if BTC's bottom is gradually rising and is above all moving averages, with multiple indicators showing an upward trend.
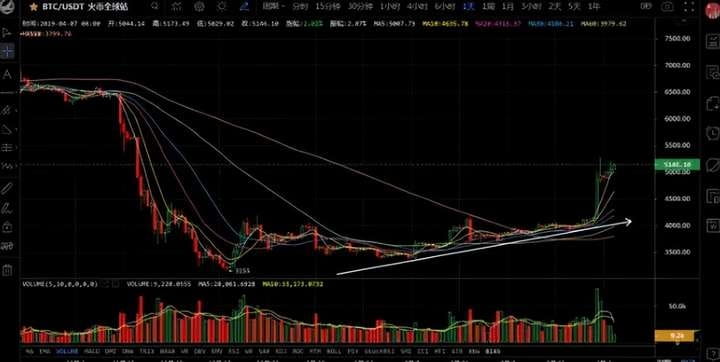
In addition to the above methods for analyzing and judging trends, various technical indicators such as candlesticks, volume, and moving averages should also be referenced.
Other trend indicators include: MA moving averages, BOLL indicators, MACD, and Fibonacci retracements.
These are the historical experiences left by the long evolution of financial markets, and they represent successful historical experiences. Behind them lie knowledge from mathematics and psychology. Technical analysis is not about guessing or divining the future, but rather a summary and speculation based on long-term statistics, observations, and verifications by investment masters regarding changes in trading markets.
How to draw a Bitcoin trend line
Drawing a Bitcoin trend line mainly includes the following steps:
1. Determine Trend Points
An upward trend line: requires identifying two consecutively lower highs to draw the upward trend line.
A downward trend line: requires identifying two consecutively higher lows to draw the downward trend line.
2. Connecting Points to Draw Lines
Use a straight line to connect the two selected points to form a trend line. Ensure that the line passes through as many points as possible while avoiding excessive deviation from the actual data.
3. Verify the Trend Line
After drawing the lines, observe whether the market behavior aligns with the indications of the trend line. An effective trend line should provide support or resistance in actual operations.
4. Correction and Adjustment
If market activity indicates that a trend line is invalid, it needs to be adjusted. It is usually recommended to use at least three clear points to determine the trend line for greater accuracy.
5. Analytical Significance
Trend lines are primarily used to assist in analyzing market trends and potential reversal points. A correct trend line can help traders judge price movements and develop trading strategies.
By following these steps, effective Bitcoin trend lines can be drawn, allowing for their use in technical analysis to predict market movements.
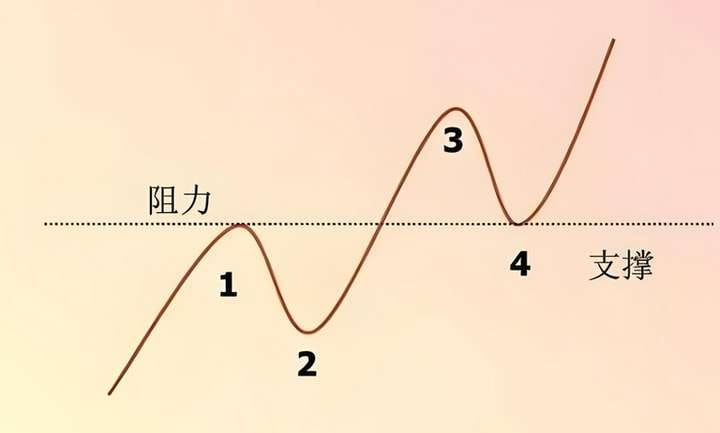
Everyone encounters support and resistance levels when first learning trading techniques.
The trading patterns at support and resistance levels are generally divided into two categories:
(1)Entry trading after the price tests support and resistance, making a rebound or reversal.
(2)Breakout trading, entering a position after prices break through support and resistance to continue the trend.
Therefore, accurately judging support and resistance levels is crucial for trading profitability and is one of the most fundamental skills.
Today, I will explain the eight most common and effective methods for judging support and resistance levels, which I believe will be helpful for everyone.
1. What are support and resistance levels?
(1)Support level: Refers to the point below the current price where the price retraces and meets support, marking a turning point from falling to rising.
Everyone, see the image below, which shows the reversal at support and resistance positions based on high and low points.
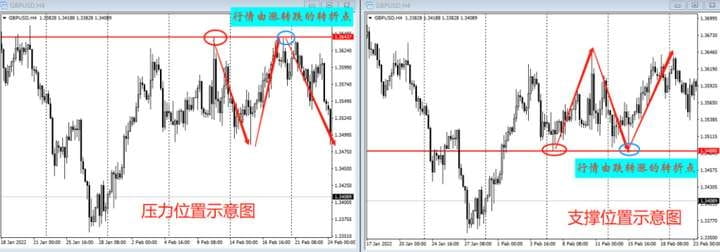
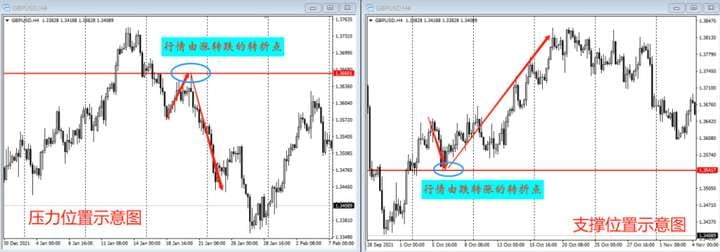
(2)Resistance level: Refers to the point above the current price where upward price movement meets resistance, marking a turning point from rising to falling.
Everyone, see the image below; this shows the reversal of pressure and support positions in the trend continuation's pullback.
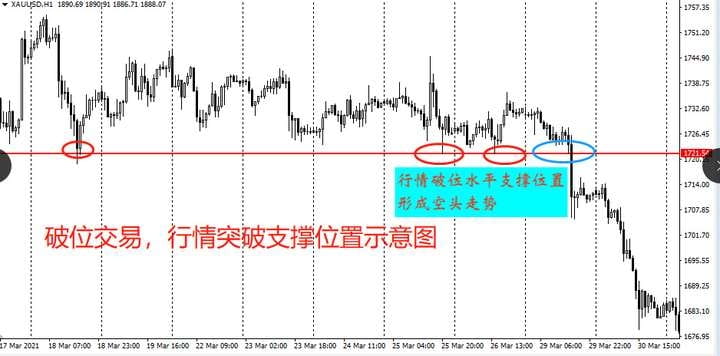
(3)Breakout points: In breakout trading, once the price breaks through support or resistance, it becomes a point for trend continuation.
Everyone, see the image below; this illustrates the market breaking through the support position, leading to trend continuation after the breakout.
2. Eight methods to judge support and resistance
Method 1: Using previous highs and lows as support and resistance levels
On the chart, the nearby highs and lows are the most common methods for judging support and resistance positions.
Everyone, please see the illustration below:
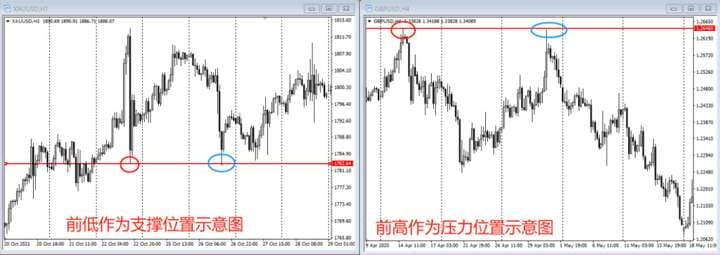
The left side of the chart shows the hourly candlestick chart of gold, where the price reversed upwards after testing the prior low level.
The right side is the 4-hour candlestick chart for GBP/USD, where the market tests previous high resistance and then reverses downwards.
Points of Note:
(1)Select clear previous highs and lows.
(2)You can use previous highs and lows from larger time frames for trading, but do not use smaller time frames. For example, when trading a 1-hour trend, use the previous highs and lows from a 4-hour chart as support and resistance, but do not use 15-minute or 5-minute highs and lows.
(3)Selecting previous highs and lows as support and resistance requires some subjective judgment from traders. It is best to make this judgment when the market is halted or positions are not held, as traders are more calm and objective, making the identified support and resistance more effective. Once determined, do not change it arbitrarily.
Method 2: Key prices (support and resistance at integer price levels and historically significant prices)
(1)Integer prices in product quotations usually have support and resistance effects.
For example, U.S. crude oil at $100 per barrel, or the frequently mentioned Shanghai Composite Index at the integer level of 3000 points.
Everyone, please see the illustration:
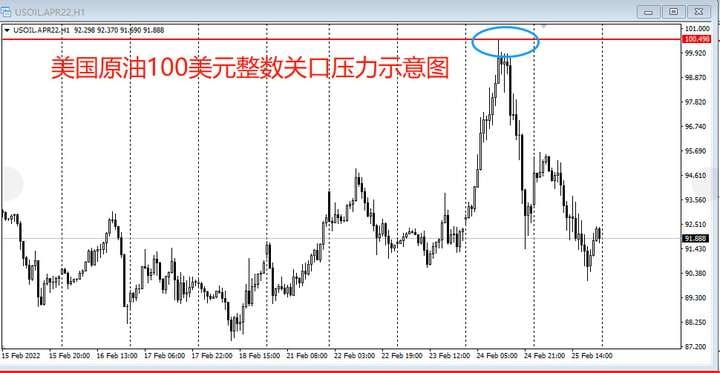
The chart displays last week's hourly candlestick chart of U.S. crude oil, where the price peaked at 100.49, briefly breaking the integer level of 100 dollars before correcting and reversing downwards.
(2)Historically significant prices.
In a particular asset's price movement, significant and important prices have support and resistance effects.
Everyone, please see the illustration below:
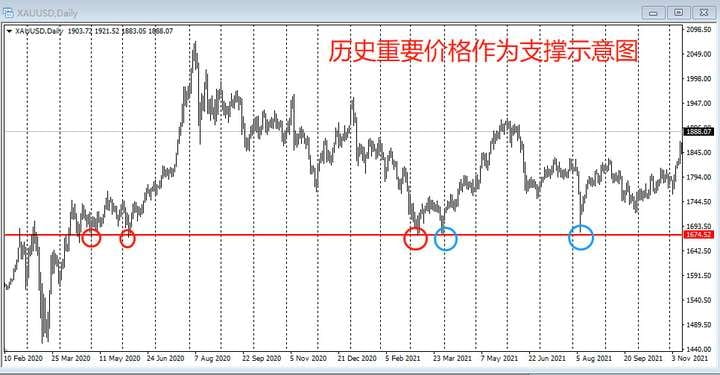
The chart shows a daily chart of gold, which, influenced by the pandemic, rose to a historical high of 2074 and then deeply retraced to a low of 1676, with the market finding support several times at 1676.
Points of Note:
(1)Not all integers serve as support or resistance; only significant integers can be used.
(2)Trading opportunities at integer levels and historically significant prices are not frequent; when they do occur, the success rate is relatively high.
Method 3: Using moving averages as criteria for judging support and resistance
Moving averages are the most commonly used technical indicators for determining support and resistance, and this is one of their most common applications.
When the moving average is below the price, it acts as support.
When the moving average is above the price, it acts as resistance.
Everyone, see the image below:
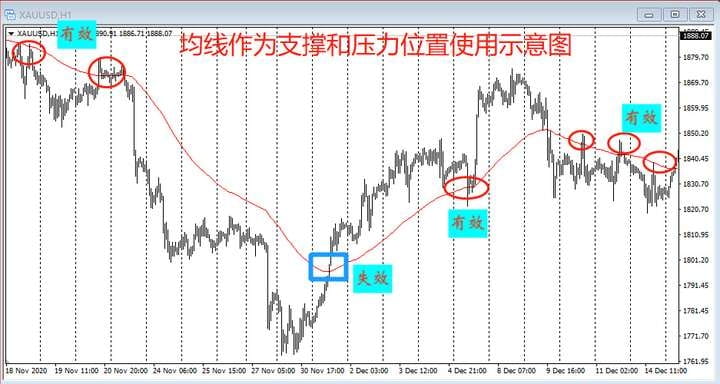
The chart shows an hourly candlestick of gold, with the EMA90 moving average used as an illustration of support and resistance levels.
Points of Note:
(1)Once you select certain parameters of a moving average as the standard for support and resistance, do not frequently switch them.
(2)The moving average serves as a standard for judging support and resistance, having a significant advantage: the moving average is automatically generated on the chart, clearly and objectively, without requiring subjective judgment from traders.
(3)Do not use moving averages with too small parameters for support and resistance, as small parameter moving averages are too close to the market and can change too quickly, leading to high trading frequency that is detrimental to execution. At least use moving averages with parameters above 30.
Method 4: Trend Lines, Channel Lines
Trend lines and channel lines belong to the same category of trend judgment indicators.
(1)Once a trend line is established, it has support or resistance effects until it is broken in the opposite direction. An upward trend line provides support, while a downward trend line exerts resistance.
(2)The upper and lower channels of the channel line have support and resistance effects; after the price tests them, there is a possibility of reversal, which can serve as a basis for opening and adjusting positions.
Everyone, please see the illustration:
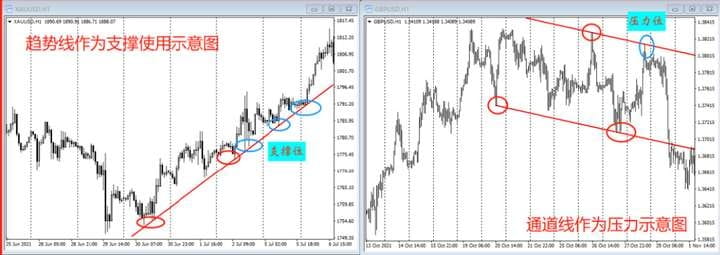
The left side of the chart shows an upward trend in gold at the hourly level; after the trend line is formed, the market stabilizes upwards after several tests.
The right side of the chart shows the hourly candlestick chart for GBP/USD, where the market experiences downward reversal pressure from the upper edge of the descending channel.
Points of Note:
(1)When drawing trend lines and channel lines on the chart, traders need to make some subjective judgments. In practice, it is best to draw lines when the market is halted and positions are not held. After drawing, wait for the market to retrace; avoid making arbitrary adjustments.
(2)Draw lines and trade only at this level; do not use cross-level trading.
Method 5: Fibonacci Lines
Fibonacci lines have two uses for support and resistance.
(1)Fibonacci retracement lines.
After the price establishes a direction, it typically retraces to support or resistance before continuing, with Fibonacci levels of 38.2%, 50%, and 61.8% being the most common retracement levels.
(2)Fibonacci extension lines.
After drawing Fibonacci levels at the high and low points of a trend, the Fibonacci indicator will automatically calculate extensions at 1.618 times, 2.618 times, and 4.236 times, which will also act as support and resistance.
Everyone, see the illustration:
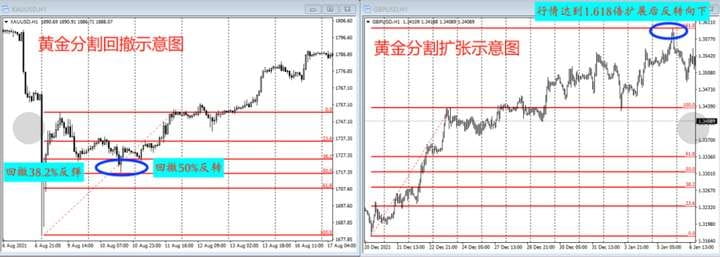
The left side of the chart shows an illustration of the Fibonacci retracement. After the price establishes an upward trend, it first retraces to 38.2%, briefly rebounds, then retraces again to 50%, forming a reversal candlestick, and the price moves upwards.
The right side of the chart shows the Fibonacci extension illustration; after a bullish wave is established, following a brief horizontal consolidation, the trend continues to rise. When the Fibonacci extension reaches 1.618 times, the market reverses downwards.
Points of Note:
(1)Fibonacci extension levels are often used as profit-taking targets.
(2)Drawing Fibonacci retracement lines is done from the starting point of the trend to the endpoint; drawing Fibonacci extension lines is done from the endpoint back to the starting point.
Method 6: Gaps
Gaps usually occur due to significant price changes during market halts or openings, or due to rapid market movements without quotes, resulting in price gaps between candles. After gaps form, the market often retraces towards the gap.
(1)After an upward gap forms, when the market retraces downwards, it serves as a support level.
(2)After a downward gap forms, when the market retraces upwards, it exerts pressure.
Everyone, please see the illustration below:
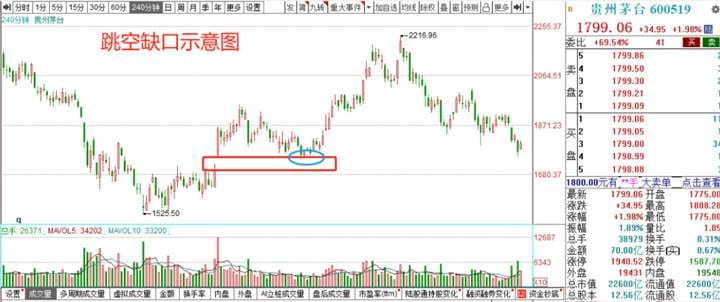
The chart shows the 4-hour candlestick chart of Kweichow Moutai, where the market jumped and rose high, then gradually oscillated and retraced until stabilizing at the gap before surging again.
Points of Note:
(1)In products with intraday halts and trading rules, the frequency of gaps is higher, such as futures, stocks, and stock index futures.
(2)The effectiveness of gaps formed by breakouts at tops or bottoms is generally better.
Method 7: Breakout of the upper and lower edges of consolidation patterns and neckline
(1)Before a consolidation pattern forms a breakout, the upper and lower edges of the pattern have support and resistance effects.
(2)After the neckline of a consolidation pattern breaks, there is a possibility of trend continuation, representing a breakout trading opportunity.
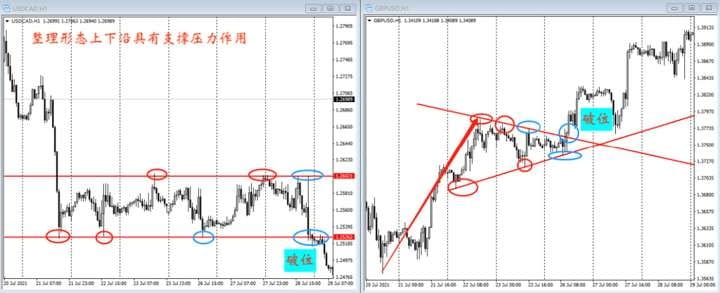
The left side of the chart shows the upper and lower edges of a rectangular consolidation; after the market tests them, reversal trends form. The last test below may lead to a downward breakout, allowing for short positions and continuation of the bearish trend.
The right side of the chart shows a triangular consolidation pattern, with the price testing both the descending and ascending trend lines of the triangle, forming reversal trends. Eventually, the price breaks out upwards, allowing for long positions and continuation of the bullish trend.
Points of Note:
(1)If the consolidation pattern has a small amplitude, with limited profit potential, only trend-following trades can be selected, as shown in the triangular consolidation on the right side of the chart, where long positions are taken only at the bottom of the consolidation, awaiting an upward breakout.
(2)The longer the consolidation time period, the greater the probability of a breakout; thus, positions should be increased when trading with the trend.
Method 8: The Concept of Support and Resistance Bands
In practice, the market often consolidates around support or resistance points, even forming false breakouts of support and resistance, causing many orders to hit stop-losses due to false breakouts.
Therefore, understanding support and resistance as an area increases the stability of finding trading opportunities within that area.
There are two scenarios for using support and resistance bands:
(1)Near support and resistance, select one or two nearby highs and lows as support or resistance bands for trading. Everyone, please see the illustration below.
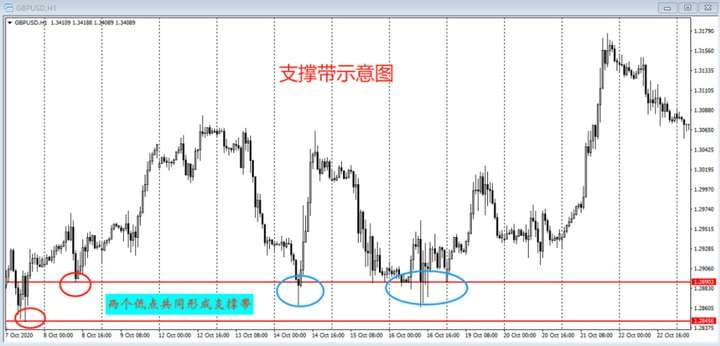
After the price tests support, select two nearby prior lows to form a support band, stabilizing within the band, and after forming a reversal structure, one can enter trades.
(2)Different indicators for judging support and resistance point to nearby price areas, which can function as support or resistance bands for trading. Everyone, see the illustration below.
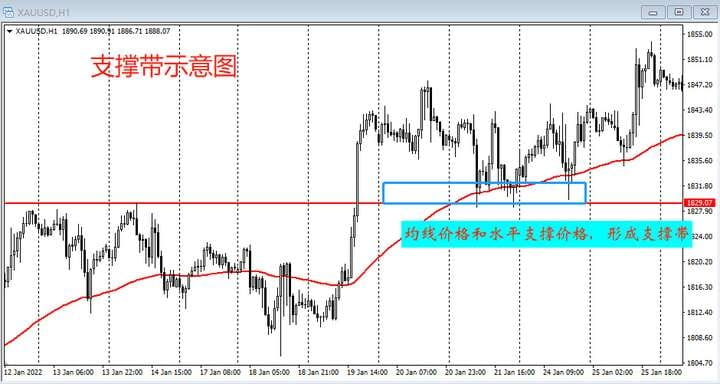
The horizontal support line and moving averages in the chart form a support band, where the market stabilizes within the band and forms a reversal structure, allowing entry for long positions.
Points of Note:
When trading in areas around support and resistance bands, it is common to combine entry patterns, making it easier to set stop losses and manage funds.
3. Notes on Support and Resistance
1: Resonance Usage
(1)Using different methods to judge support and resistance levels in resonance, such as the resonance between trend lines and moving averages, or between trend lines and horizontal lines, etc.
(2)Combining support and resistance locations with entry patterns, or using other indicators for resonance. For example, entering a position when a breaking structure forms at a support or resistance level, or resonating with MACD or RSI indicators that signal overbought or oversold conditions.
Note: Resonance of 2-3 types of indicators is the most common and effective form of resonance trading.
2: Support and resistance that have been tested multiple times have the best effectiveness.
Moreover, once a reverse breakout occurs, the operational space also becomes larger.
3: The essence of trading is trial and error; the effectiveness of all support and resistance levels is probabilistic.
When utilizing support and resistance levels to form a trading system in practice, it is essential to adhere strictly to stop losses and manage positions well.
The above is a compilation of eight methods for judging support and resistance levels. Everyone should choose 2-3 to use; make sure to backtest and practice before real trading.
The above is some of Yan An's views and insights. If you find it helpful, please like and save it. I am Qing Tian, someone who has experienced three bull and bear cycles and is skilled in logical coin selection and technical timing. I only trade within my knowledge scope, with each direction confirmed by the market!
Even the most diligent fisherman would not go out fishing during stormy weather; instead, they would carefully guard their boat. This season will eventually pass, and sunny days will come! Follow Yan An, and I will teach you both fishing and how to fish. The doors to the cryptocurrency world are always open; by following the trend, you can have a life in harmony with it. Save this and keep it in mind!
