Over these years in the crypto world, I have seen too many people rush in with dreams of 'getting rich overnight,' only to end up losing everything in various flashy operations. I was once among them—high-frequency trading, altcoin ambushes, following so-called 'masters' in chasing highs and cutting losses; the more I tried to rely on 'cleverness' to make quick money, the faster I lost.
It was only later that I completely changed my mindset and relied on a set of 'simple methods' to gradually generate profits.
For new cryptocurrency traders to become seasoned ones, you only need to master these ten golden rules!
For friends who have not earned 1 million after years of cryptocurrency trading, listen to my words: if you follow these ten pieces of advice and still see no effect, come find me!
1. With limited funds, one must be frugal. Throughout the year, capturing one major upward opportunity is enough. Don’t always operate with a full warehouse; keep some cash on hand just in case.
2. Cognition determines how much money you can earn. If you don’t understand, you won’t earn. Practicing with simulation trading is fine, but trading with real money can be very stressful.
3. When good news comes, if you haven’t sold on the same day, you must quickly withdraw on the next day when it opens high. Once good news is released, everyone thinks about selling, and the price will naturally drop.
4. As the holidays approach, reduce positions a week in advance, or simply do not sell. The market is inactive during holidays, and prices are prone to large fluctuations.
5. For medium to long-term trades, it's important to have cash on hand. When prices rise, sell a bit; when prices fall, buy a bit. This way, you can lower costs and adjust strategies at any time.
6. For short-term trading, find those currencies with active trading. If there’s no buying or selling for a currency, you may easily get stuck once you buy.
7. Remember this rule: those that decline slowly usually rebound slowly; those that drop sharply typically rebound quickly.
8. Stop-loss is crucial; if you make the wrong buy, you must admit it and quickly stop the loss. Don’t think about waiting for the price to come back; preserving capital is the key.
9. For short-term trading, look at the 15-minute K-line chart, and use the KDJ indicator to find entry and exit points. Especially when KDJ indicates overbought or oversold, the signals are particularly accurate. Also consider MACD, RSI, and other indicators.
In the trading market, what truly influences trades is the investors' interpretation of K-charts. K-lines are the core content of technical analysis, and all technical indicators and methods revolve around K-lines.
Whether a skilled trader or a forex novice, most technical traders study K-lines to understand the hidden information behind them, such as trend strength, buying and selling dynamics, and potential future trend directions, to make trades.
Although many secrets are concealed in K-lines, not everyone can understand them. Especially some novice friends, who only see length and color in K-lines without knowing the underlying information, find trading quite difficult.
Today, let’s take a look at how a veteran trader with many years in the futures market interprets K-lines, hoping it will help with your trading!
01 K-line language
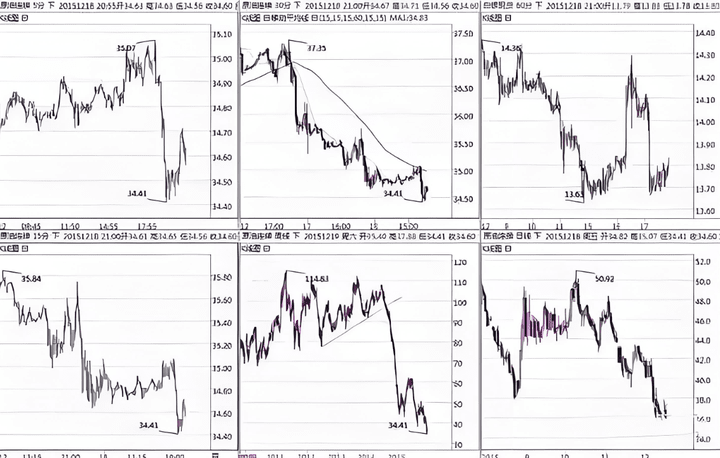
The K-line is the basic unit that forms the chart, it is the most direct expression of trend changes. The Easy Image Theory divides the changes in K-lines into three types—alternation between simple and complex, alternation between large and small, and alternation between negative and positive.
Through these three alternating patterns, we can predict the next market change under specific conditions.
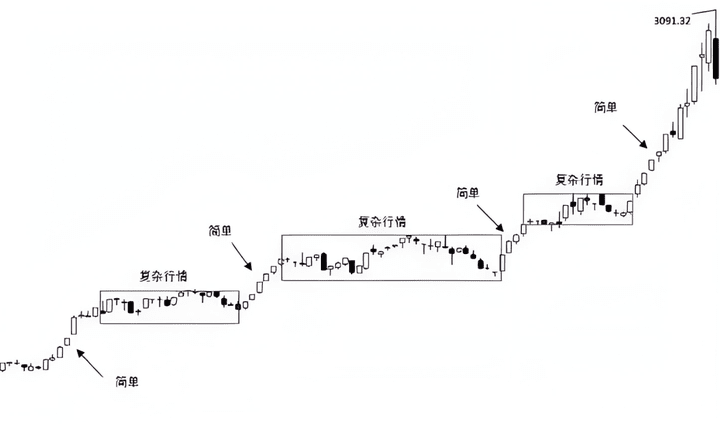
1 Simple vs. Complex alternation
Simple and complex reflect the alternating process of K-line movement patterns. We control trading rhythm through simple and complex alternation.
Simple market: clear trends.
During an upward process, the number of positive lines is significantly greater than that of negative lines, and the amplitude of positive lines is generally larger than that of negative lines, closing as a positive line or the next K-line does not break the lowest point of the previous K-line; conversely during a downward process.
Complex market: unclear trends.
The number and amplitude of positive and negative K-lines are generally balanced, with K-lines fluctuating within a limited area.
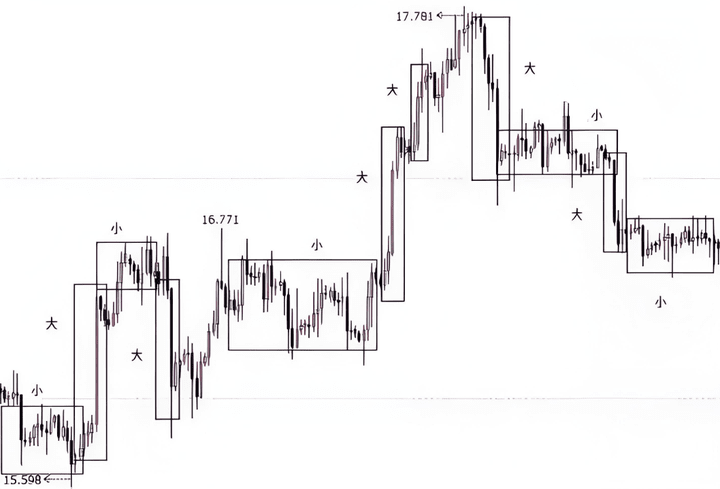
2 Alternation between large and small
Large and small reflect the alternating process of K-line amplitudes. We look for entry opportunities in the alternation of sizes and control greed and fear.
Large: One or several consecutive K-lines have amplitudes larger than those of surrounding other K-lines, indicating that one side's strength is increasing in a certain time area.
Shallow: One or several consecutive K-lines have amplitudes smaller than a surrounding K-line or multiple K-lines, indicating a weakening of one side's strength or equilibrium in a certain time area.
Rules of size alternation: 1. Size alternation; 2. Large (positive & negative) — large (positive & negative) alternation; 3. Small (positive & negative) — small (positive & negative) alternation.
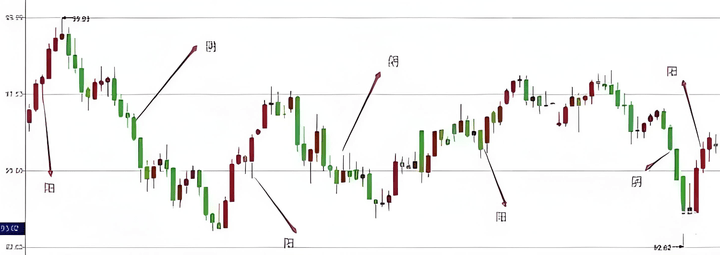
3 Negative and positive alternation
The alternation of negative and positive indicates a change in market direction. When negative and positive alternation occurs, it means that the market's rise and fall movement may reach a turning point, providing opportunities for buying and selling.
Only K-line negative and positive transformations occurring near structural levels may have significance for trend changes.
02 Structure language
Dow Theory initially discussed the structure of the market atmosphere with three rises and three falls, while Wave Theory subsequently subdivided the market structure. Currently, the most precise theory regarding structure is Wave Theory.
However, Wave Theory faces some issues in practical applications. Before the trend ends, everyone's interpretation of the five waves may differ. Depending on different principles, wave types can be classified into different standards.
Easy Image Theory simplifies waves without discussing how to divide waves, focusing instead on the primary and secondary relationships of adjacent segment structures to judge changes in market movement direction.
1 Segment
A segment is the most basic component of a structure, composed of multiple K-lines. The lines connecting the highest point (or lowest point) to the lowest point (or highest point) form a segment.
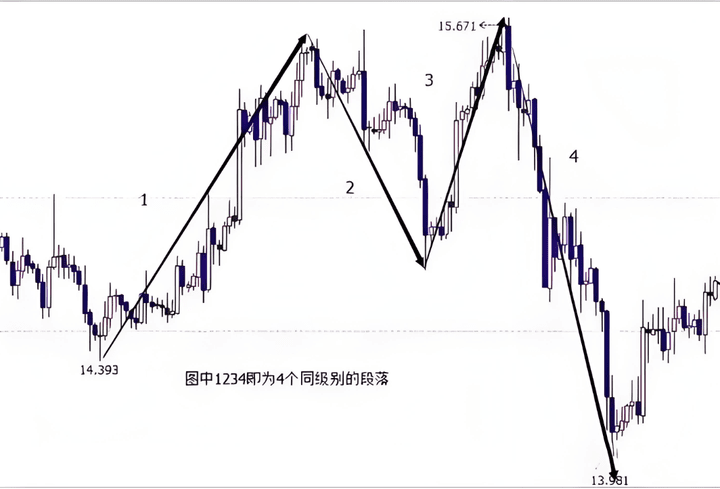
2 Primary and secondary structure
Comparing two adjacent segments, the longer one is the primary trend segment, while the shorter one is the secondary trend segment. Following a secondary trend segment, a primary trend segment is expected to appear, and vice versa.
The alternating appearance of primary and secondary segments reflects the overall movement direction of the market.
Moving towards the primary trend direction until the starting point of the primary trend segment is broken, causing a change in the relationship between adjacent segments, which indicates that the market may turn.
Specific description is as follows:
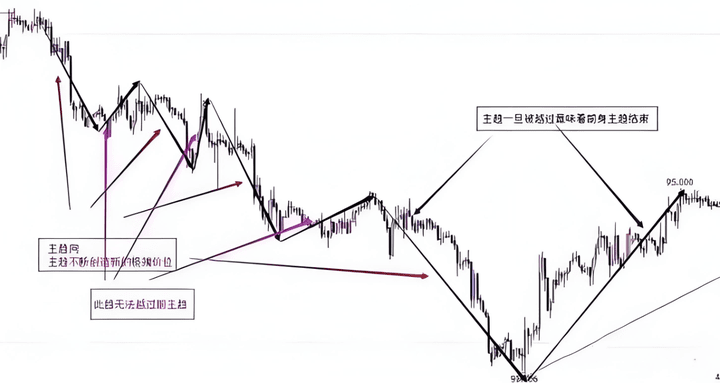
1. Primary trend segments
Continuously operating below or above the medium and long moving averages;
Backtesting does not achieve substantial breakthroughs on upper-level structures or fundamentally disrupt technical patterns.
Strong directional movement, constantly creating new extreme prices.
Provide genuine certainty to technical displays.
2. Secondary trend segment: it is a retracement of the primary trend segment, unable to break through the limit price of the primary trend segment.
03 Ratio language
Proportion is a balance point and burst point that is easily achieved through the comparison and conflict of forces in nature. Ratio positions can serve as equilibrium points for mutual forces or as breakout points for unilateral forces.
It is essential to distinguish between primary trend ratios and primary-secondary ratios:
The proportion between primary trends: less than, equal to, greater than.
Proportion between primary and secondary: golden ratio, deep and shallow.
The end point of the primary trend segment can be confirmed by the disappearance of inertia, while the end point of the secondary trend requires confirmation by the golden ratio, which can be divided into deep retracement and shallow retracement.
1
Golden ratio
The golden ratio, also known as the golden law, refers to the mathematical proportional relationship between various divisions of a physical object, which divides the whole into two parts, where the larger part to the smaller part is equal to the whole to the larger part.
The golden ratio is 1:0.618 or 1.618:1, meaning the long segment is 0.618 of the whole segment. 0.618 is recognized as the most aesthetically significant ratio.
The above ratios are the most likely to evoke a sense of beauty in people, hence referred to as the golden ratio.

When the primary trend segment is confirmed and the secondary trend segment begins, the end point of the secondary trend segment is often at the golden ratio level of the primary trend segment.
The end point of the next or multiple primary trend segments is often at the golden ratio extension of the current primary trend segment:
Golden ratio retracement levels: 23.6% 38.2% 50% 61.8% 76.4%
Golden ratio extension levels: 161.8% 261.8% 423.6%
If the golden ratio is effective (expected support and resistance levels are valid), the following may appear at the golden ratio level: 1. Transformation between positive and negative; 2. Alternation between large and small (retracements alternating between deep and shallow; when the first segment is long, the second segment adjusts shallowly).
2
Deep and shallow
The retracement ratios of secondary trend segments often exhibit deep and shallow retracements or deep retracements.
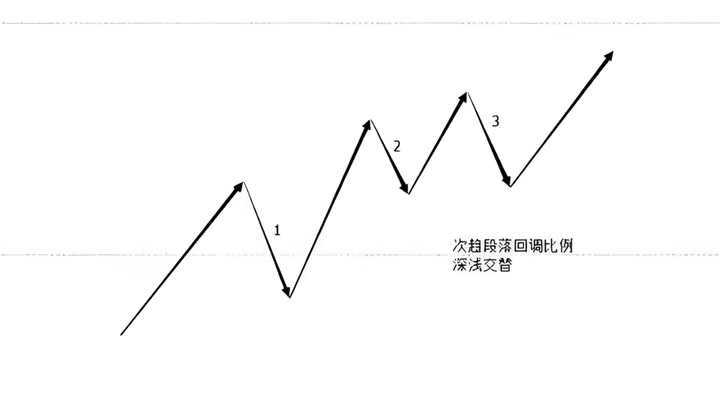
When using the golden ratio: shallow retracements generally occur around 38.2%, while deep retracements occur around 61.8%. In a strong trend, retracements may shrink to around 23.6%.
When using a moving average group for judgment: shallow retracement ends between the medium-term moving average band of 14 and 27, while deep retracement ends between the long-term moving average band of 52 and 60.
04 Cycle language
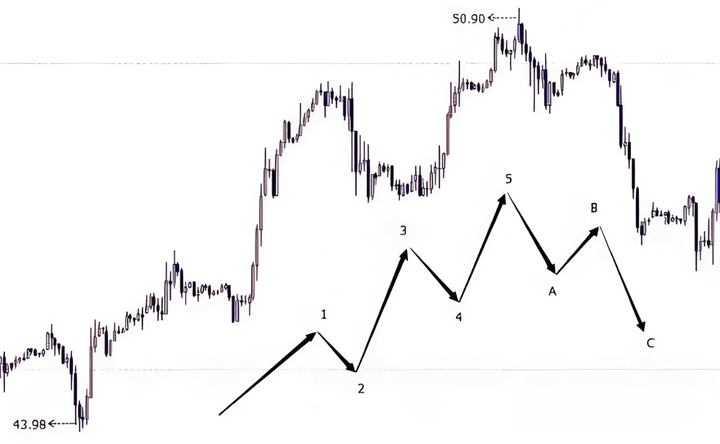
A complete cycle consists of one main trend and multiple secondary trends. The main trend can be divided into primary and secondary segments totaling 12345 segments, while the secondary trend can be divided into main and secondary segments ABC.
Dividing the main and secondary switching cycles from the monthly chart (weekly chart, daily chart, hourly chart, minute chart, etc.) results in a complete structure of the market.
Different time period charts:
In trading, do not act on the first alternating primary and secondary trend; use the first primary and secondary as a basis, combined with segments and ratios to determine the primary trends and subsequent secondary trends for the third and fifth segments (three opportunities).
05 Indicator language
Technical indicators are mathematical models based on information from the market, and investors often first encounter these indicators when entering the market.
However, many novices find that regardless of the indicator used, they ultimately incur losses. The main reason for this issue is the lack of understanding of the mathematical models of the indicators themselves and their corresponding principles.
An indicator generally only responds to a few specific market patterns; when the factors dominating market movement change, the indicator easily becomes ineffective.
Indicators can be simply classified into two categories: trend indicators and oscillation indicators.
Trend indicators can only accurately indicate the direction of prices in simple markets.
Oscillation indicators: only accurately indicate the price direction in complex markets.
The Easy Image Theory only uses the most primitive trend indicator moving average to analyze the market and capture the beginning of simple markets without detailing complex markets.
1 Trend indicators
Trend indicators work well in simple markets but become blunt in complex markets. The moving averages used in Easy Image Theory have two applications:
1. A single moving average
In cycles above the medium-term (4-hour chart), a short-term moving average (7-period moving average) can be used to define the current market situation:
① In a simple market: observe the direction of the short-term moving average and the positional relationship between the K-line closing price and the moving average.
When the short-term moving average is upward, and the K-line closes as a positive line with the closing price above the short-term moving average, the market outlook is bullish.
When the short-term moving average is down, and the K-line closes as a negative line with the closing price below the short-term moving average, the market outlook is bearish.
As shown in the figure:
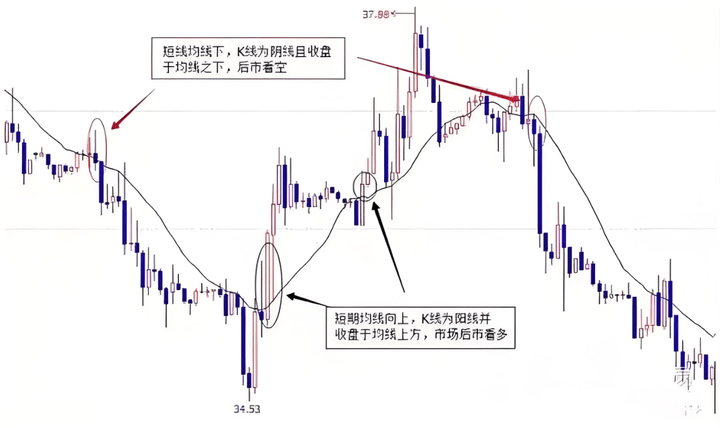
②: Complex market: Crosses back and forth along the moving average.
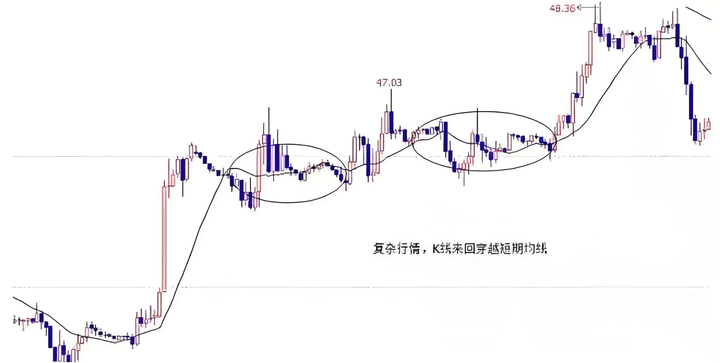
2 Moving average group
Using a moving average group to define simple and complex markets can be applied across any cycle, especially in smaller cycles (within 1H), where the stability of the moving average group can filter out many false signals.
The moving average group in Easy Image trading consists of 5 moving averages:
Short-term moving average: The 7-period moving average is the short-term moving average, mainly used for profit-taking;
Medium-term moving average: The medium-term moving average band is composed of the 14-period and 27-period moving averages. We refer to the market's retracement between the 14-period and 27-period moving averages as a shallow retracement, also known as the 1427 phenomenon.
Long-term moving average: The long-term moving average band is composed of the 52-period and 60-period moving averages. We refer to the market's retracement between the 52-period and 60-period moving averages as a floating retracement, also known as the 5260 phenomenon.
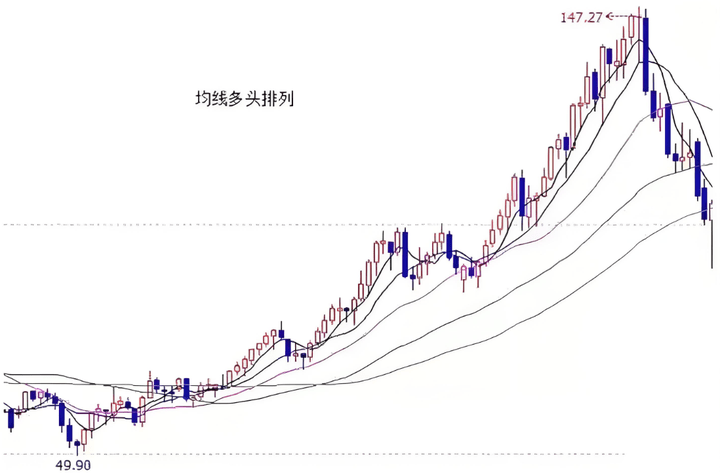
By analyzing the arrangement and direction of moving averages, we can determine whether the current market is simple or complex:
1) Ordered arrangement of moving averages:
Moving averages gradually transition from entangled to orderly arrangement, marking the beginning of a simple market.
① The moving average group is in a bullish arrangement.
② Moving averages in a bearish arrangement.
2) Disordered arrangement of moving averages:
The directions of various moving averages contradict each other, gradually becoming entangled from the short-term moving average, marking the beginning of a complex market.
The long-term moving average is upward, and the short-term moving average is downward, generally indicating a process of transition from bullish to bearish, and vice versa.
2 Oscillation indicators
Common usage of oscillation indicators:
In a bullish market, look for bullish crossovers at low points; in a bearish market, look for bearish crossovers at high points.
Pay attention to indicator divergence, that is, when prices create new highs or lows while the indicators do not; this indicates that the market may be turning.
06 Channel language
A trend line is a graphical analysis method that connects low or high points by drawing lines, using previously occurred instances to estimate the general direction for the next day.
By correctly drawing trend lines, people can roughly understand the future development direction of market prices. Depending on the duration of the fluctuations, there are three types of trend lines:
Short-term trend line (connecting short-term fluctuation points), medium-term trend line (connecting medium-term fluctuation points), long-term trend line (connecting long-term fluctuation points).
1
Drawing trend lines
Drawing method for support and resistance lines:
Support line: Connecting two or more relative low points results in a support line.
Support line
Resistance line: Connecting two or more relative high points results in a resistance line.
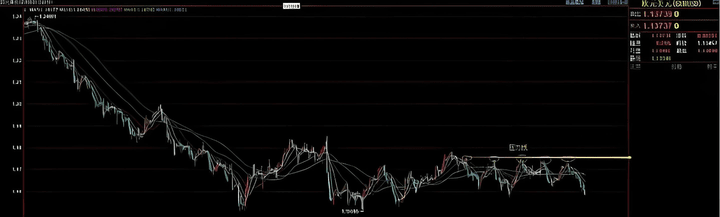
Resistance line
Usage of support and resistance lines:
1. The role of support and resistance lines
The support line is also known as the resistance line.
When the exchange rate drops to a certain price level, it may stop falling or even rebound. The price that prevents or temporarily halts further declines is where the support line is located.
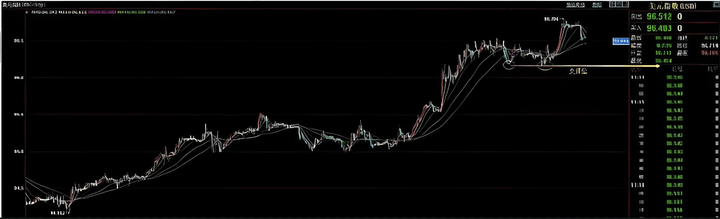
The resistance line is also known as the obstacle line.
When the exchange rate rises to a certain price level, it may stop rising or even fall back. The price at which it prevents or temporarily halts further rises is where the resistance line is located.
The role of support and resistance lines is to prevent or temporarily halt price movement in one direction. At the same time, support and resistance lines also have the potential to completely prevent price movement in the original direction.
2. Support and resistance lines transform into each other.
If a support line is broken, that support line will become a resistance line;
Similarly, when a resistance line is broken, that resistance line will become a support line.
This indicates that the positions of support and resistance lines are not fixed but can change, provided they are broken by sufficiently strong price movements.
3. Confirmation and validation of support and resistance lines
Generally, the importance of a support line or resistance line's influence is considered in three aspects:
The duration of price stay in this area;
The size of trading volume accompanying the price in this area;
The distance in time from when this support or resistance area occurs to the current period.
Drawing method for trend lines:
In an upward trend, connecting two low points results in an upward trend line.
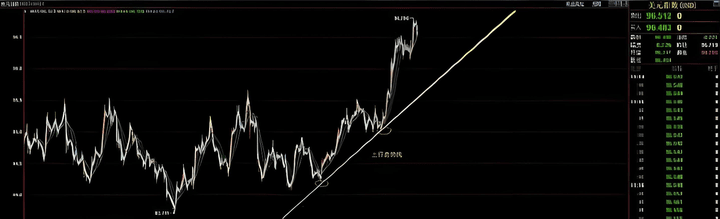
Upward trend line
In a downward trend, connecting two high points results in a downward trend line.
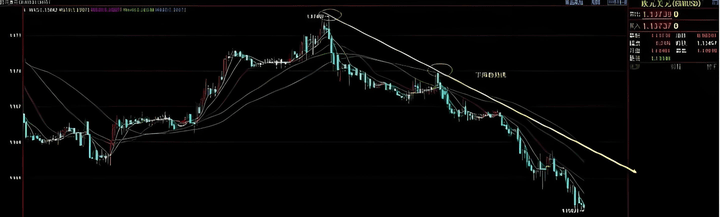
Downward trend line
Usage of trend lines:
Trend lines measure the direction of price fluctuations, and the direction of the trend line clearly indicates the price trend.
To obtain a truly effective trend line, it must be confirmed through multiple validations.
There must indeed be a trend present.
After drawing a line, it is necessary to obtain verification from a third point to confirm the validity of the trend line.
Drawing method for channel lines:
Channel lines are also known as channel lines or pipe lines, based on trend lines.
After obtaining the trend line, a parallel line can be drawn based on the first peak and trough, which is the channel line.
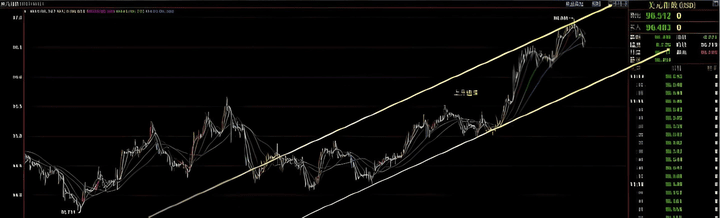
Upward channel
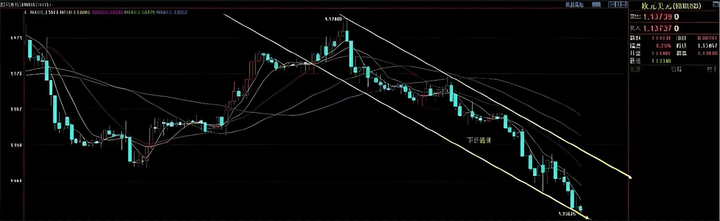
Downward channel
Usage of channel lines:
Two parallel lines form a channel, commonly referred to as ascending and descending channels.
The role of the channel is to limit the range of price fluctuations. Breaking through the upper or lower line indicates a significant change. Unlike breaking through a trend line, breaking through a channel line does not signify the beginning of a trend reversal, but rather the beginning of trend acceleration.
Another function of the channel line is to raise an alert for potential trend changes.
Finally, when drawing these lines, it's crucial to pay attention to the choice of cycle. According to theory and experience, the larger the cycle, the more significant the effect of the line drawn, resulting in a higher success rate in trading. It is recommended to look at the H1 cycle for intraday trading, and H4 and daily charts for medium to long-term trading.
2 Typical forms of trend lines
Trend lines can be classified as platform, contraction, or expansion types. Specific examples are as follows:
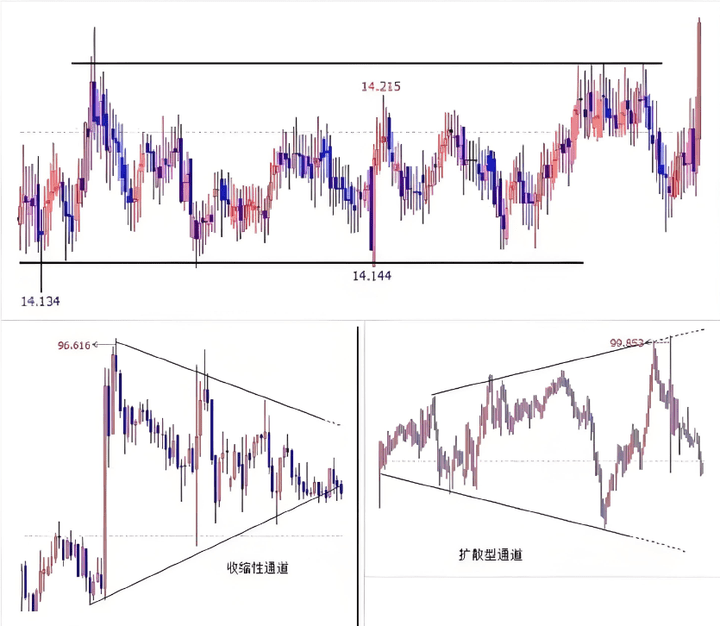
Ultimately, methods vary from person to person; this method may suit you or may not. You need to verify these yourself.
The above are trading insights accumulated over 10 years in cryptocurrency trading, experiencing many ups and downs. These are heartfelt words of deep understanding, hoping to be useful to everyone. Produced by Yan'an, quality is guaranteed. In the crypto world, there are beauties, unique and independent. With a soulful approach, one masters the currency!
No matter how diligent a fisherman is, he won’t go fishing in stormy weather, but rather carefully safeguard his boat. This season will pass, and sunny days will come! Focus on sunny days, and you will be equipped with both fish and fishing skills. The door of the crypto world is always open; only by going with the flow can one have a life of ease. Remember this and keep it in your heart!