\u003cc-59/\u003e
The price of Shiba Inu (SHIB) is making a comeback after recording a 15% increase in the past week. With a new bullish crossover signal on the daily chart and reserves on exchanges dropping to a one-year low, SHIB's current structure closely reflects the conditions that led to the last major breakout.
SHIB reserves on exchanges hit a 12-month low.
According to data from CryptoQuant, the on-chain SHIB reserves on exchanges have fallen to 83,803,217,156,857 tokens — the lowest level in over a year. Based on SHIB's current price of $0.00001397, the total value of the SHIB held on exchanges (83.8 trillion tokens) is approximately $1.14 billion.
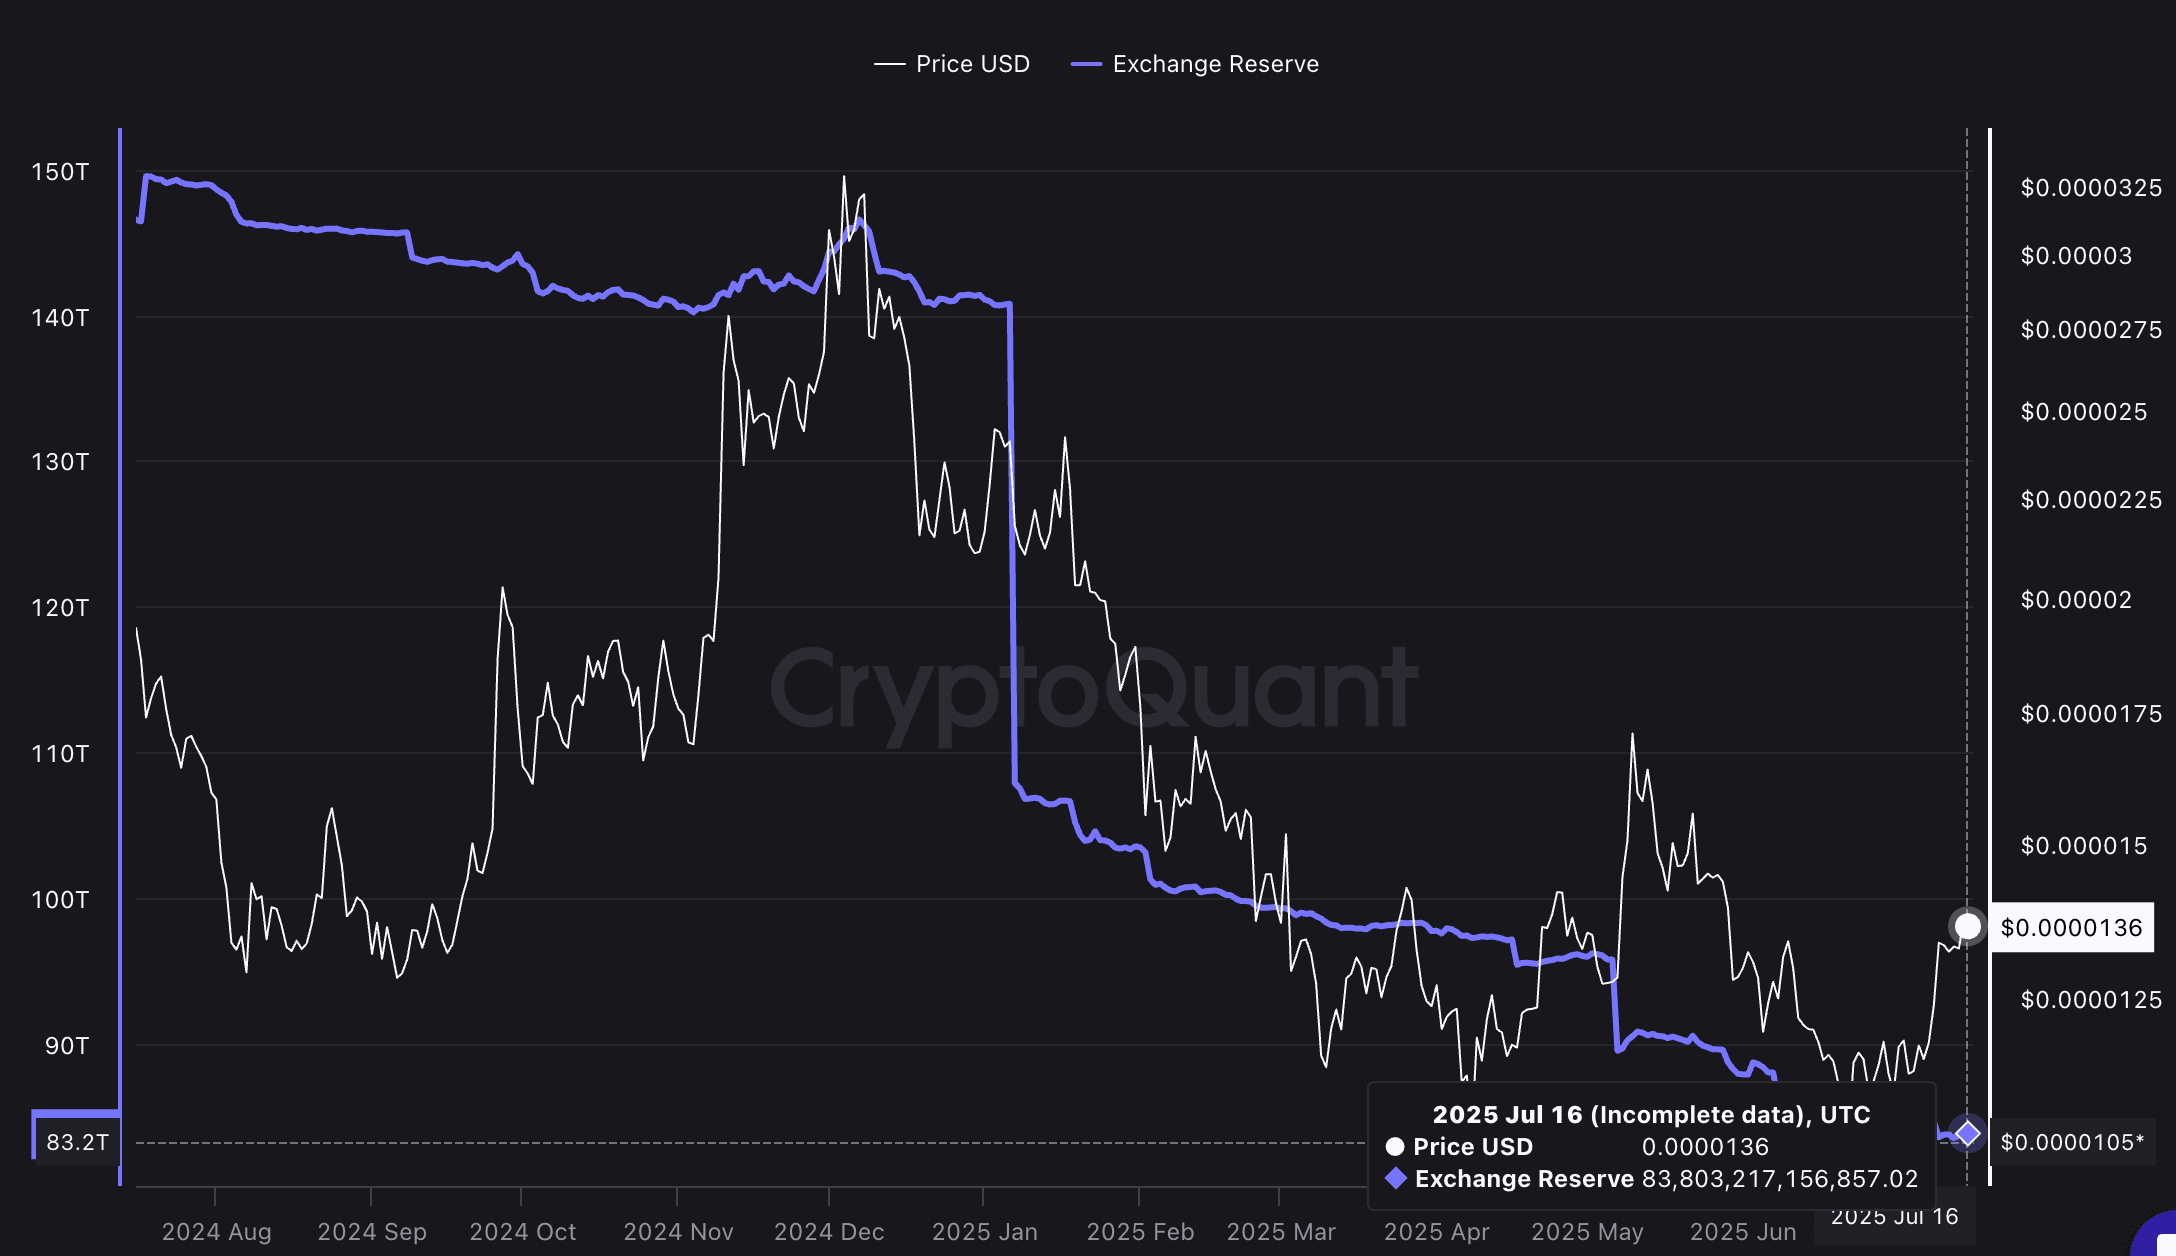
This figure is significantly lower than over 150 trillion tokens on exchanges in 2024, indicating that selling pressure has dwindled.
Less supply on exchanges means tighter liquidity and higher price potential — particularly significant as SHIB is currently trading at $0.0000139.
The golden cross signal has reappeared.
A new bullish crossover signal has just appeared on the SHIB chart: the 20-day exponential moving average (EMA 20) has crossed above the 50-day EMA — also known as a golden cross, which often signals a strong upcoming bullish trend.
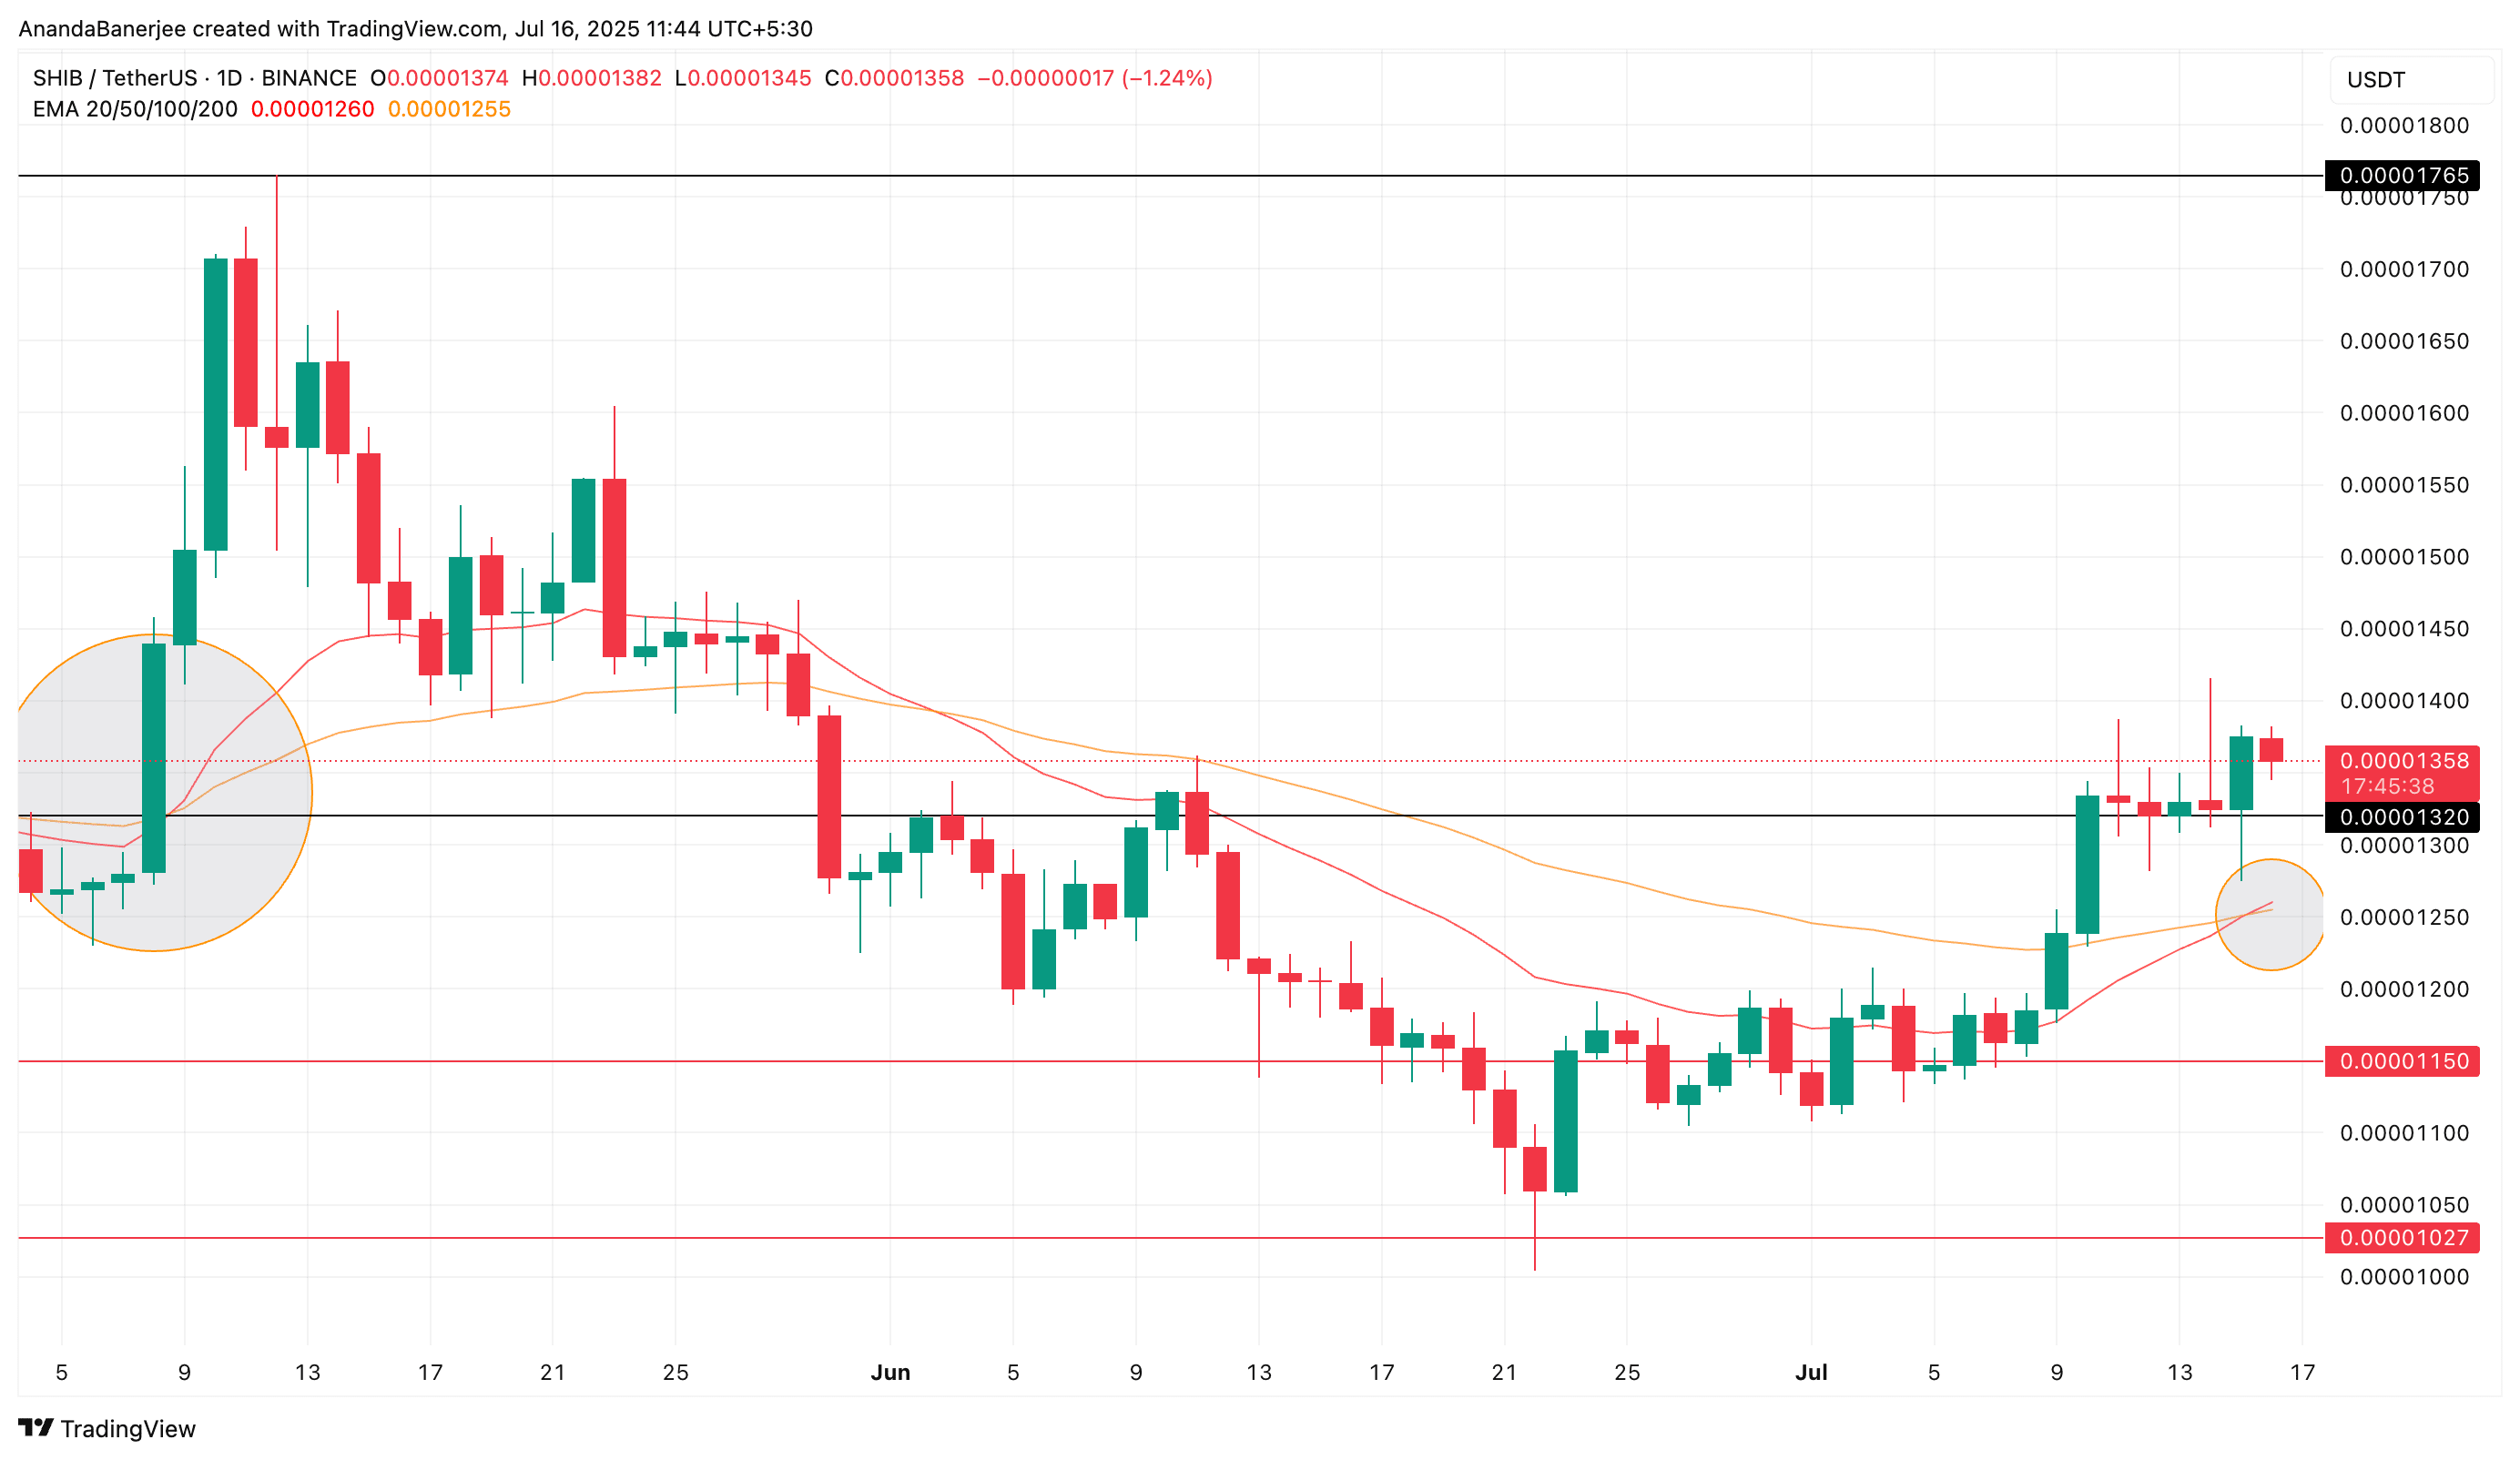
This pattern appeared in May 2025, right around the price level of $0.0000132. At that time, SHIB surged nearly 34%, peaking at $0.00001765. Interestingly, the current crossover signal appears at a nearly similar price level, increasing the likelihood of history repeating itself.
A golden cross is a positive technical indicator, showing that market momentum is leaning towards the buyers. When the short-term EMA crosses above the long-term EMA, it usually signals that a new bullish trend may begin.
SHIB's price shows the potential for a 38% increase if it surpasses resistance.
Currently, SHIB is approaching a small resistance level around $0.00001421, an area it previously could not reach. Further out, the chart indicates important supply areas at $0.00001468, $0.00001577, and $0.00001765.
If the bulls can overcome these areas, the path will open up to $0.00001809 and $0.00001867 — these are low resistance areas, providing a price increase potential of 33% – 38% from the current level, similar to the surge in May.
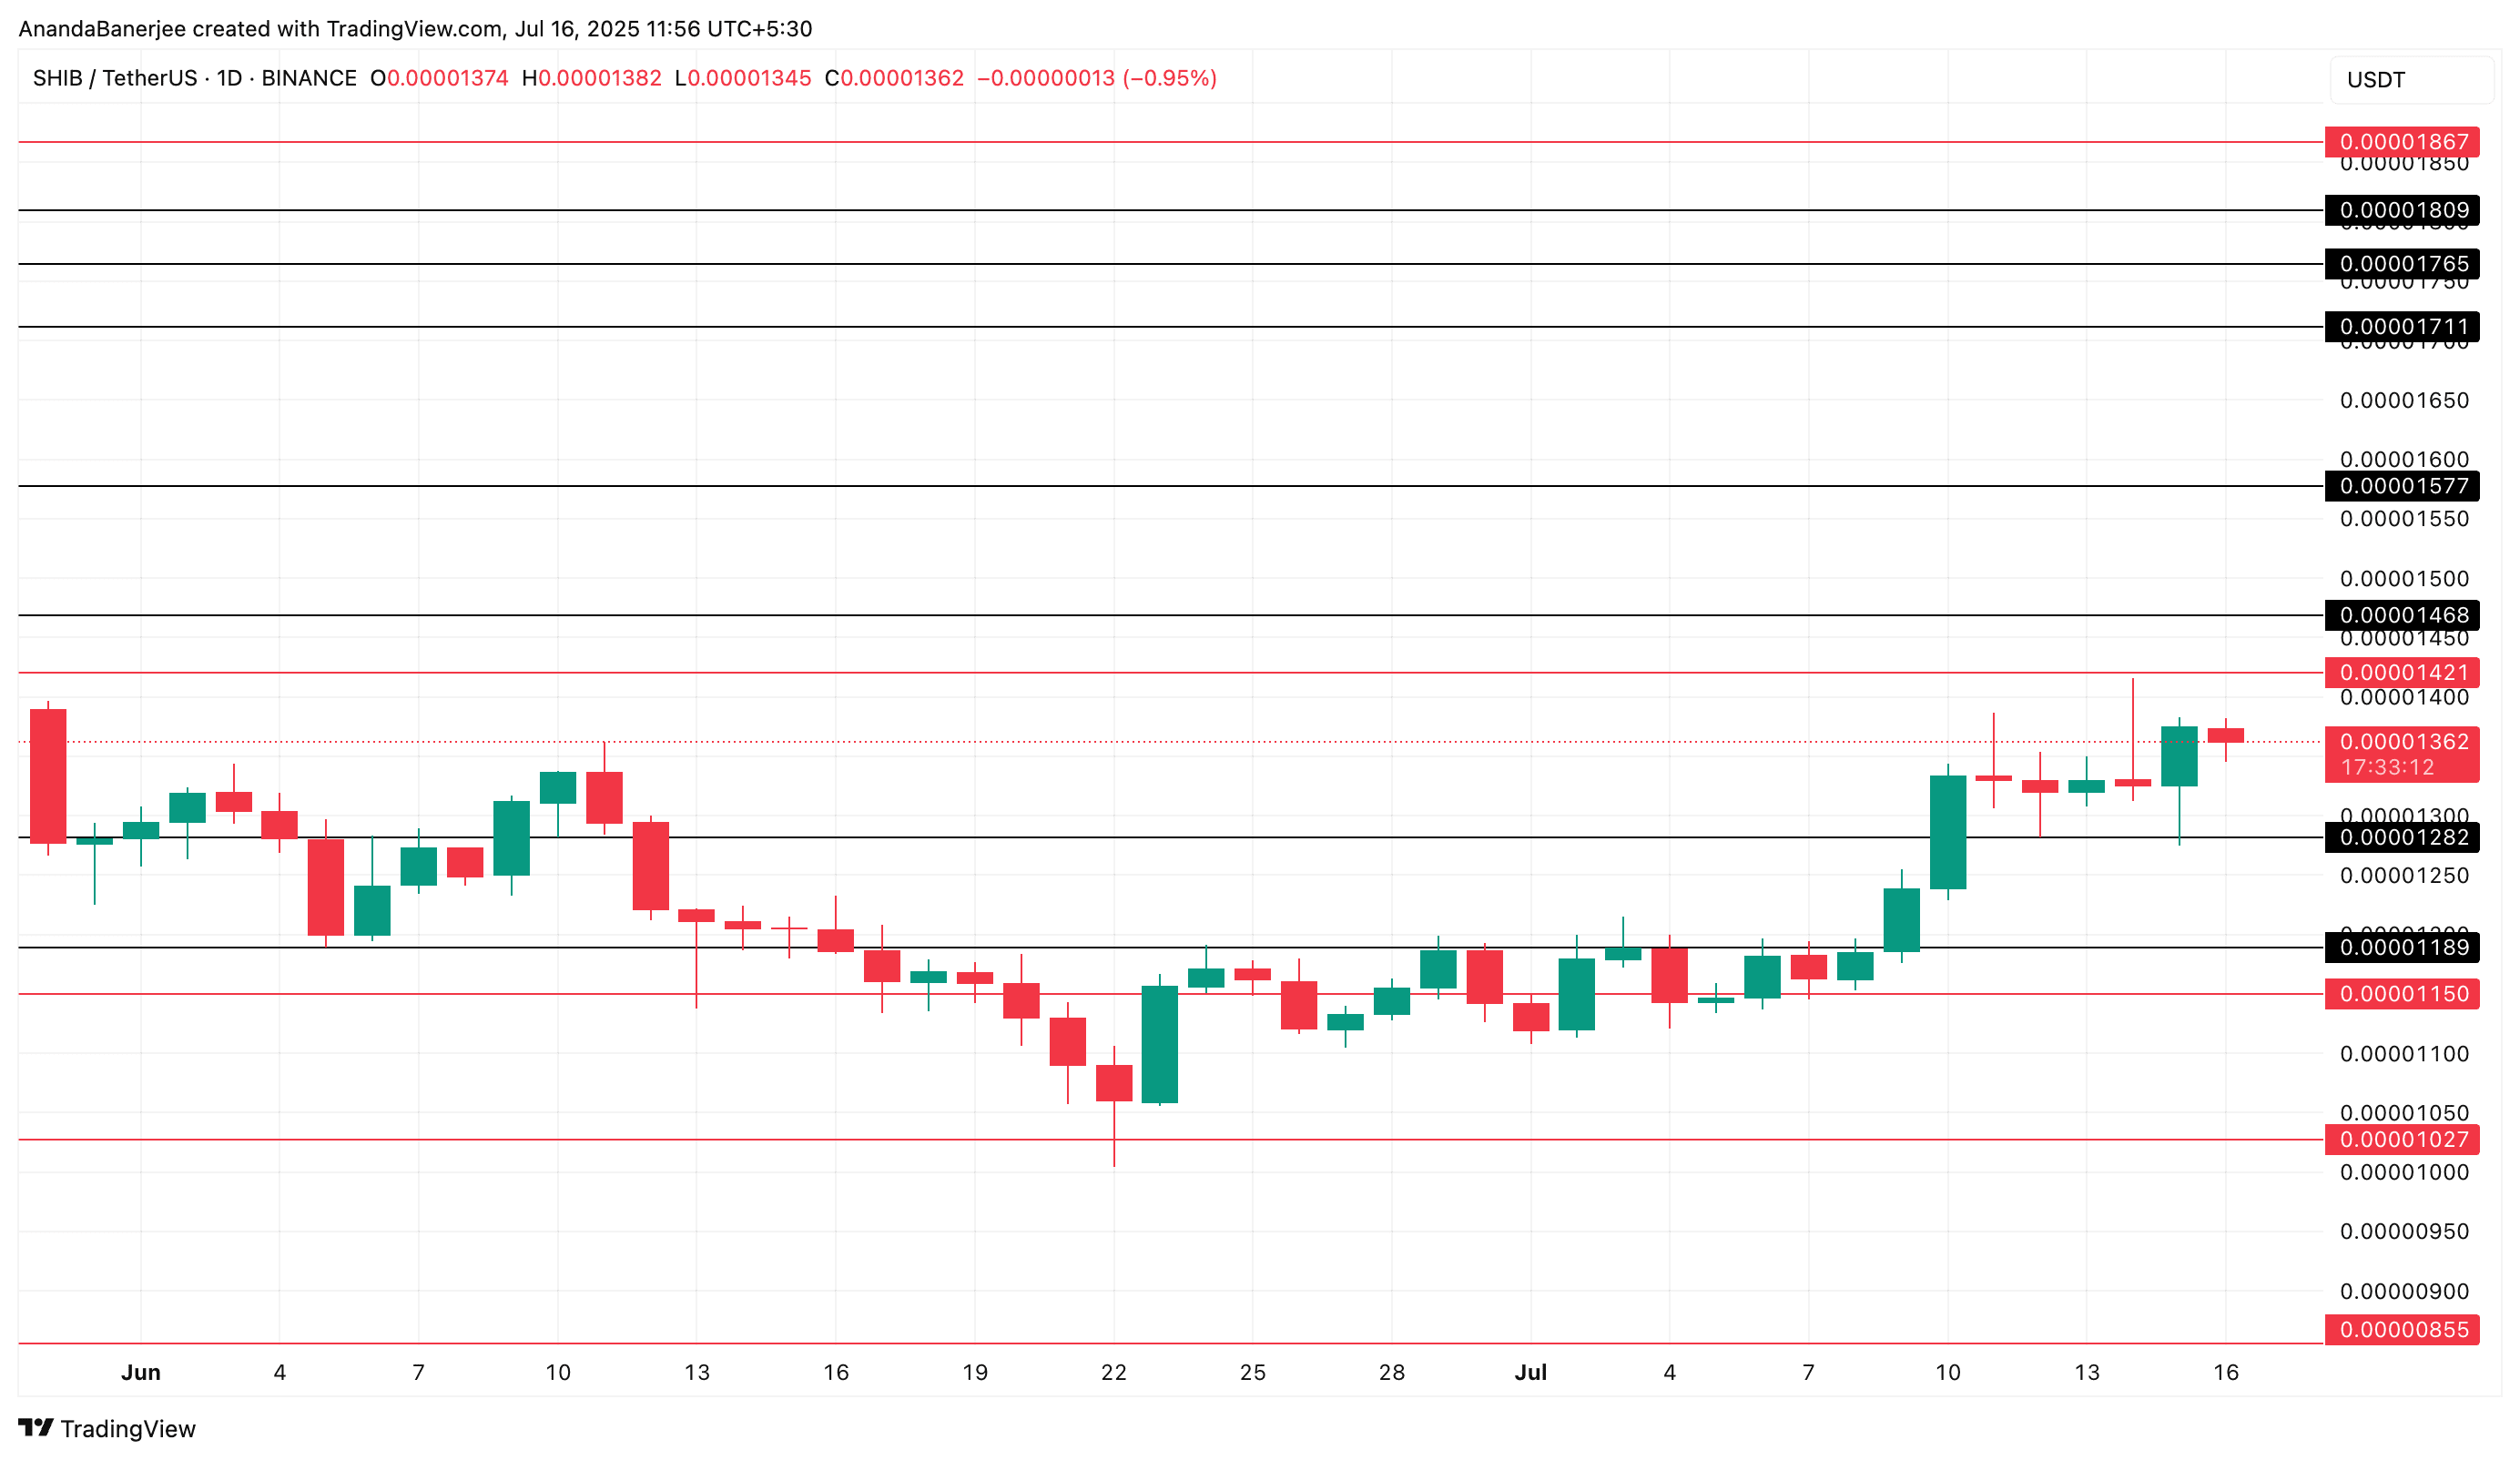
On the downside, the nearest support area is at $0.0000132 — which is also the area where the golden cross signal previously appeared. Below that is a stronger support area at $0.0000115.
However, if the price of Shiba Inu drops below the support level of $0.00001282, and continues to break through the important support levels at $0.00001189 and $0.0000115, the bullish trend will be invalidated. Losing these levels will open up the risk of a deeper correction.