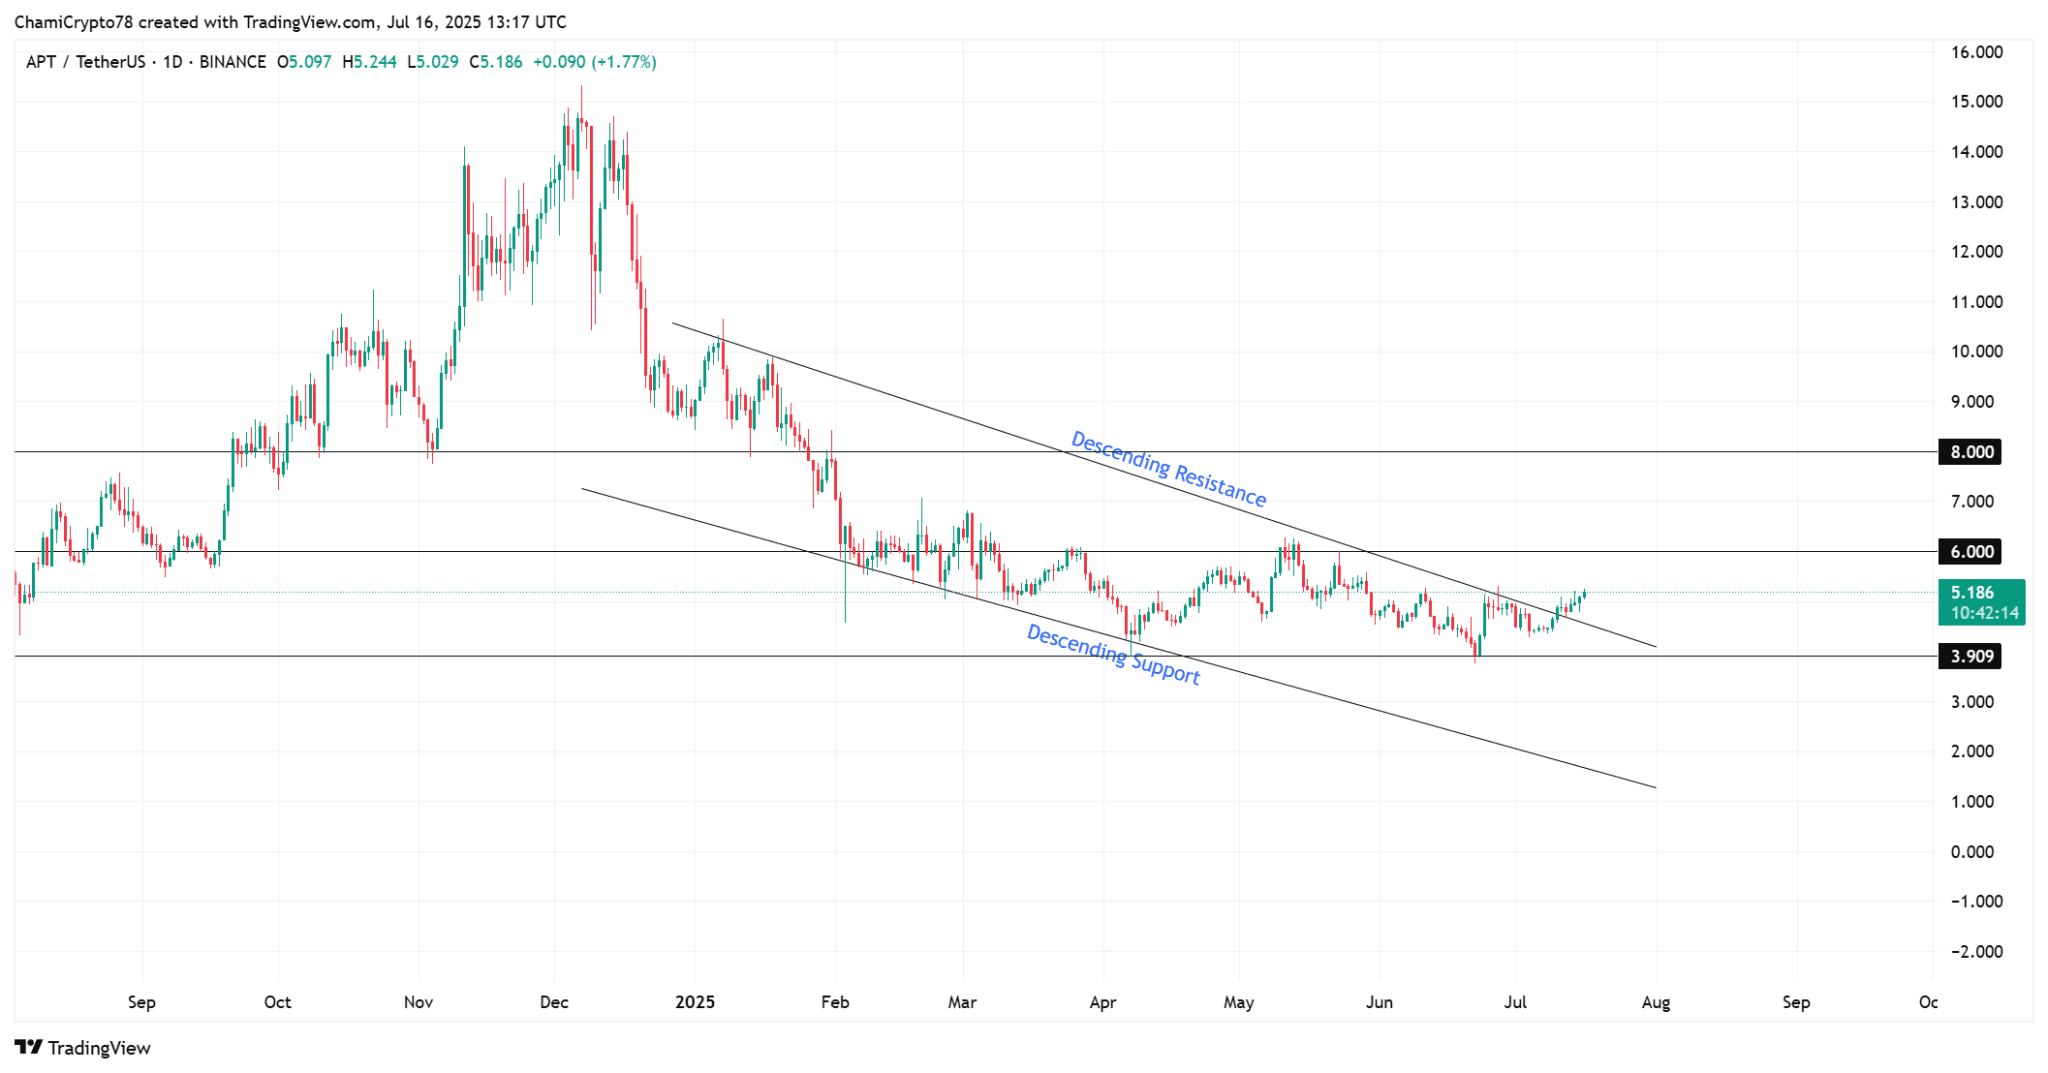
Aptos (APT) has finally escaped from the descending wedge pattern that has persisted for months – a technical setup that often signals the potential for a bullish reversal. At the time of writing, APT's price has climbed to 5.2 USD, up 13% for the week and surpassing a key psychological threshold.
This breakout aligns perfectly with expectations from the technical chart, simultaneously turning the old resistance area into a new support zone. Current indicators suggest that the upward trend may continue, with the next price target at 6.3 USD and further at 8 USD.
However, momentum alone does not guarantee a smooth upward trend. Investors need to assess additional supporting factors to confirm the trend or be cautious of the potential for a correction.
Why does selling pressure still dominate despite APT's recent breakout?
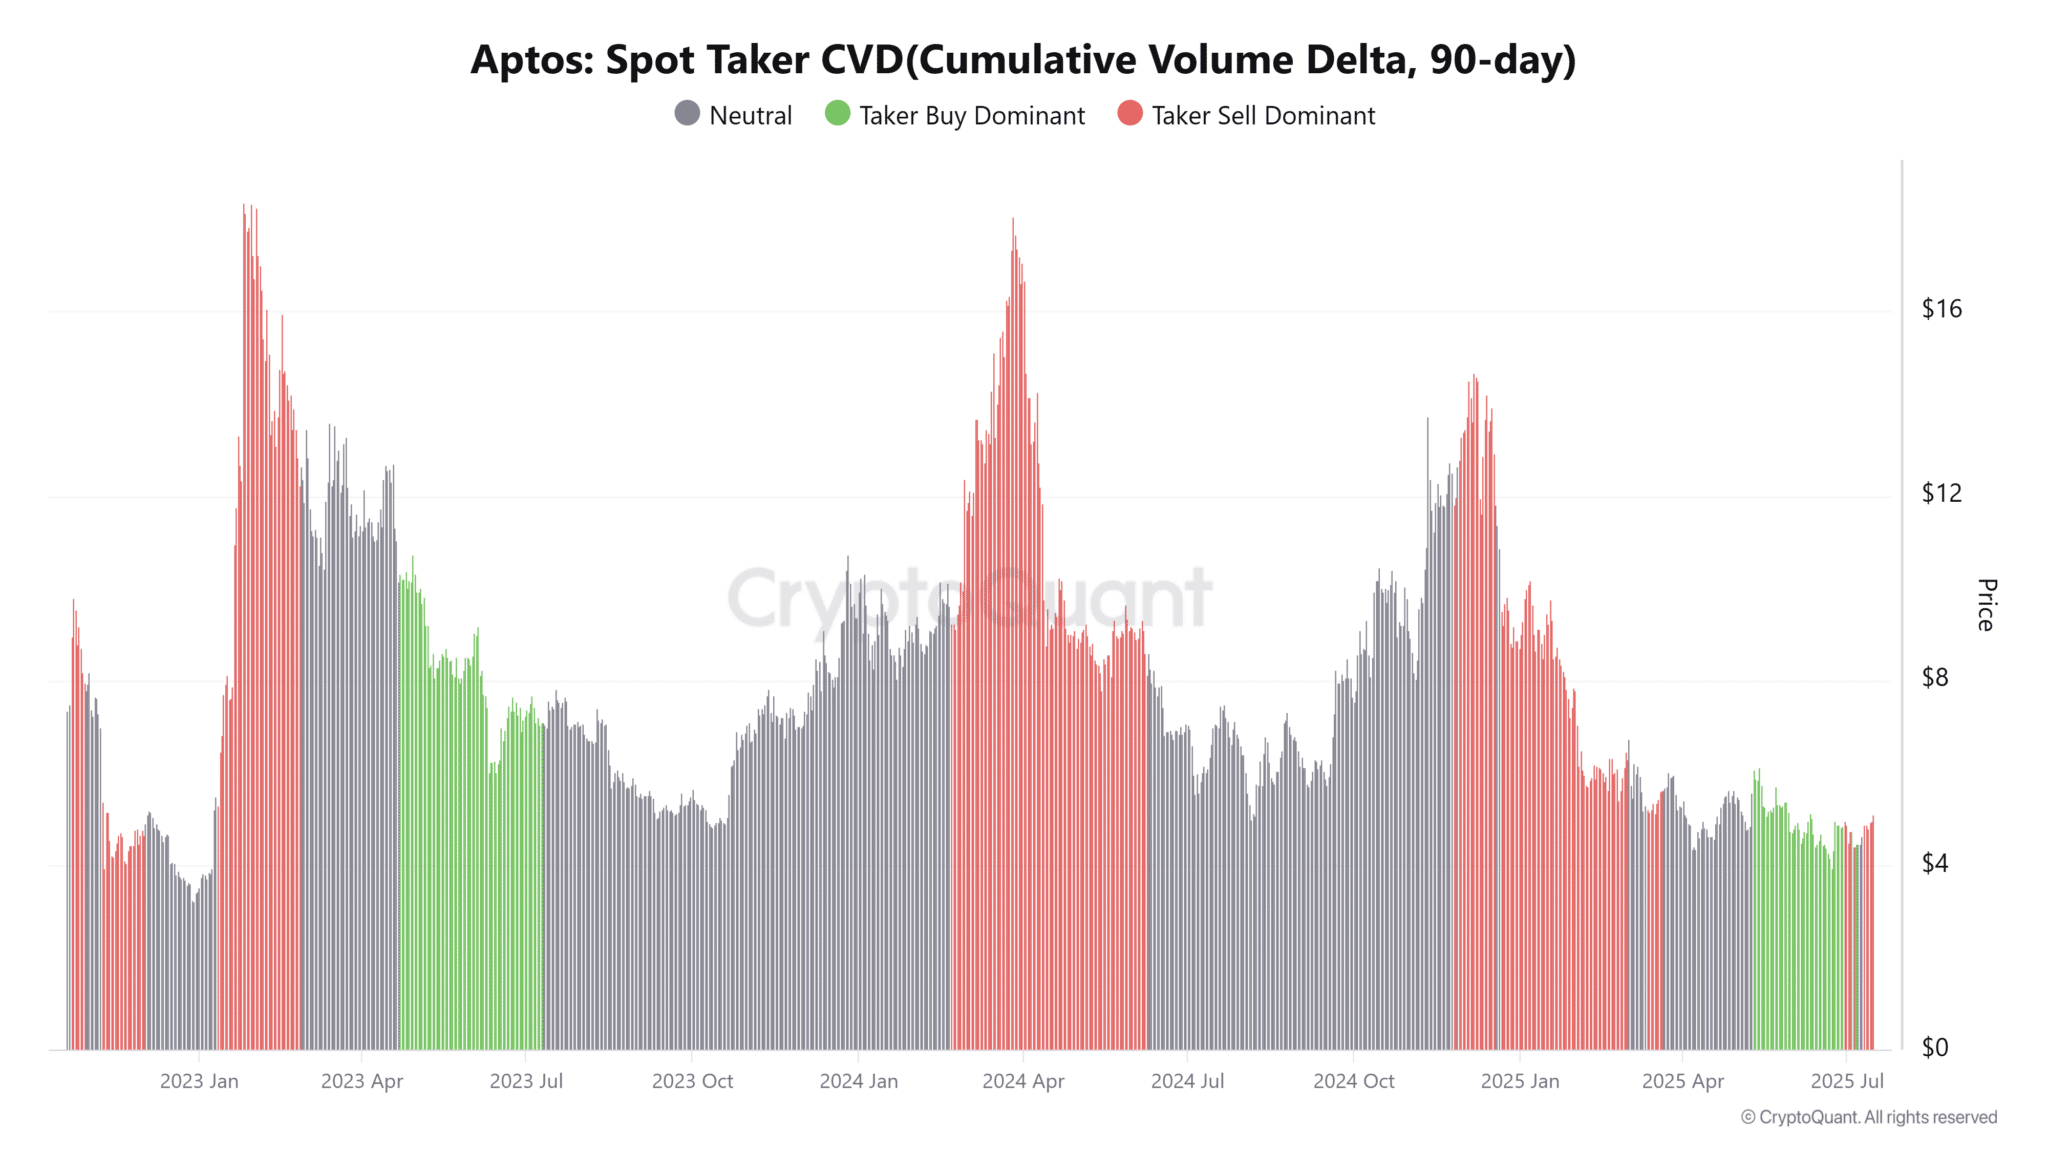
Although the price action looks positive, the CVD (Cumulative Volume Delta) indicator reflects a different trend: sellers still hold the upper hand. This indicates that many traders are selling as prices rise.
The divergence between price and trading volume is often a warning signal for false breakouts or short-term corrections. If this trend continues while prices accumulate, the market may experience stronger fluctuations or retreats. However, if buying demand outweighs selling pressure, APT could still break free from the constraints and maintain an upward momentum.
Spot holders show renewed confidence
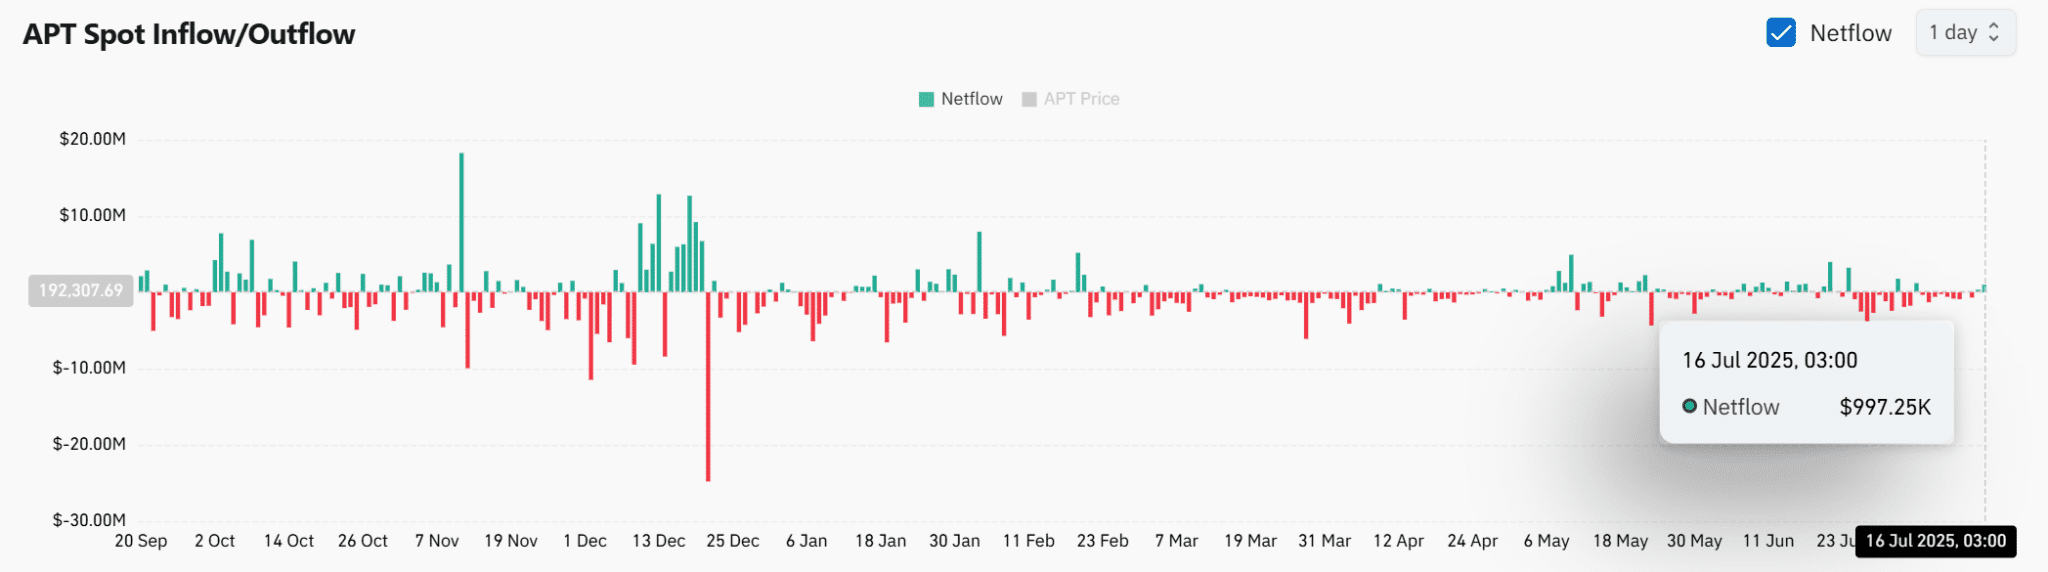
Despite on-chain data showing that sellers are in control, the on-chain spot cash flow records a positive signal with a net inflow of nearly 1 million USD flowing into Aptos on CEX exchanges.
This cash flow reflects an accumulation trend rather than allocation, especially after APT broke through the technical pattern. Historically, strong inflows during breakout phases often serve as a catalyst for reinforcing upward price trends.
If this pattern repeats, APT could continue to challenge higher resistance levels. However, consensus from other indicators such as the derivatives market and overall sentiment is still needed.
DEX volume spikes
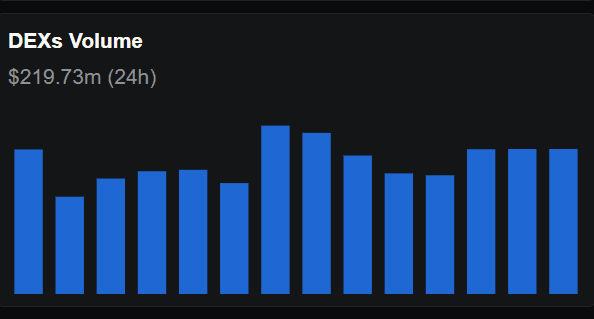
APT's recent breakout also coincides with a strong increase in trading volume on DEXs. Specifically, the total trading value on DEXs in the past 24 hours reached 219.73 million USD, while the total weekly volume has risen to 1.511 billion USD – up 16.96% from the previous week. This growth indicates that users are increasingly interacting with the Aptos ecosystem, thereby reinforcing on-chain demand.
Additionally, the development of decentralized liquidity often helps reinforce price trends, as the number of actual users increases and trading activity becomes stronger. If this upward momentum is maintained, Aptos could attract more capital flows and stabilize prices above key support areas – laying the foundation for a sustainable upward trend in the near future.
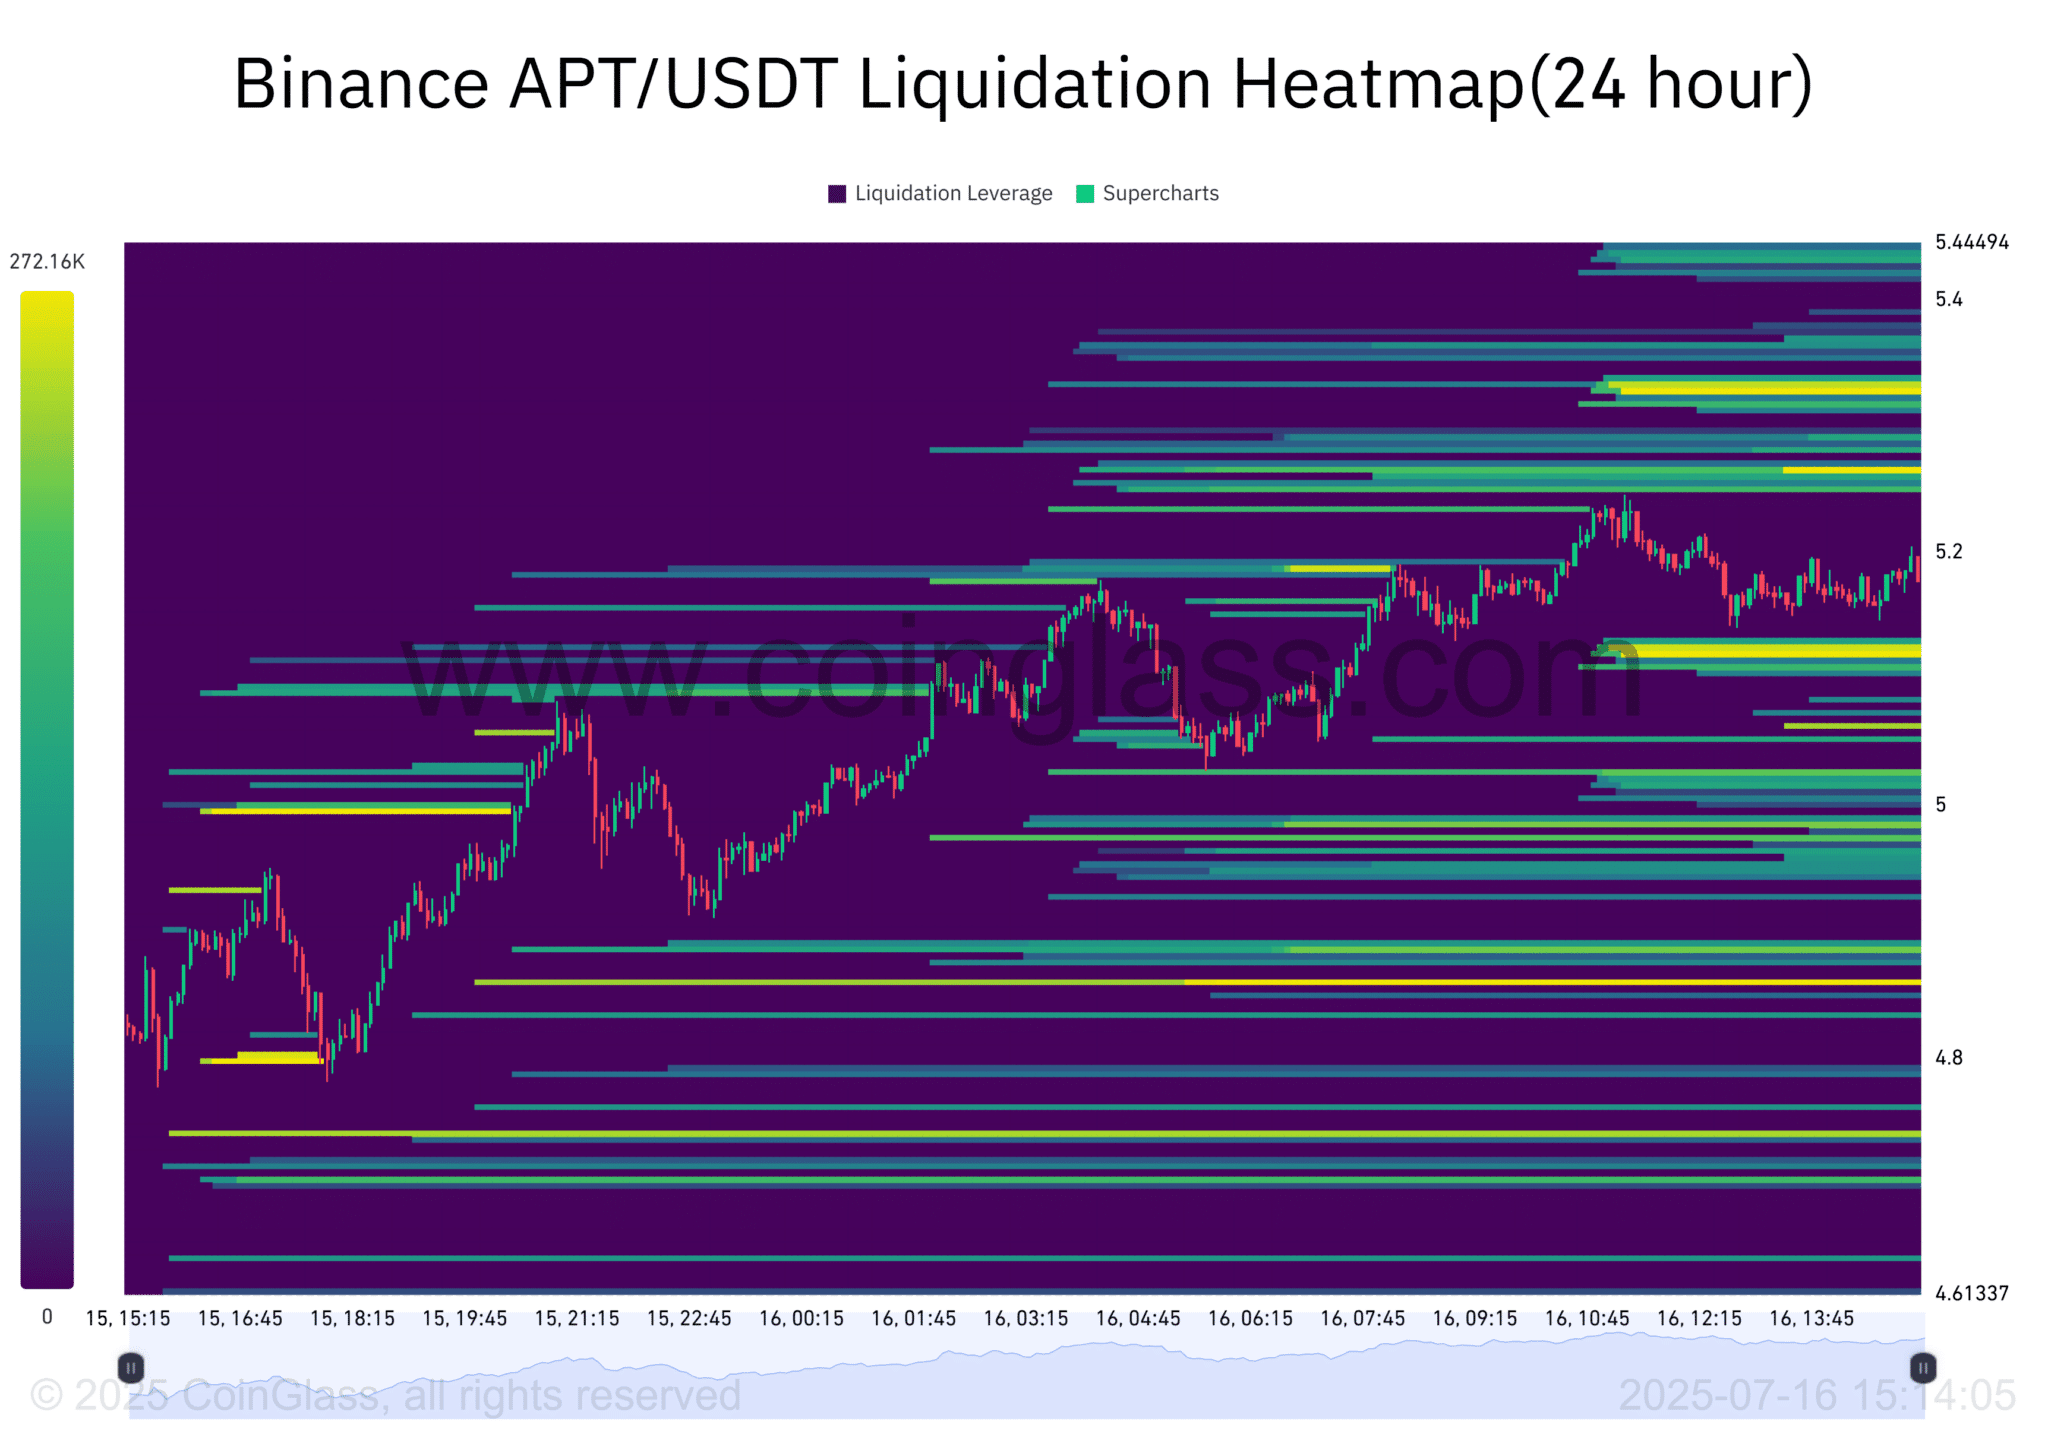
Dense liquidation cluster around the 5 USD mark
Heatmap data from Binance shows dense liquidation clusters concentrated in the range of 5-5.4 USD, indicating that leverage usage in this area is very high.
These liquidation clusters often become 'price magnets,' which could trigger mass liquidation of short positions if APT continues to rise, thereby creating an even stronger upward price effect.
Conversely, if APT drops below 5 USD, buyers may lose control, leading to deeper selling pressure. The area around the 5 USD mark is currently sensitive and could determine the market's next direction.
Is the breakout from the descending wedge strong enough to drive long-term growth?
APT's breakout from the descending wedge pattern is a positive technical signal. Factors such as spot cash inflow and trading activity on DEXs also support the bullish scenario.
However, the overwhelming selling pressure and dense liquidation clusters suggest that investors should remain cautious. If the accumulation of cash flow continues and the bulls maintain key support levels, APT could target 6.3 USD, even 8 USD. Conversely, a correction back to old support may still occur.
