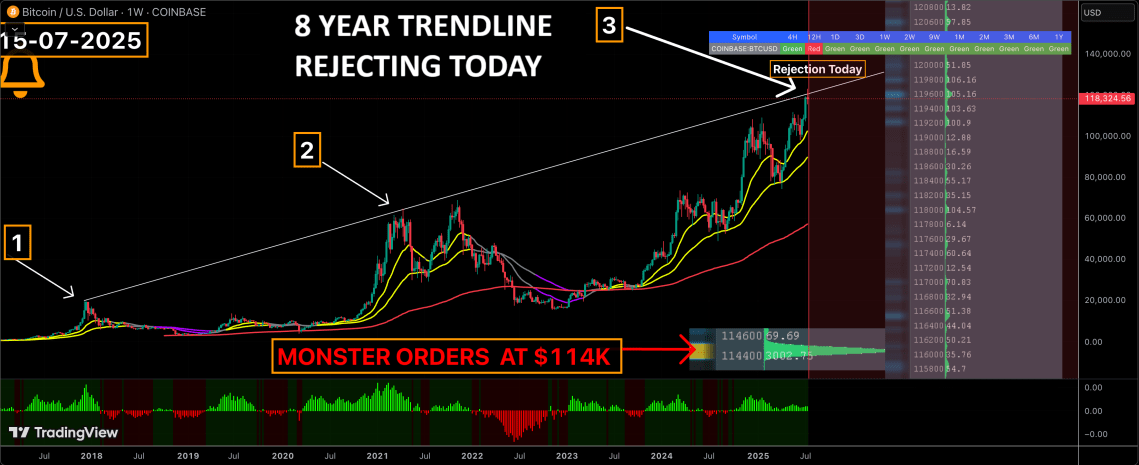
After a strong increase over the weekend and setting a new ATH, the price of Bitcoin seems to have encountered a "wall" around the $120,000 mark, causing the market to adjust slightly. Although it is expected to be just a short-term correction, a notable signal has appeared: Bitcoin just touched the extended 8-year trend line – which has previously defined the peaks of previous bullish cycles.
If this resistance line cannot be broken, it is very likely that this has been the peak and the market will enter a prolonged downtrend.
Does the 8-year trend line indicate that Bitcoin has reached its peak?
According to data from technical analyst MartyBoots, Bitcoin has just retested the trend line extended from the 2017–2018 cycle, where peaks of many previous bull market cycles were established. In the 2020–2021 growth cycle, this line once again marked the peak when Bitcoin set a record at the $69,000 mark.
Currently, the price of Bitcoin has once again touched this trend line and was immediately rejected after slightly exceeding the $123,000 mark. Shortly after, selling pressure and profit-taking surged, pushing the price down.
However, for this trend reversal to be confirmed, experts still need to observe a few more signals. MartyBoots stated that investors should closely monitor whether the weekly RSI indicator shows a bearish divergence. At the same time, the declining trend in trading volume and the appearance of more rejection wicks* will also be confirmation signals that the market has peaked.
He also emphasized that the price hitting this trend line for the third time increases the likelihood of repeating the previous scenario: entering a prolonged correction phase. If this is the case, then it could be the beginning signal of a new bear market cycle. Marty commented:
"This trend line has previously triggered prolonged corrections lasting several months, leading to downtrend cycles."
There is still a chance for the upward trend to continue.
However, the fact that Bitcoin hits this trend line does not necessarily mean the end of the upward trend. MartyBoots also notes that if the price can decisively break through this resistance area, the trend line will become support and open up new growth potential for BTC.
Moreover, despite profit-taking pressure, the demand for buying Bitcoin remains very strong. In particular, there is a huge amount of buy orders waiting at the $114,000 level – indicating a truly solid demand that could push the price up as the cost basis* of investors continues to rise.
Nevertheless, the expert still recommends that investors should be cautious until the market clearly establishes a trend. Marty emphasized:
"Consider tightening your stop-loss, reducing leverage, or hedging your portfolio until the trend around the trendline is clearly confirmed."
*Rejection wick is the long tail at the top or bottom of a candlestick on the price chart, indicating a rejection of a certain price level.
*Cost basis is the initial value of an asset for tax purposes, usually the purchase price, adjusted for stock splits, dividends, and capital return distributions.