
Shiba Inu whales ($SHIB ) went hunting for attractive deals early this week after prices fell to a 16-month low of $0.00001005.
According to Coin,,Desk's artificial intelligence research, whales bought 10.4 trillion tokens $SHIB , worth over $110 million, on Monday, marking the largest daily accumulation in five months.
Whale activity is likely contributing to the cryptocurrency's price increase of 17% from its 16-month low reached on Sunday. Notably, the broader cryptocurrency market has stabilized after the initial reaction to tensions in the Middle East. Bitcoin, which dropped below $100,000 over the weekend, is currently trading near $106,000.
Market data indicates that #SHİB is maintaining a generally constructive position, with higher lows forming a slight upward trend channel. The token found significant support in terms of volume at the $0.00001158 level during the 24 hours from June 24 at 09:00 to June 25 at 08:00, with trading volume rising to 439 billion, well above the daily average.
This accumulation at support levels suggests the potential for upward momentum to continue if resistance at $0.00001175 is decisively breached. As of this report, $SHIB is trading.

around $0.00001162 on major exchanges, according to Coin,,Desk data.
Key artificial intelligence insights
The higher low levels formed a slight upward trend channel, indicating accumulation at support levels and the potential for upward momentum to continue if resistance at $0.00001175 is surpassed.
During the 60 minutes from June 25 at 07:06 to 08:05, SHIB rose from $0.00001169 to $0.00001171, representing gains of 0.2%.
A significant price spike occurred between 07:25-07:27, with volume peaking at 12.36 billion SHIB as prices reached a session high of $0.00001175.
Price movement formed an upward channel with higher lows, although a sharp correction at 08:03 tested the support level of $0.00001171, indicating consolidation following the previous rise.
Hourly chart
SHIB's recovery has stalled since Tuesday, with prices seemingly trading in a descending triangle characterized by a downward trend line and a horizontal support line.
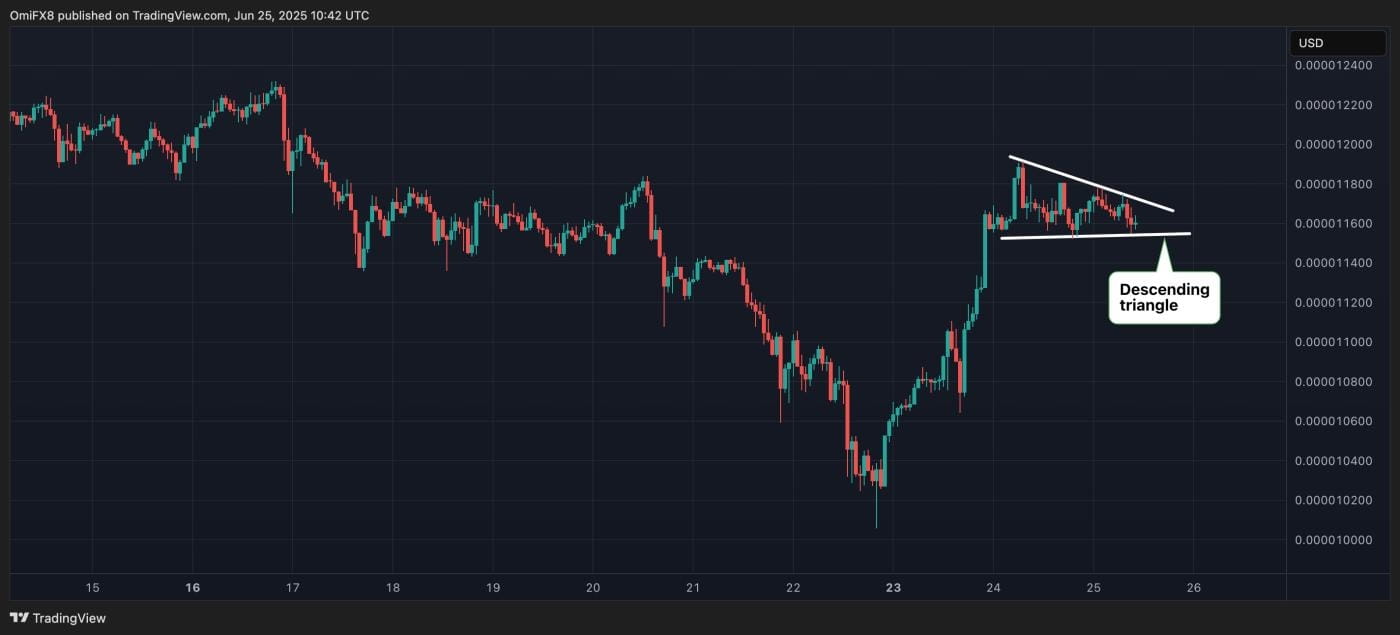
Price movement across the descending trend line would indicate continued recovery, revealing resistance from June 16 above $0.00001230. Conversely, a breakdown from the triangle would indicate a more significant bearish reversal.
#BTC110KToday? #BinanceAlphaAlert #BinanceTGEXNY #BinanceHODLerSAHARA