Macroeconomic Interpretation: U.S. President Trump confirmed that Israel and Iran have reached a ceasefire, although both sides accuse each other of violations, but substantial conflicts have not escalated. This situation far exceeds market expectations, driving a rapid recovery in global risk appetite. The Tel Aviv index in Israel rose by 1.4%, and Saudi and Dubai stock indices rose by over 2%, with European stocks generally rising. For the crypto market, the decline in geopolitical safe-haven demand coincides with technical support, with strong buying at the $99,000 position, on-chain data shows long-term holders are taking the opportunity to increase their holdings, while short-term speculative positions are gradually exiting.
Federal Reserve Chairman Powell's congressional hearing this week can be described as 'the most severe test in a decade.' Trump publicly pressured on social media, accusing Powell of refusing to cut interest rates, causing the U.S. to miss out on $800 billion in profits, and hinted that Europe has cut rates 10 times. Ironically, there is also a key division within the Federal Reserve: Trump-appointed governors Bowman and Waller openly support a rate cut in July, and the two are viewed as potential successors to Powell after his term ends in 2026. CME data shows the market's pricing of the probability of a rate cut in July has risen to 20.7%, while the latest comments from Federal Reserve official Goolsbee, 'If the trade policy impact disappears, we should continue to cut rates,' further strengthen dovish expectations.
As the market focuses on the interest rate cut game, a deeper transformation is occurring. The U.S. Federal Housing Finance Agency announced a study to incorporate cryptocurrency holdings into mortgage qualification assessments, overseeing trillion-dollar housing finance giants like Fannie Mae and Freddie Mac. Symbolically, FHFA Director Thompson himself holds between $500,000 and $1 million in Bitcoin and Solana. If this initiative is implemented, it would mean that cryptocurrencies will deeply intervene in the U.S. housing credit system for the first time, opening up the imagination for DeFi collateral applications.
At the same time, the stablecoin issuer Circle has a valuation exceeding $60 billion, almost equivalent to the circulating $61.2 billion USDC. This marks the acceleration of capital flow towards the crypto infrastructure layer—compared to the $78.3 billion market cap of the trading platform Coinbase, the market is giving a premium valuation for pure stablecoin issuers. Coupled with the advancement of the U.S. GENIUS stablecoin bill and the rollout of the EU MiCA framework, the compliance process is reshaping the industry valuation logic.
The short-term momentum and long-term narrative of BTC show that the driving logic currently present in the crypto market includes liquidity expectations, an increasing probability of Federal Reserve interest rate cuts directly lowering the dollar index, and a decline in the discount rate within risk asset valuation models, which supports deflationary assets like BTC; there is also the integration of traditional markets, from mortgage qualification assessments to financial institutions' asset-liability management, where the increased penetration of crypto assets brings incremental funds; and capital is gathering towards stablecoins, custodians, and settlement layers, solidifying market foundations while reducing systemic risk.
The technical aspect shows that Bitcoin has effectively broken through the key resistance of $105,000. If it stabilizes at this position, the next target may point to the pressure zone of $110,000-$115,000. However, caution is needed for short-term geopolitical fluctuations and risks of diverging expectations from the Federal Reserve—if Powell releases hawkish signals during the congressional hearing, it may trigger profit-taking.
When Bitcoin steps out from the label of a safe-haven asset, when stablecoin valuations rival those of leading exchanges, and when mortgage institutions begin to assess your crypto holdings—the boundaries between the traditional financial system and the crypto ecosystem are dissolving. The Federal Reserve's interest rate cuts have become not just a choice of interest rate tools but a fulcrum for the game between the crypto market and traditional capital. Above this fulcrum, a new crypto era driven by infrastructure and supported by compliance is gradually taking shape.
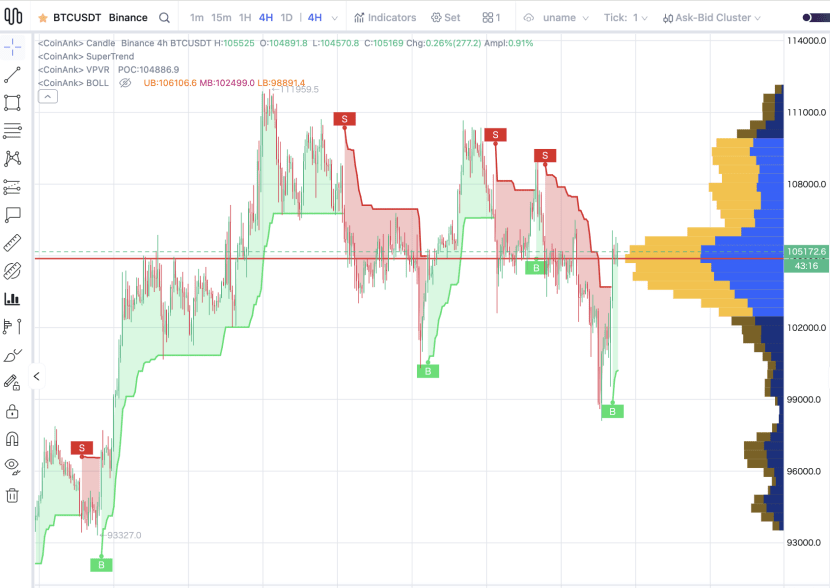
BTC K-line Analysis:
According to CoinAnk AI intelligent analysis, the market analysis report is as follows:
Main Support Level: 100,941.07 USDT
Main Resistance Level: 107,443.47 USDT
Current Trend: Slightly Bullish
Comprehensive Technical Indicators:
Moving Average System: Bullish Arrangement
MA5 (104,611.17) > MA10 (102,955.77) > MA20 (102,485.18), short-term moving averages are in a bullish arrangement, indicating a strong short-term trend. However, MA120 (105,232.55) is slightly higher than the current price, caution is needed for long-term moving average pressure.
MACD: Golden cross is in progress
DIF (130.37) crosses DEA (432.13), and the histogram (562.50) continues to expand, indicating enhanced bullish momentum.
BOLL: Price is close to the upper band
Current price (105,167.70) is close to the upper band (106,053.78), %B value is 0.84%, indicating the price is in a strong zone, but caution is needed regarding the upper band pressure.
RSI: Neutral to Strong
RSI6 (71.45) is close to the overbought zone, RSI12 (60.97) and RSI14 (59.01) are neutral to strong, there may be a need for a short-term pullback, but it is not severely overbought.
KDJ: Golden cross is in progress
K (81.91) > D (75.99) > J (93.75), indicating short-term overbought, but the trend remains bullish.
Indicator Data:
Funding Rate: 0.00436100%
Rate is neutral, and no extreme bullish or bearish sentiment has emerged (BTC rate absolute value is less than 0.02%), market sentiment is stable.
Volume Changes:
Recently, 4H trading volume has expanded, accompanied by price increases, indicating good volume-price coordination. However, attention should be paid to some high-position K-lines with decreasing volume, cautioning short-term profit-taking.
Capital Flow Data:
24H contract net inflow (900,401,593.66 USDT) is significant, but the 4H net outflow (266,237,913.10 USDT) shows short-term capital divergence. The spot 24H net outflow (119,521,511.46 USDT) indicates some capital is leaving, which requires a comprehensive judgment in conjunction with contract capital flows.
Analysis Results:
Direction: Cautiously bullish
Short-term trend is bullish, but close to resistance level (107,443.47) and RSI is short-term overbought, caution is needed for pullback risk.
For the cautious: waiting for a pullback to MA5 support to build positions in batches.
Stop-loss setting: 3%-5%, stop-loss if it falls below MA10.
Target price level: 107,443.47 (first resistance level) to 109,997.93 (second resistance level), corresponding to a return of 2.2%-4.6%. If it breaks through 107,443.47, it can be held until 109,997.93.
Note: This analysis is for reference only and does not constitute any investment advice!