1. After the second upgrade of the higher level, when will the rise after 102664 end?
The higher level can be upgraded, and it has already been upgraded for the second time! The 1-hour higher level three segments of the rise have been upgraded to the 4-hour higher level three segments of the rise!
(1) On the morning of June 15, I pointed out in the private circle:

The entire Y wave internal ending consists of 5 descending segments, with an internal structure of WXYXZ corrective wave. The black line is the Y-W wave, the purple line is the Y-X wave, and the orange arrow is the Y-Y wave. The Y-X wave's internal structure is currently a double zigzag corrective wave. Currently, it is at the end of the Y-Y wave or Y-X wave.
Assuming 106252 is the highest peak of the Y-X wave, on June 17, the Y-Y wave continues to decline to 98386.14-99959.31 to end. During the decline, it will be supported by the blue Gann angle line and the green Gann angle line, while facing pressure from the purple-red Gann angle line.
Assuming 106252 is not the highest peak of the Y-X wave, it needs to rise above 105680 to be possible, requiring a 4-hour MACD golden cross to cooperate. The ideal rising peak is around 106517.19, and a slightly strong surge can reach around 106811.38-107170.15. No matter how much it rises, it should not effectively stand at 107888.69, nor will it B rebound to a new peak at this position. According to the wave trend, if a B rebound to a new peak occurs, it will only be possible at 98000-100000.
(2) On the afternoon of June 15, I pointed out in the private circle:

Everyone should pay particular attention to the bottleneck of the purple-red Gann angle line! Whether there is a new peak mainly depends on whether it can be suppressed! (It has already broken through significantly.)
Observe the resistance at 104998-105214, extreme 104665 (already realized).
If it effectively stands above 104665, there is still a possibility of making a new peak.
If it effectively loses 104665, then a new peak will not be possible.
If a new peak is reached at 106252+, ideally, the rise is around 106517.19, and a slightly strong surge can reach around 106811.38-107170.15. No matter how much it rebounds, it should not effectively stand at 107888.69, nor will it B rebound to a new high at this position.

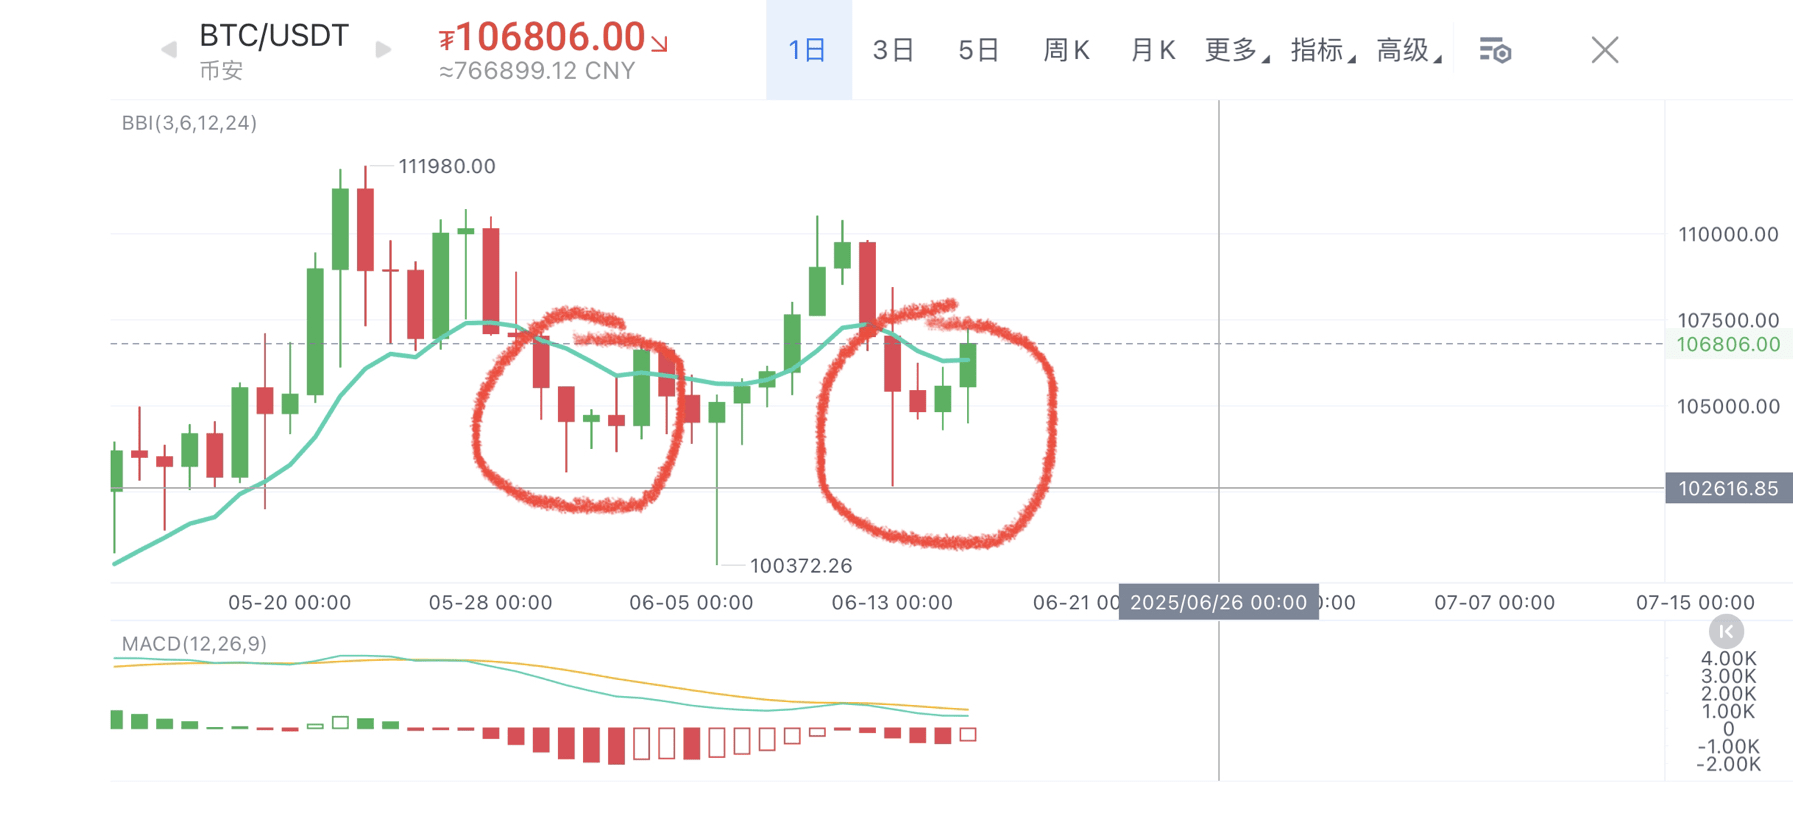
(3) As of the time I wrote this article, the higher level has already been upgraded for the second time. My wave counting yesterday was indeed correct; the Bull Demon King has already reached a new high point of 106785:

<1> The 1-hour higher level three segments of the rise have been upgraded to the 4-hour higher level three segments of the rise.
<2> The ideal rising peak is around 106517.19-106811.38-107170.15. No matter how much it rises, it should not effectively stand at 107888.69, nor will it B rebound to a new peak at this position.
Pay attention to the suppression of the two black Gann angle lines and when the small-level 5 waves end.
<3> When the 1-hour MACD shows divergence + dead cross, it can be judged early that the rise has ended. When the 4-hour MACD dead cross occurs, it finally confirms that the rebound has ended.
2. Will it decline to 98000-100000 on June 17 or June 19-21?
Why June 17? Because this is an important turning point in the Gann time sequence.

No matter how the market moves, June 17 is indeed a turning point, which can be interpreted as a second peak occurring around June 17 or a low occurring around June 17. Which one is more suitable, we will analyze further!
The trends of the Bull Demon King in these two segments are very similar, like seeking a sword by carving a boat; on June 17, it declines again to 98000-100000. The difference is that after January 13, 2025, a super positive factor appears, leading to a B rebound to a new peak. Reaching 98000-100000 is very critical; it is necessary to judge whether it can B rebound to a new peak.

This time I can't think of any major positive factors that could B rebound to a new peak, so the trend from January 13, 2025, to January 20, 2025, cannot be sought by carving a boat.
On January 17, 2025, the Bull Demon King took 3 days to complete a decline, then took another 3 days to complete a rise, and finally took 1 day to complete a decline.

If it completely seeks a sword by carving a boat, it will take 3 days to complete the decline by June 10, then take 3 days to complete the rise, and finally take 1 day to complete the decline (with negative news). Therefore, around June 17, it can indeed decline to 98000-100000, which needs to interpret June 17 as the bottom.

Of course, history cannot be completely identical. Assuming that on June 16, it rises to the peak (and has always been positive without negative news), according to wave theory, it needs 3-5 days to descend to the target, which means it can only decline to 98000-100000 around June 19-21, allowing the interpretation of June 17 as the second peak.
 Additionally, these two segments are similar, and the method of seeking a sword by carving a boat refers to the decline from June 19 to 98000-100000.
3. Analysis of the Bull Demon King trend under a long bear market.
<1> [Wave + Wyckoff Distribution Model + Chen Theory Trend + BBI Analysis]

(1) The rise from 74508 to 111980 has ended, with an internal structure of WXY corrective wave.
(2) As shown in the figure, the decline to 111980 is likely to be a WXYXZ corrective wave, where 111980 to 100372 is the W wave, 100372 to 110530 is the X wave, after the X wave is the Y wave (around 91660-92000), after the Y wave is the XX wave (below 98000-100000), and the Z wave (monthly BBI, daily Fibonacci fan 0.3333, weekly KC lower track, daily MA 250 resonance point, visible at the 80s, especially pay attention to 88822-87424-85749, extreme 83916).
(3) The short-term wave trend analysis is as follows:

The most likely scenario next is as follows: on June 10, 110530.17 enters the Y wave downward.
Forecasting a decline to 98000-100000 around June 17 or June 19-21 (when dropping here, beware of a small probability B rebound to a historical new high due to major positive news).
After the rise, it continues to decline to around 92000 at the end of the Y wave on July 2, July 6, or July 21.
Then the XX wave rises to 98000.
Z wave starts from 98000 to decline to August, with a target in the 80s.
<2> The entire Y wave internal ending consists of 5 descending segments, with an internal structure of WXYXZ corrective wave. The black line is the Y-W wave, the purple line is the Y-X wave, and the orange arrow is the Y-Y wave.
<3> The Y-X wave's internal structure is currently a double zigzag corrective wave.
<4> Currently at the end of the Y-Y wave or Y-X wave:
The rising peak is around 106517.19-106811.38-107170.15. No matter how much it rises, it should not effectively break through 107888.69, nor will it B rebound to a new peak at this position. According to the wave trend, if there is a B rebound to a new peak, it will only be possible at 98000-100000. During the decline, the decline will be supported by the blue Gann angle line and the green Gann angle line, while the rise will encounter resistance from the two black Gann angle lines.
<5> Then the Y-XX rebounds to around 102000-103000.
<6> Finally, the Y-Z wave will have a big decline to around 92000 on July 2, July 6, or July 21.
(4) From the perspective of the Wyckoff distribution model, last week's article (the short-term direction is accurately grasped again, and the circle's 618 is the second largest discount of the year, where else can it rise? How will it move next?) pointed out; [The Wyckoff distribution model AR ice point is here at 100718.37, and there will be 1-2 more times of stubborn resistance; that will be the matter of June 17], [The 4-hour Wyckoff distribution model is shown below, theoretically forming the second LPSY peak below 110718, meaning that the rise theoretically does not exceed 110718].
As everyone can see, the highest was 110530.17, consistent with 110283, and indeed did not exceed 110718.
The view remains that there will be a decline to 98000-100000 around June 17 or June 19-21.

(5) From the perspective of the Chen theory, 106600-106794 forms a 4-hour level running center. After breaking through 106794, it will exceed 9 notes to upgrade to a daily center below 110718.

The daily center is still under construction.

(6) The daily BBI key bottleneck is currently at 106320.

<2> [Gann Theory Analysis]
Pay attention to the suppression of the two orange Gann angle lines and the purple-red Gann angle line (the rise is likely to stop here), and it will not break through the red Gann angle line in extreme cases.
If it effectively loses the resistance of the cyan Gann angle line, then the rise will be judged as ended.
After the rise ends, it will decline along the blue Gann angle line.

Using the Gann box and Gann angle lines, it is predicted that there will be a low point around 100416.99 on June 20. This is very close to my wave theory prediction of [a decline to 98000-100000 around June 17 or 19-21].
As shown in the figure:

<3> [Trend Combination Strategy Indicator Analysis]

[Long-term Indicator] The 4-hour period has begun to turn into a violent state, with the latest balance line between violent and supportive at 107749.58.
<4> [Improved Kiss System Analysis]
Using BBI and KC middle track instead of MA 5 and MA 20 may filter out frequent consolidation signals well and prevent premature exits.

The daily BBI and daily KC mid-track have formed a lip kiss, which has already appeared, and the direction has stabilized, indicating that it has entered a consolidation phase! After consolidation, it may go up or down, with a higher probability of going down.
<5> [Fibonacci Fan Analysis]
Next, pay attention to the suppression above the upper track of the Fibonacci fan zero axis. If a B rebound occurs, it will go here. At the same time, pay attention to the resistance of the Fibonacci fan 0.3333; if there is no B rebound, it will decline here in August.
<5> [5-Day CCI Analysis]
The 5-day CCI has turned below 180, marking a peak at this stage.
Currently, after the turning point moves downward, it stabilizes. Pay attention to when it will significantly turn down again, and then it will continue to decline.
Resistance near the zero axis is very critical. Observe that a B rebound similar to the double peaks of the 5-day CCI at the end of 2021 may appear near the zero axis.

<6> [Weekly MACD Analysis]
The weekly MACD green bar height is continuously decreasing. Pay attention to whether August forms a dead cross or a double golden cross? This is very important as it can help distinguish between the super cycle 3-2 wave (dead cross) and the super cycle 3-4 wave (double golden cross) scenarios.

4. There are two scenarios for the big A!

<1> Version A (Super Cycle 3-3-3-2-Z-Y Wave)
(1) The internal structure of the super cycle 3-3-3-2 wave is a WXYXZ corrective wave, currently in the super cycle 3-3-3-2-Z wave.
(2) The rise after 3040.78 does not constitute a driving wave.
The super cycle 3-3-3-2-Z wave may be a double zigzag corrective wave or even a triple zigzag corrective wave.
(3) The rise after 3040.78 is marked as the super cycle 3-3-3-2-Z-X wave.
The internal structure is a double zigzag corrective wave.
(4) Because the rise exceeded 3359.39, consuming 80%,
Therefore, the super cycle 3-3-3-2-Z-Y wave or the super cycle 3-3-3-2-Z-Z wave allows no new low below 3040.78.
(The probability of a double zigzag corrective wave making a new low is small, while the probability of a triple zigzag corrective wave making a new low is large.)
(5) If the super cycle 3-3-3-2-Z-Y wave or the super cycle 3-3-3-2-Z-Z wave does not make a new low,
Fill the gap of 3186, with targets of 3138.53-3171.19-3184.62.
(6) If the super cycle 3-3-3-2-Z-Y wave or the super cycle 3-3-3-2-Z-Z wave makes a new low,
The ideal target is 3019 (double zigzag corrective wave).
The worst-case scenario is a triple zigzag corrective wave (2866-3019).
(7) After the end of the super cycle 3-3-3-2-Z wave, it will be followed by the super cycle 3-3-3-3 wave.
This is the main wave of the bull market.
(8) The 4-hour supportive state, the violent and supportive balance line is at 3358.1822.
<2> Version B (Super Cycle 3-3-3-2-B Wave)
(1) The overall super cycle 3-3-3-2 wave is a more complex corrective wave of the WXY structure.
Among them, the super cycle 3-3-3-2-W wave has ended at 3040.78 on April 7, 2025.
The internal structure is a WXYXZ corrective wave.
The super cycle 3-3-3-2-X wave has not yet ended since 3040.78.
After the end of the super cycle 3-3-3-2-X wave, there is still the super cycle 3-3-3-2-Y wave.
(2) The super cycle 3-3-3-2-X wave is divided into three ascending segments.
The internal structure of the first segment is a double zigzag corrective wave or even a triple zigzag corrective wave.
If it breaks through 3417.31 and excludes the B rebound, then it can be denied.
Assumptions of Version A [Shanghai Composite Index Wave Analysis - Version A 20250616].
(3) Assume the second segment endpoint of the 3-3-3-2-X wave is 3332.55 on May 27, 2025.
Then it is currently in the third segment of the rise.
From July 2 to July 6 (the last day of the 90-day tariff suspension), it rises to the final target of 3565.25.
Then the super cycle 3-3-3-2-Y wave starts from 3565.25.
Drop to 3063-3177.75-3186 (fill the gap) or 3296-3240.
The time node is in August or September.
After the end of the super cycle 3-3-3-2-Y wave, it will be followed by the super cycle 3-3-3-3 wave.
The main rising wave of the bull market, with the time node in September!
(4) Assuming that the first segment of the 3-3-3-2-X wave has not yet ended.
Then the first segment is a triple zigzag corrective wave.
It needs to rise to 3418-3443.18-3470.
Then it will end the first segment.
5. How to learn technical analysis and copy assignments?
Recently, my control over the details has been incredibly precise! Why can I repeatedly boast about my success? You can read my original articles (sharing my predictions of the peak on May 23, the second peak on June 2, the bottom on June 6 at 100718, the peak on June 11, and the plunge on June 17! Remember to copy assignments!) Study well, and you can boast with others too!
Finally, I suggest everyone study well the [a high-win-rate trading model], [wave theory], [Chen theory], [Gann theory], [Wyckoff trading method], and other theories I emphasized in the figure, so that your boasting ability will be even higher!

For those doing ultra-short lines, please consciously read my excellent tutorial articles on self-media (a high-win-rate left-side spot trading model (part 1)).

To forge iron, one must be strong; only by improving one's cognition can one successfully navigate through bull and bear markets. We emphasize knowledge sharing, cultivating independent thinking, learning and accumulating during bear markets, and allowing oneself to become someone else's dream in bull markets. We welcome like-minded individuals who agree with the values of the white paper community, are willing to learn, and cultivate independent thinking ability; only when you transform this knowledge and skills into your own accumulation can you possess the ability to think independently and avoid becoming a green leek!$BTC