I started trading cryptocurrencies in early 2015 and have accumulated over 30 million in profits over the years.
As a veteran in the cryptocurrency space, I've unknowingly traded for 10 years, and surviving in this market is truly not easy! I've been burned by market manipulators and have experienced many liquidations. Today, I will share a summary of my years of trading experience for free, hoping it can help everyone!
Here are the indicators I commonly use; I do not rely on just one but look at all in combination!
1. Trend Judgment Indicators
Moving Average (MA)
Definition: A curve formed by calculating the average price over a specified period, commonly using 5-day, 10-day, and 50-day moving averages.
Buy and Sell Signals:
✅ Golden Cross: Short-term moving average crosses above long-term moving average (e.g., MA5 > MA20), buy signal
❌ Death Cross: Short-term moving average crosses below long-term moving average, sell signal
Practical Example: BTC opened a major rally after breaking MA50 in March 2025, soaring 58% in a single month.
MACD Indicator
Composition: Consists of DIFF line (fast line), DEA line (slow line), and histogram
Key Signals:
✅ Golden Cross: DIFF line crosses above DEA line (bull market activation signal)
❌ Death Cross: DIFF line crosses below DEA line (bear market warning signal)
Case: When ETH broke a new high in April 2025, MACD formed a golden cross, and it subsequently rose over 40% in the next 7 days.
2. Overbought and Oversold Indicators
Relative Strength Index (RSI)
Definition: Volatility within a range of 0-100, measuring the speed of price changes
Operational Rules:
Overbought Zone (RSI > 70): Take profits in batches, beware of pullbacks
Oversold Zone (RSI < 30): Buy low, position for rebounds
Case: SOL rebounded 32% after RSI dropped to 25 on May 2025
KDJ Indicator
Three Lines Composition: K Line (sensitive), D Line (mid-term), J Line (extreme volatility)
Buy and Sell Points:
✅ J Line Bottoming (<0): Short-term buy signal
❌ J Line Topping (>100): Short position hedging signal
Practical Example: DOGE experienced a single-day drop of over 15% after multiple J line overbought signals
3. Volatility Indicators
Bollinger Bands (BOLL)
Three Bands Composition: Upper Band (Resistance), Middle Band (Trend), Lower Band (Support)
Trading Strategy:
✅ Opening Expansion: Price breaks through the upper band, chase the rise (e.g., BTC breaking $110,000)
❌ Constricted Oscillation: Price close to the middle band, mainly observe
Case: After the Bollinger Bands of APE narrowed in May 2025, it exploded with a single-day volatility of 68%.
Average True Range (ATR)
Function: Quantify market volatility intensity, assist in setting stop-loss
Formula: Stop-Loss = Opening Price ± (1.5 × ATR)
Application: When BTC's intraday ATR = $1500, the stop-loss should be ≥ $2250
4. Volume Indicators
Trading Volume (Volume)
Core Principle: Uptrends need increased volume, while downtrends with decreased volume indicate a reversal
Divergence Signals:
❗ Price Rise with Decreased Volume: Bullish exhaustion, beware of peak (e.g., LTC's trend in April 2025)
❗ Price Drop with Increased Volume: Strong bearish trend, timely stop-loss
Funding Rate Arbitrage
Strategy: Short when the funding rate is positive, long when negative, to profit from the rate difference
Tools: Automated monitoring platforms like XBIT can achieve annualized arbitrage returns of up to 35%
Five Essential Killer Combinations
MA + BOLL Dual Resonance: Enter a large long position when the price simultaneously breaks through MA50 and the upper Bollinger Band
RSI + MACD Divergence: New price highs but no new highs in MACD, open short when RSI > 80
ATR Dynamic Stop-Loss: Adjust stop-loss levels based on volatility to avoid being washed out
KDJ Super Short-term Target: Go long when J line <0 in conjunction with 1-minute candlestick, take profit at 3%
Whale Address Monitoring: Track Smart Money on-chain transfers, plan ahead for copying trades


Proven method, turned 500k into 10 million just by learning to read 16 candlesticks and accurately determine buy and sell points! Win rate of 99%, suitable for everyone!
Candlestick Body
The candlestick body represents the opening and closing prices of the asset. The position of the opening or closing price depends on the candlestick and whether the price is bullish or bearish during a specific time period. In a bullish market, the closing price will be higher than the opening price, while in a bearish market, the opposite is true.
Candlestick Wicks
Each candlestick usually has two so-called wicks, although this is not a definitive rule. The wicks represent the highest and lowest prices during a specific time period. The upper wick represents the highest value, while the lower wick indicates the lowest price reached. Sometimes a candlestick has only one wick, occurring when the other wick coincides with the opening or closing price, aligning with the body at the same level.
Candlestick colors
The color of the body indicates the direction of price movement. Generally, green (or white) bodies indicate price increases, while red (or black) bodies indicate price decreases. Most platforms display bodies in green or red. Therefore, if the body is green, the highest point of the body will represent the closing price.
How do candlesticks work in trading?
So far, candlestick charts are the most comprehensive graphical representation of asset prices. Cryptocurrency traders borrowed this type of chart from stock and forex trading. Unlike line charts that only show closing prices, candlestick charts provide a wealth of historical price-related information due to their structural characteristics (as mentioned above).
Candlesticks form sequentially over time, and even without using technical indicators, they can help you understand the overall trend as well as resistance and support levels. Additionally, specific patterns formed by candlesticks can serve as buy or sell signals. The use of candlestick charts is particularly important in cryptocurrency trading due to the high volatility of this type of trading, necessitating detailed technical analysis.
16 Popular Candlestick Patterns
There are many types of candlestick patterns, and we will introduce the most popular and reliable ones in this article, starting with bullish patterns that appear after a downtrend and indicate an imminent upward reversal. Cryptocurrency traders typically open long positions when these patterns appear.
1. Hammer

The Hammer candlestick consists of a shorter body and a long lower wick. This shape is referred to as a hammer because it resembles an upright hammer. Generally, the hammer pattern appears at the bottom of a downtrend. This formation indicates that buyers have resisted selling pressure during this period and have pushed prices higher. The hammer can be either green or red, but green hammers indicate a stronger bullish trend compared to red ones.
2. Inverted Hammer

The Inverted Hammer is similar to the standard hammer shape, but its upper wick is much longer, while the lower wick is very short. This pattern indicates buying pressure, with sellers trying to push prices lower but failing. As a result, buyers return with stronger pressure, pushing prices higher.
3. Bullish Engulfing

Unlike the previous two patterns, the Bullish Engulfing pattern consists of two candlesticks. The first candlestick should be a short red body, engulfed by a larger green candlestick. The opening price of the second candlestick is lower than the previous red candlestick, indicating increased buying pressure that leads to a reversal of the downtrend.
4. Piercing Pattern

Another double candlestick pattern is the Piercing pattern, which can appear at the bottom of a downtrend at a support level or during a pullback when a bullish trend is anticipated. This pattern consists of a long red candlestick followed by a long green candlestick. The key to this pattern is that there is a significant gap between the closing price of the red candlestick and the opening price of the green candlestick. The closing price of the green candlestick is much higher than its opening price, indicating buying pressure.
5. Morning Star

The Morning Star pattern is more complex, consisting of three candlesticks: a long red candlestick followed by a short-bodied candlestick and a long green candlestick. The Morning Star pattern indicates that selling pressure from the first period is weakening, and a bullish trend is forming.
6. Three White Soldiers

Another pattern consisting of three candlesticks is the Three White Soldiers. This pattern consists of three long green candlesticks, usually with short wicks. The main condition is that there are three consecutive green candlesticks, and the opening and closing prices must be higher than the previous period. This pattern is considered a strong bullish signal following a downtrend.
Next, we will discuss a set of bearish patterns that are expected to indicate a reversal of upward trends, usually appearing in resistance zones. These patterns often prompt traders to close long positions or open short positions.
7. Hanging Man

The Hanging Man is a candlestick with a very short body and long wicks, which can be green or red. It usually appears at the end of an uptrend, indicating a potential upcoming sell-off, but sellers may temporarily push prices higher before losing control.
8. Shooting Star
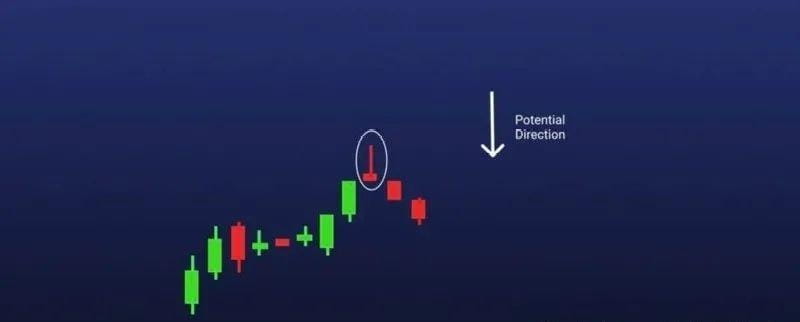
The Shooting Star is the opposite of the Inverted Hammer. This pattern consists of a short body and a long upper wick, typically indicating that the market jumps high at the opening of the candlestick and spikes to a local high, closing just slightly below the opening price. Sometimes the body is almost non-existent.
9. Bearish Engulfing

The Bearish Engulfing pattern is the reverse version of the Bullish Engulfing, where the first green candlestick is small and completely engulfed by the following long red candlestick. This pattern appears at the peak of an uptrend, indicating a reversal. The lower the closing price of the second candlestick, the greater the bearish momentum.
10. Evening Star

The Evening Star represents a specific three-candlestick pattern. It consists of a short-bodied candlestick in the middle, flanked by longer green candlesticks on both sides and a larger red candlestick; the closing price of the third candlestick is below the midpoint of the first green candlestick. This pattern typically appears at the top of an uptrend, indicating a potential reversal.
11. Three Crows

The Three Crows pattern consists of three long red candlesticks with short or almost non-existent wicks. The opening price of each new candlestick is roughly the same as the previous candlestick's price, but each closing price drops significantly. This is a strong bearish signal.
12. Dark Cloud Cover

The Dark Cloud Cover pattern is similar to the Piercing Line, but it is the opposite. This pattern indicates a bearish reversal and consists of two candlesticks, where the red candlestick's opening price is higher than the previous green candlestick's body, and the closing price is below the midpoint. This pattern suggests that sellers have taken control of the market, pushing prices down. If the wicks of the candlestick are short, traders can expect a strong downward trend.
In addition to bullish and bearish patterns that predict trend reversals, there are also neutral candlestick patterns that suggest continued bullish or bearish trends.
These include: Doji, Spinning Top, Three Methods of Decline, Three Methods of Rise
13. Doji

The Doji candlestick has a very small body with long wicks. This pattern is usually seen as a continuation of a trend, but traders should also be cautious, as it may also indicate a reversal. To avoid confusion, wait for a few candlesticks to form after the Doji appears before opening a position.
14. Spinning Top

Similar to the Doji, the Spinning Top also has a short body candlestick. However, this pattern has wicks of equal length on both ends of the body. This pattern also indicates a consolidation situation and may suggest that prices are correcting or consolidating after a significant rise or drop.
15. Three Methods of Decline

The Three Methods of Decline is a pattern formed by five candlesticks arranged in a specific way, indicating the continuation of a downtrend. This pattern consists of two longer red bodies on each end and three smaller green bodies in the middle. The green candlestick bodies are fully covered by the bearish red bodies, indicating that buyers do not have enough strength to reverse the downtrend.
16. Three Methods of Rise

The Three Methods of Rise pattern is the opposite of the previous pattern, usually appearing in an uptrend. This pattern consists of two longer green bodies on each end and three smaller red bodies in the middle.
How to Read Candlestick Charts
Candlestick charts contain a wealth of historical data and other information, making them easy to read with practice. In addition to the candlestick patterns discussed above, many other candlestick charts are formed by specific arrangements, such as double tops and double bottoms, flags and triangle flags, etc.
Even novice or experienced traders can understand candlestick charts by visually assessing the overall trend. This visual information often provides ample insight, helping traders identify specific patterns within candlesticks, especially at resistance and support levels.
Common Terms in Candlestick Charts
The following are relevant terms for candlestick charts for your reference during trading:
Forming Patterns - Patterns that are not yet fully formed but show initial signs
Formed Patterns - Completed patterns that can be viewed as bullish or bearish signals
Opening Price - The opening price of the candlestick
Closing Price - The closing price of the candlestick
Highest Price - The highest price covered by the candlestick during the period
Lowest Price - The lowest price covered by the candlestick during the period
Advantages of using candlestick patterns
Candlestick patterns help cryptocurrency traders gain a clearer understanding of potential future trends. In other words, candlestick patterns serve as signals, helping traders decide when to open long or short positions, and when to enter or exit the market. For instance, swing traders view candlestick charts as swing trading indicators to determine reversal and continuation trading patterns.
Candlestick charts and their patterns can help traders identify trends, understand momentum, and keep a close watch on current market sentiment.
Mnemonic for candlestick patterns
If you want to quickly identify candlestick patterns, traders need to observe the chart and use small amounts of capital to become familiar with candlesticks. A good starting point is to focus on learning single candlestick patterns and carefully analyze the patterns formed by two candlesticks.
It is best to start with one pattern until you are confident in easily identifying it during price fluctuations.
Have you been trading cryptocurrencies for over a year without making a million? After reading these 10 key points, you may understand why!
If you have been trading in the cryptocurrency world for over a year but your account balance still hasn't reached the expected 1 million, then this article may provide you with some insights.
1. Small Capital, Capture Major Rallies
If your capital is not large (e.g., under 100,000), capturing just one major rally each year is enough. Do not always be fully invested; keep enough cash to respond to unexpected situations. There are always opportunities in the market, but once the principal is lost, the opportunities will no longer belong to you.
2. Cognition Determines Wealth
A person can never earn money beyond their cognition. A demo account is a good tool for practicing mindset and strategies, but it cannot fully simulate the emotional fluctuations of the real market. In live trading, each failure can bring significant psychological pressure, even leading to a complete exit from the market. Therefore, start with a small amount of capital and gradually enhance your knowledge and abilities.
3. Take profits decisively when good news is realized
When encountering significant positive news, if there are no sales on that day, one must decisively sell on the next day's high opening. The market often experiences selling pressure after positive news is realized, which is an ironclad rule for short-term trading. Do not be greedy; take profits.
4. Reduce positions during holidays to avoid risks
When encountering significant holidays, reduce positions or go short a week in advance. Historical data shows that market liquidity decreases during holidays, making it prone to significant fluctuations or declines. Avoiding uncertainty is a wise choice.
5. Medium to Long-term Investment, Rolling Operations
The core of medium to long-term investment is to keep enough cash on hand, gradually selling off during market rallies and buying back in batches during sell-offs. Rolling operations can reduce holding costs while maintaining flexibility.
6. Short-term trading, choose active coins
The key to short-term trading is selecting active coins; those with increased volume and volatile prices are more likely to provide trading opportunities. Avoid inactive coins, as poor liquidity can lead to trading difficulties or even being trapped.
7. Understand market rhythm
A slow decline is usually accompanied by a slow rebound, while a rapid decline triggers a rapid rebound. Understanding this can better grasp the timing for bottom fishing and peak selling.
8. Stop-loss is the foundation of survival
If you buy wrong, admit it and stop-loss timely. The market always has opportunities; preserving your principal is the prerequisite for long-term profits.
9. Focus on the 15-minute candlestick chart
Short-term traders must pay attention to the 15-minute candlestick chart, using it in conjunction with the KDJ indicator to find buy and sell points. The signals in the overbought and oversold zones of the KDJ indicator are particularly important, but it is essential to combine them with other indicators (such as MACD, RSI).
10. Master a few techniques, do not be greedy
There are countless techniques and methods for trading cryptocurrencies, but you only need to master a few. Don't bite off more than you can chew; focus on the techniques and strategies you are familiar with to navigate the market with ease.
The cryptocurrency world is a place full of opportunities but also requires wisdom and patience. I hope these 10 key points can help you find your own path to wealth in the cryptocurrency space.