Special Reminder:
✅ The number of ETH holders between 10,000 to 100,000 continues to accelerate in growth.
✅ Large whale wallet addresses remain active.
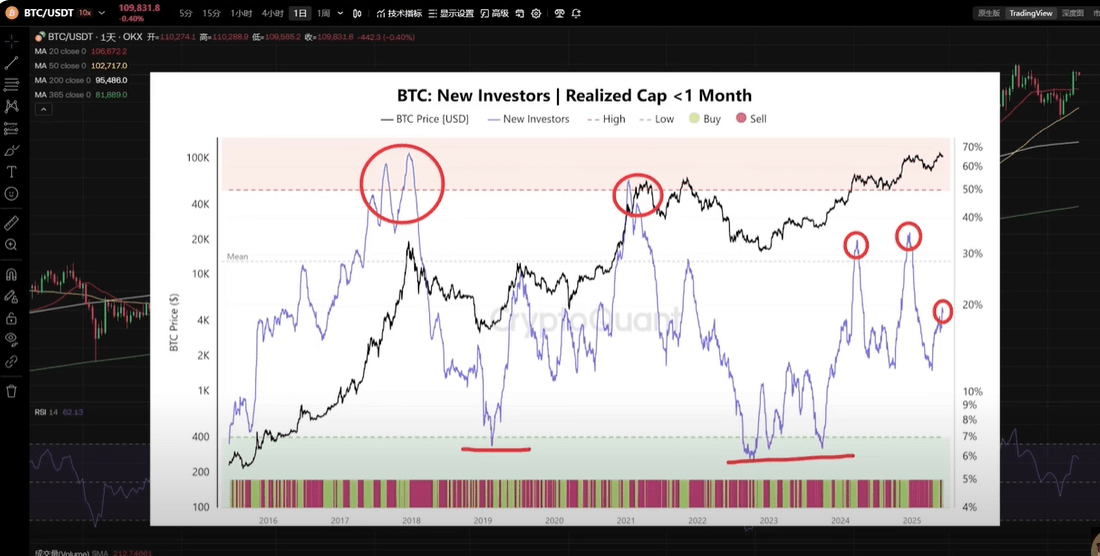
✅ The proportion of short-term holders holding BTC for less than 1 month continues to increase, accounting for 20%. Attention to risk is needed when it reaches 50%.
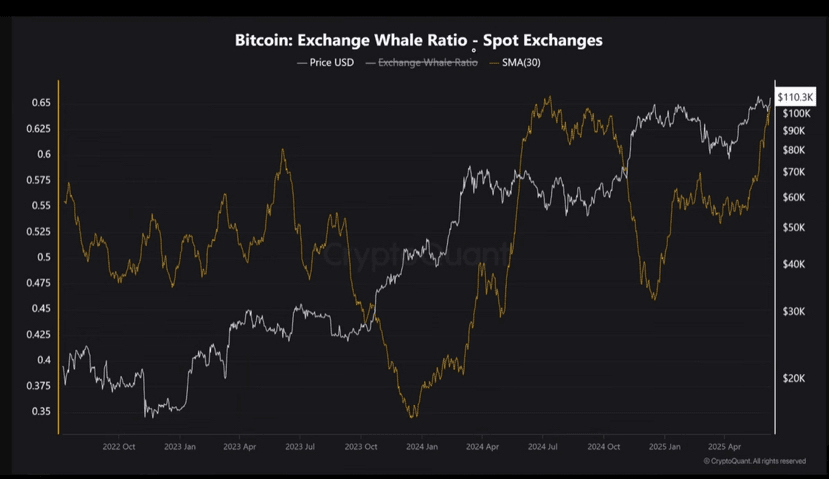
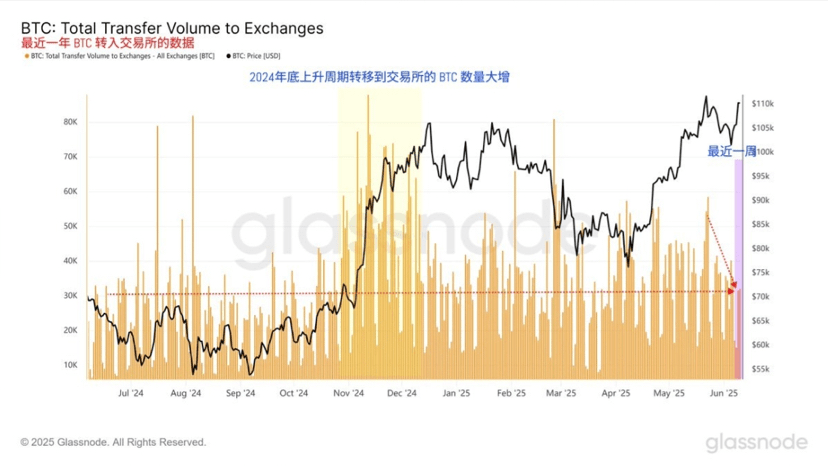
✅ The trend of BTC deposits from whales to Binance exchange is decreasing.
✅ The proportion of short-term holders of Bitcoin continues to decrease, while the proportion of long-term holders continues to increase.
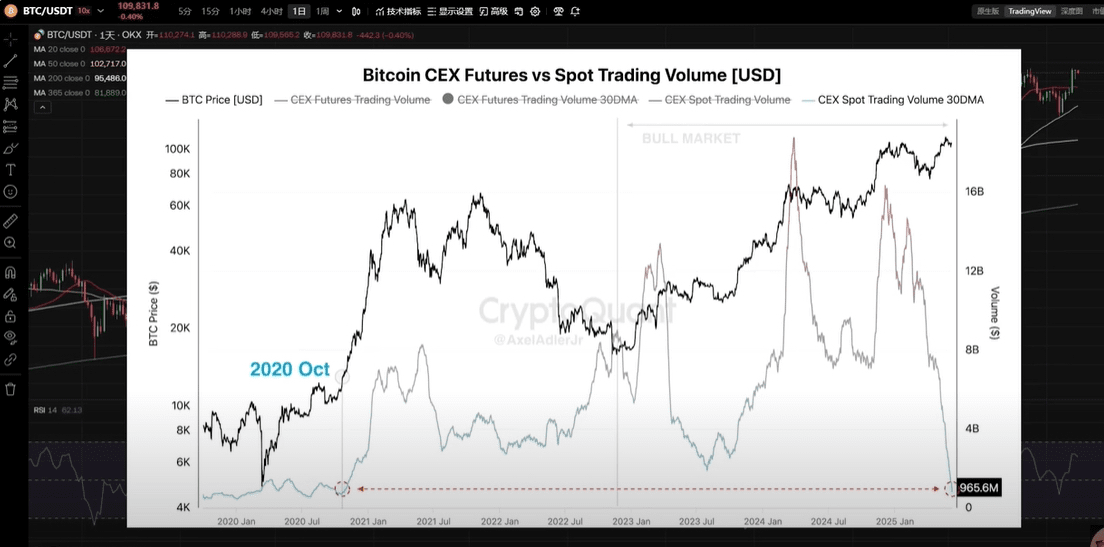
✅ The trading value of Bitcoin spot has decreased to the lowest level since October 2021.
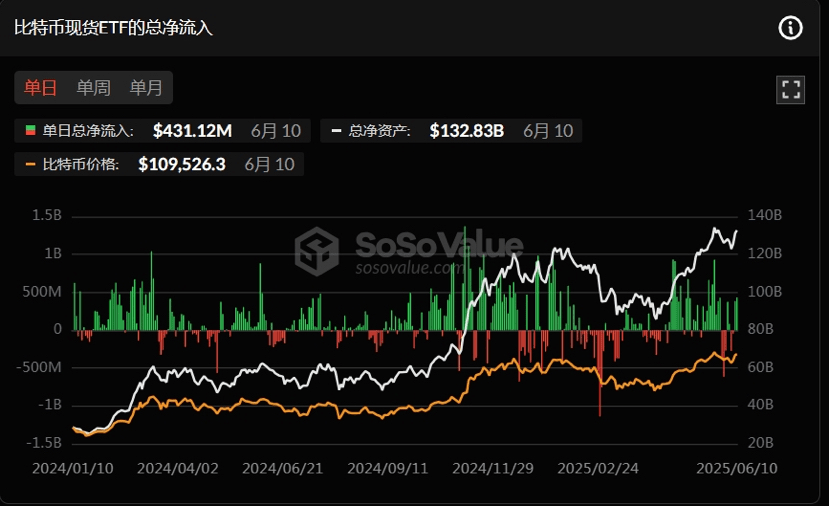
✅ The total net inflow of Bitcoin spot ETF Daily total net inflow: $431.12M
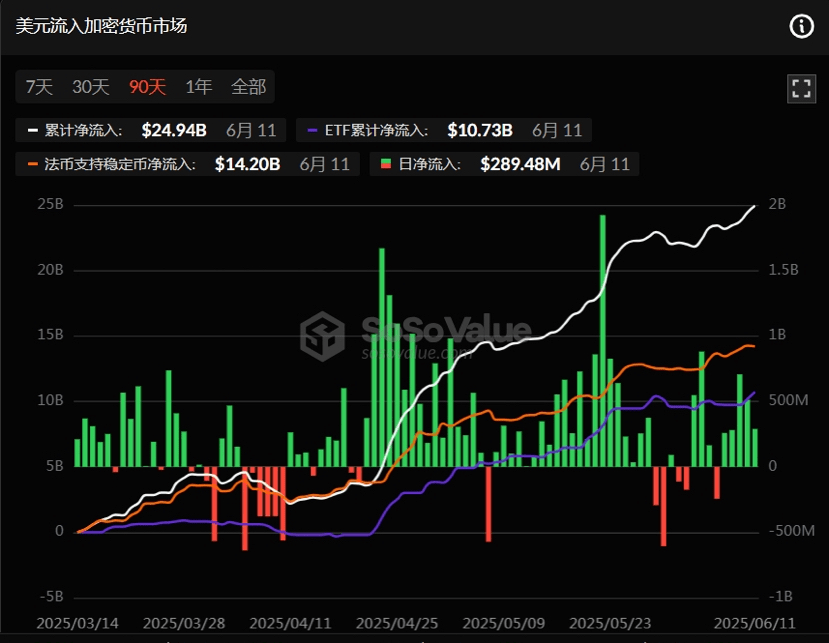
✅ USD inflow into the cryptocurrency market Daily net inflow: $289.48M
✅ In the past 24 hours, the total liquidation across the network was $355 million.
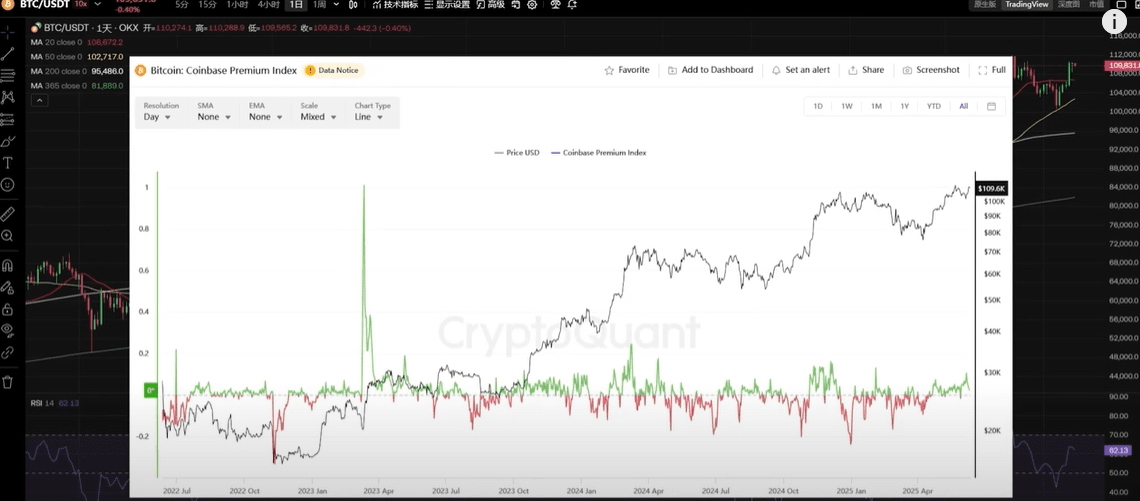
✅ Coinbase premium indicator remains positive, indicating strong demand from U.S. investors.
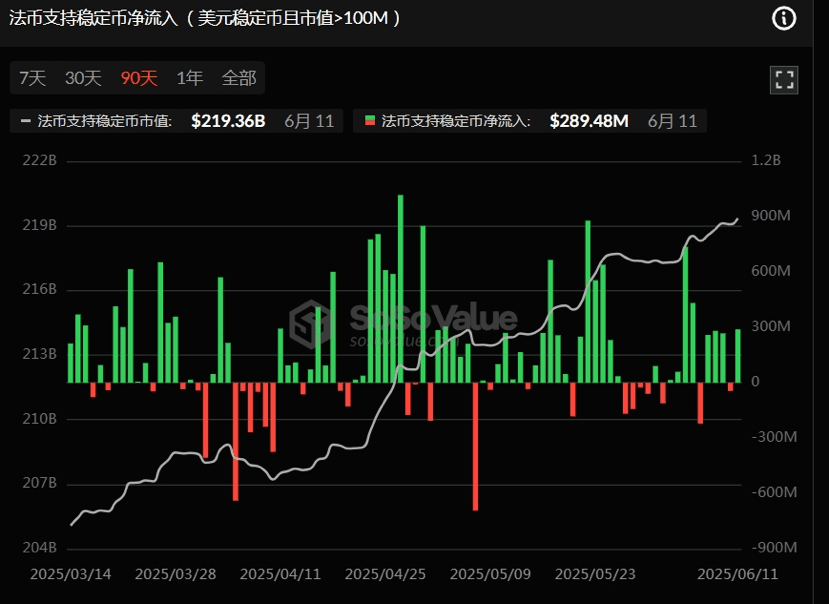
✅ Fiat-supported stablecoin net inflow (USD stablecoins with market cap > 100M) Fiat-supported stablecoin net inflow: $289.48M
✅ This Wednesday (today) and Thursday (tomorrow) will announce CPI and PPI data, and the current market expectations indicate a possible rise.
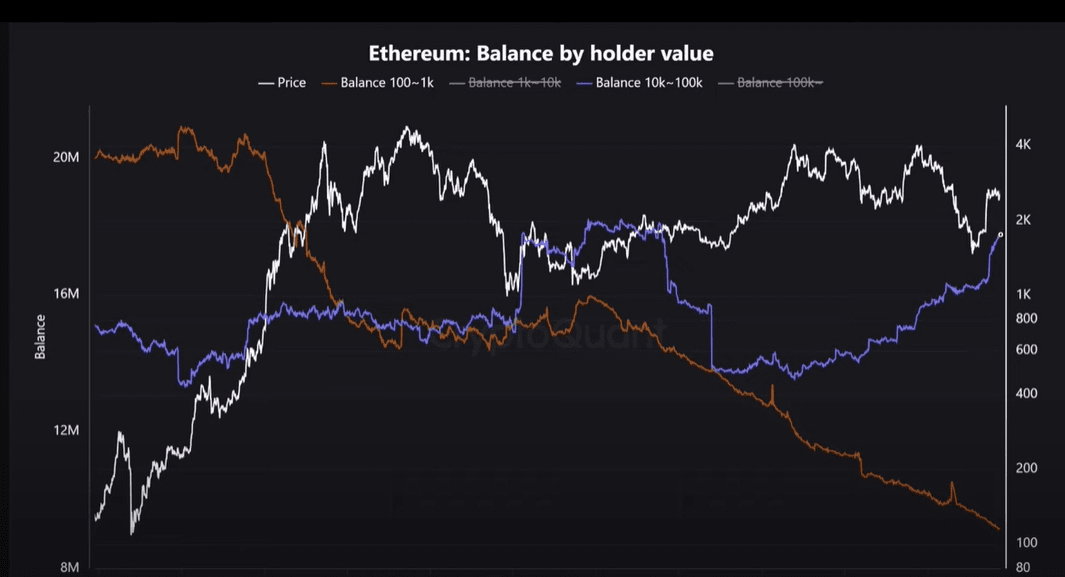
ETH 100-1000 & ETH 10,000-100,000 holder number changes ETH 10,000-100,000 holder number continues to increase.
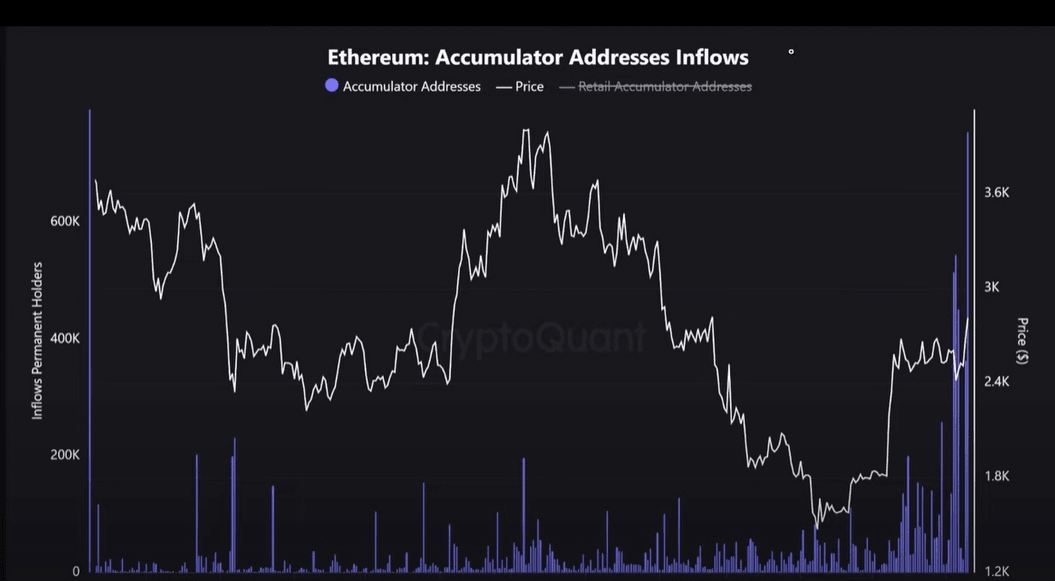
Short-term traders are experiencing a large-scale sell-off, while long-term holders are buying in large amounts.
The proportion of short-term holders holding BTC for less than 1 month continues to increase. 7% is the historical price bottom, and when it reaches 50%, the price is close to the top area, so attention to risk is needed.
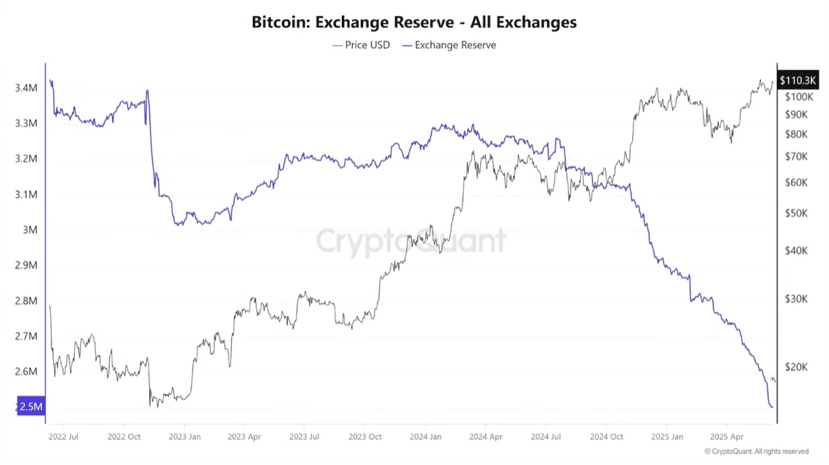
Exchange BTC inflow and outflow BTC from exchange stock continues to hit new lows, with many long-term investors withdrawing coins from the exchange.
The trading value of Bitcoin spot has decreased to the lowest level since October 2021, reflecting a market holding and wait-and-see state.
The trend of BTC inflows from whales to Binance exchange is decreasing.
Coinbase premium indicator remains positive, indicating strong demand from U.S. investors.
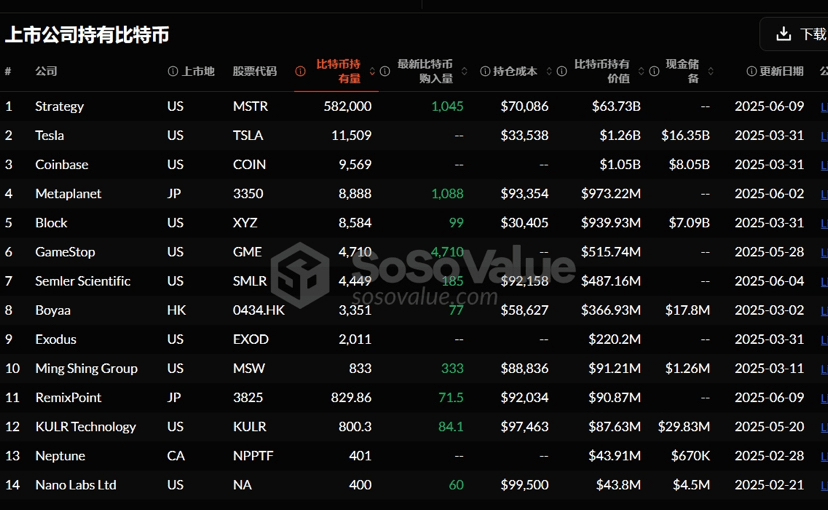
The holding situation of the 14 largest listed companies holding BTC globally.
** Interpretation of BTC inflow and outflow data
BTC inflow and outflow from exchange wallets are core on-chain indicators of the crypto market, directly reflecting the movement of major funds and market sentiment.
Inflow ↑ Holders are depositing BTC into exchanges, increasing selling pressure expectations, alerting for potential short-term declines.
Outflow ↓ Holders withdrawing BTC from exchanges, indicating increased willingness to hoard/lock up, suggesting a bullish outlook in the medium term.
1. Greed and Fear Index Today: 65 Greed Market has entered the greed phase.
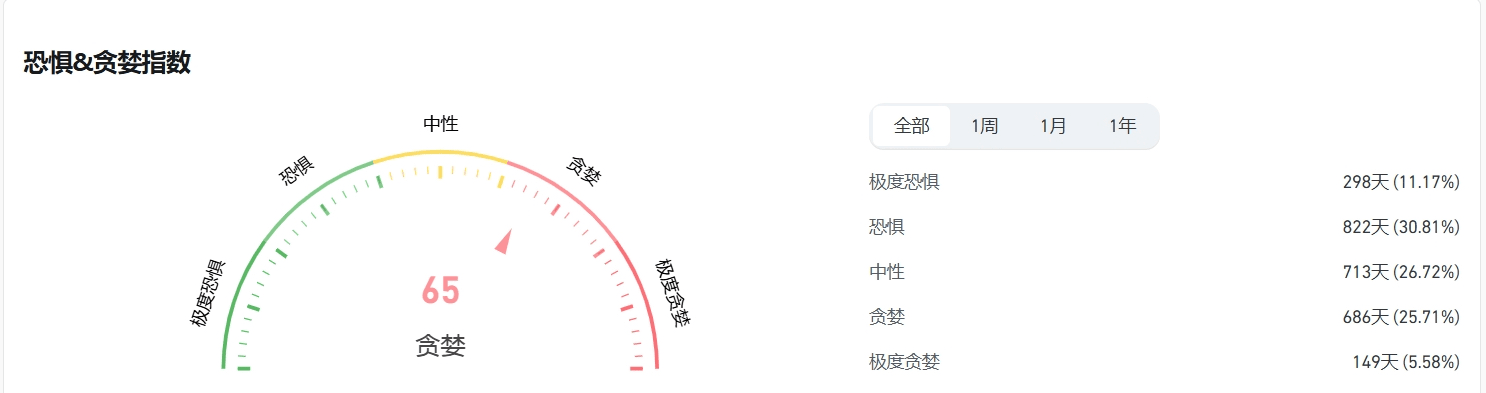
** Interpretation of the Greed and Panic/Greed Index
The behavior of the cryptocurrency market is highly emotional. When the market rises, people tend to be greedy and experience fear of missing out; when the market falls, they irrationally sell their cryptocurrencies.
By utilizing the Fear and Greed Index, we aim to help users eliminate emotional factors and avoid making irrational judgments.
There are two statuses:
Extreme fear indicates that investors are overly worried, which could be a buying opportunity.
Excessive greed indicates that investors are overly excited, and the market may undergo a correction.
2. Bitcoin's Total Market Share 62.43 has declined compared to yesterday.
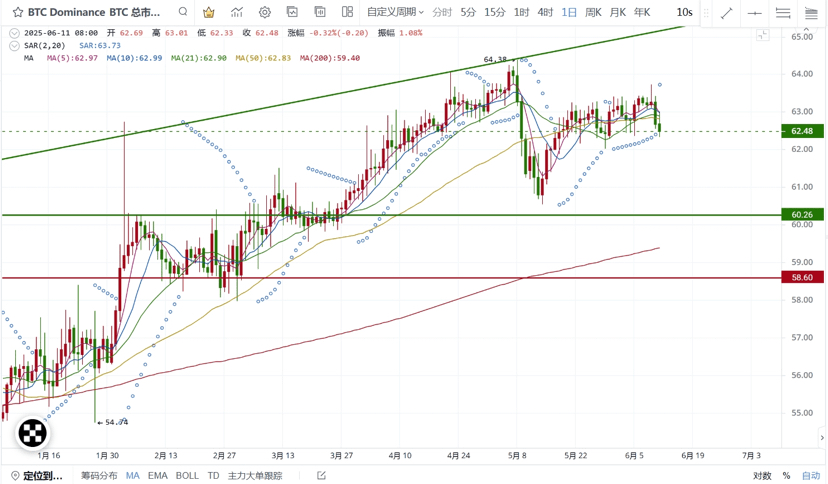
** Bitcoin's total market share is a core indicator of Bitcoin's relative influence in the entire cryptocurrency market. This indicator not only reflects Bitcoin's short-term market position but also reveals changes in fund rotation, investor sentiment, and macro trends.
Bitcoin market share is a 'weather vane' for judging market phases:
Early Bull Market: Market share rises, funds prioritize allocation to Bitcoin.
Late-stage bull market: Market share declines, funds rotate to altcoins, triggering an 'altcoin season'.
Market thermometer: >60% = Risk aversion dominant; <40% = Altcoin frenzy.
Fund Flow Chart: Reveals the allocation preferences of institutions and retail investors (Bitcoin → stable, altcoins → high risk and high return).
3. Bitcoin and Ethereum trading pair 0.25817 Ethereum to Bitcoin trading pair has significantly strengthened.
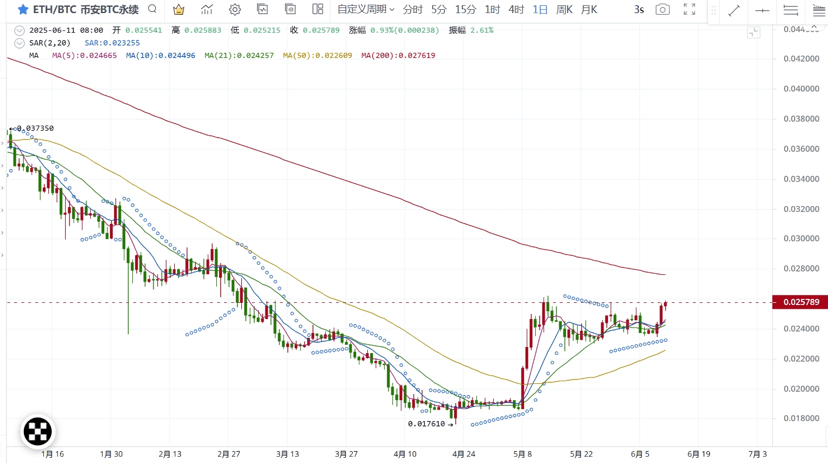
** Bitcoin/Ethereum trading pair is the 'risk thermometer' of the cryptocurrency market:
Ratio rises → Market prefers high-risk assets (signal for altcoin season to start);
Ratio declines → Funds are seeking refuge in Bitcoin (characteristics of bear or early bull market).
4. ETF inflow and outflow data ETF data maintains slight net inflow.
** Explanation of ETF inflow and outflow data: The inflow and outflow data of Bitcoin ETFs are core indicators for tracking institutional sentiment, market trends, and fund rotation.
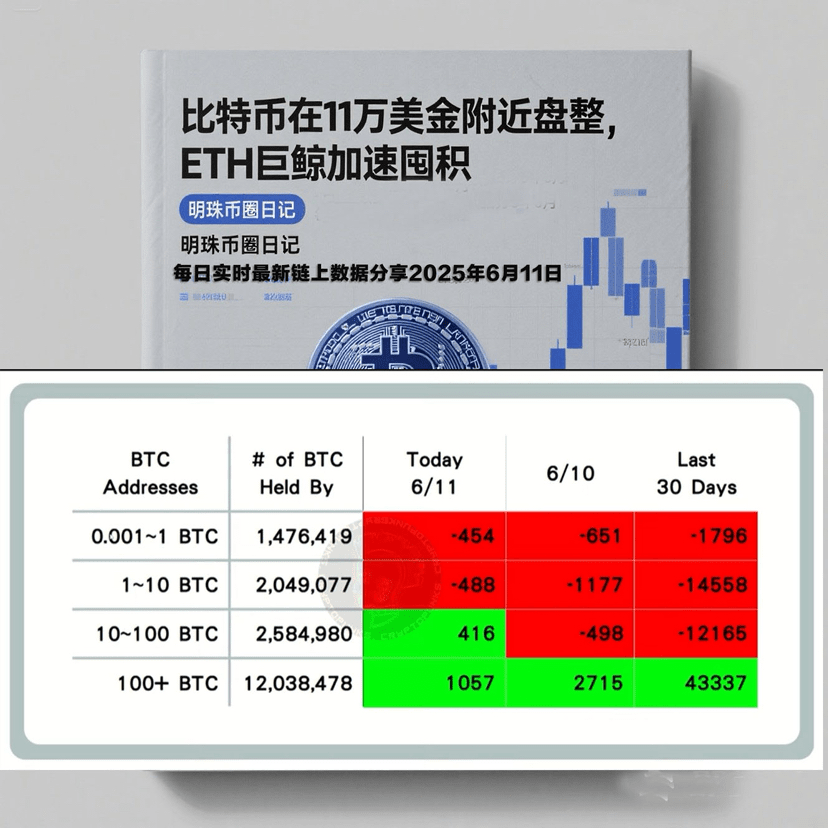
5. On-chain BTC retail, large holders, and institutional buy-sell data statistics Large whales continue to buy in large quantities.
Thanks to @TraderPunk for data organization and sharing.
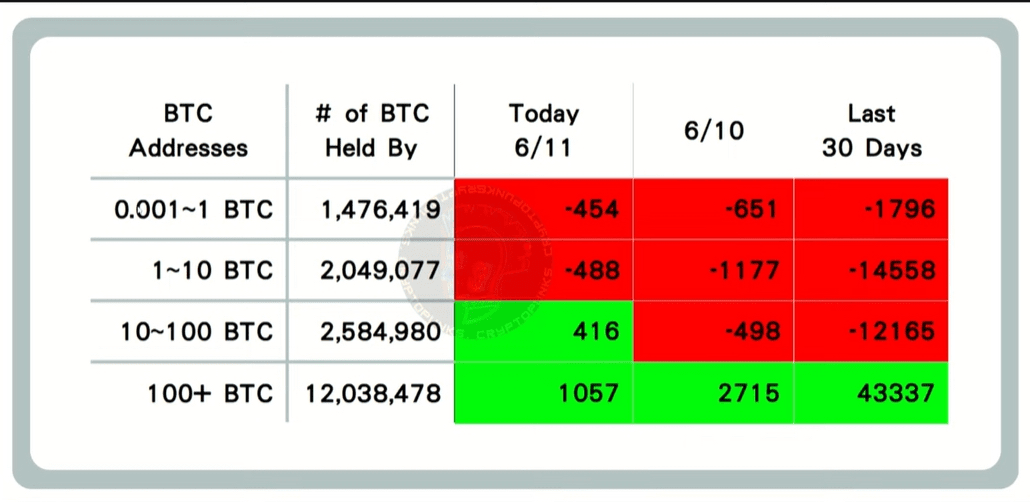
Data Description: Represents the increase and decrease of on-chain flows for ≤ 1 BTC, 1—10 BTC, 10—100 BTC, and 100+ BTC. This data can reflect a kind of market sentiment from retail investors, large holders, and institutions.
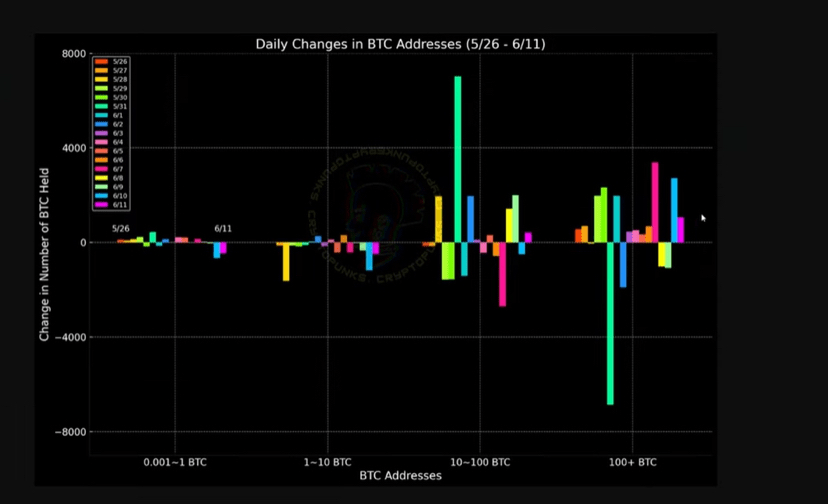
Data Description: This data reflects the increase and decrease of on-chain flows for ≤ 1 BTC, 1—10 BTC, 10—100 BTC, and 100+ BTC within a week. This data intuitively reflects the flow trends of BTC among market retail investors, large holders, and institutions.
When a certain extreme situation appears in on-chain data, a reversal often occurs (for example, if large whales holding more than 100 BTC show significant buying while others are selling, the probability of Bitcoin rising greatly increases; conversely, the probability of a decline greatly increases). It is also necessary to analyze in conjunction with other on-chain data and technical indicators.
6. MVRV Realized Market Value Ratio MVRV > 1
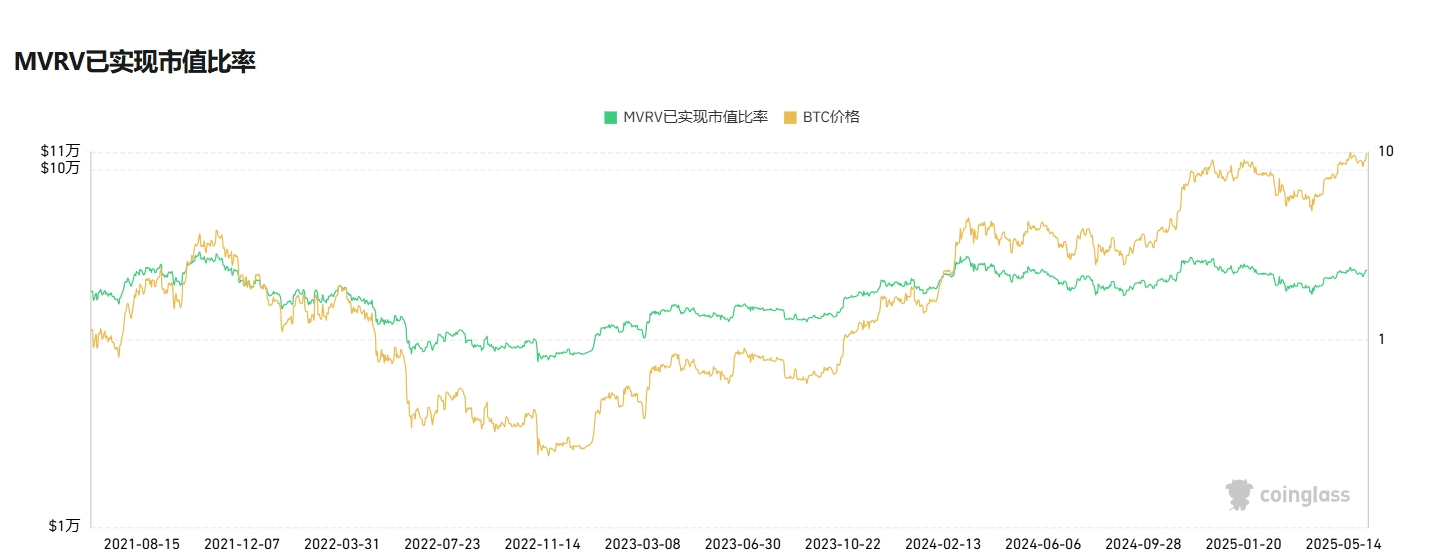
** MVRV Realized Market Value Ratio Indicator Explanation: The MVRV Realized Market Value Ratio is an indicator used to evaluate the cryptocurrency market (especially Bitcoin). This indicator can help users determine whether assets are overvalued or undervalued and identify potential market cycle tops and bottoms.
MVRV > 1
When the ratio is greater than 1, it indicates that the market price is above the realized price, meaning that most holders are in profit. This may indicate that the market is overheated, especially when MVRV reaches historical highs, which may suggest a market top.
MVRV < 1
When the ratio is less than 1, it indicates that the market price is below the realized price, meaning that most holders are at a loss. This may indicate that the market is undervalued, especially when MVRV reaches historical lows, which may suggest a market bottom.
7. Altcoin Season Index 24 Is it altcoin season: No, has rebounded compared to yesterday.
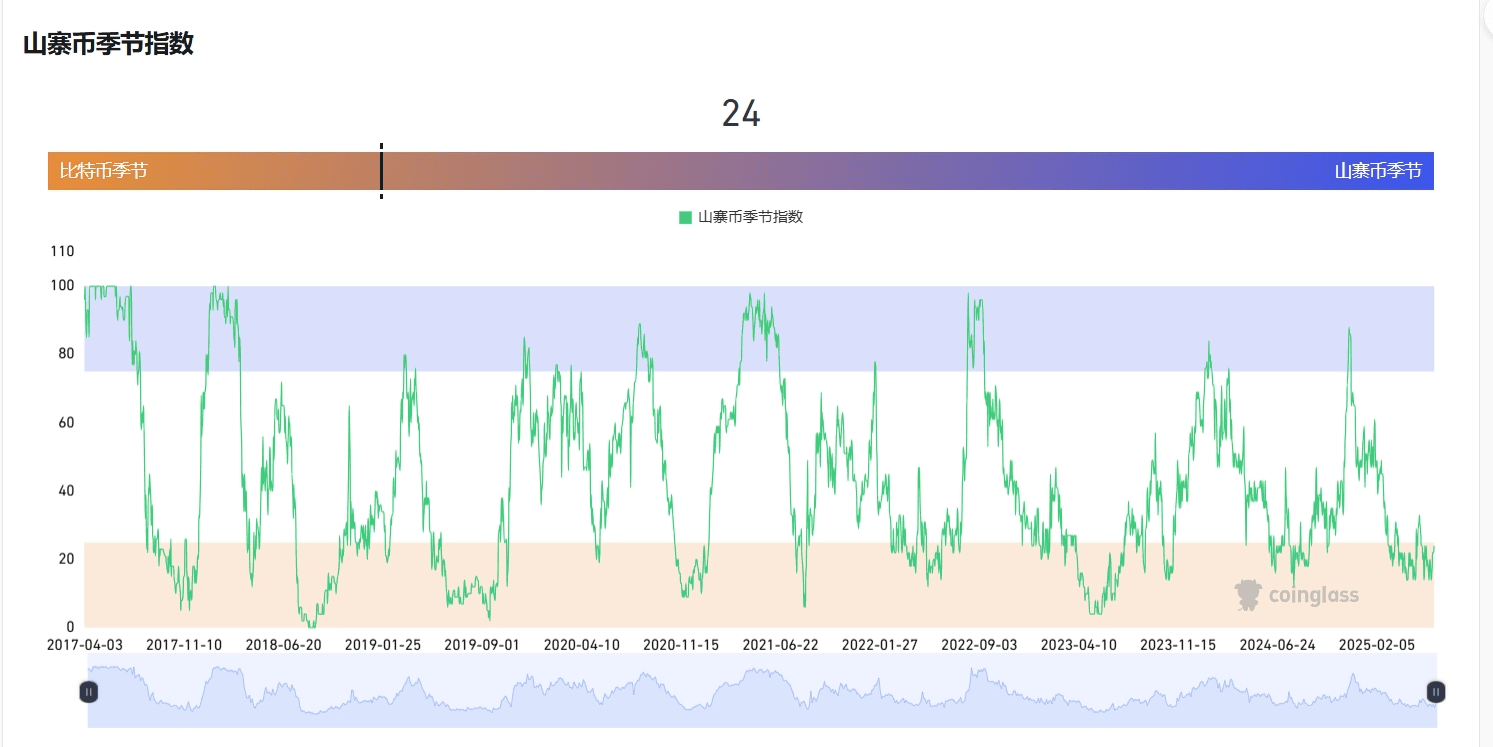
** Altcoin Season Index Explanation: The altcoin season index is an indicator used to measure the performance of non-Bitcoin cryptocurrencies in the market. It is typically used to determine whether altcoins are outperforming Bitcoin within a specific time frame, thus helping investors understand market trends and investment opportunities.
8. USD inflow into the cryptocurrency market Small inflow
9. Fiat-supported stablecoin net inflow (USD stablecoins with market cap > 100M) Small inflow.
The above data represents a perspective from on-chain data to predict BTC volatility trends and market sentiment, and does not constitute any investment advice. Please make careful decisions!!

I am Mingzhu, follow me for daily sharing of real-time on-chain data and trends to help users make informed decisions; don't miss the exciting content, and feel free to leave comments and discuss.