Special tips:
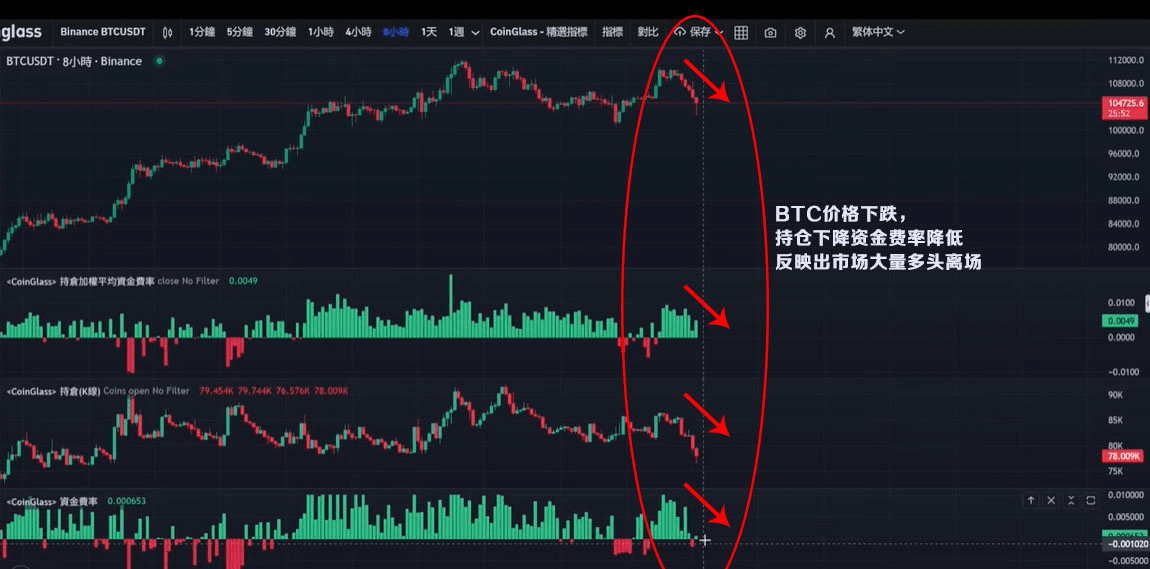
✅BTC price fell, positions decreased, and funding rates decreased, reflecting that a large number of long positions in the market left or were liquidated
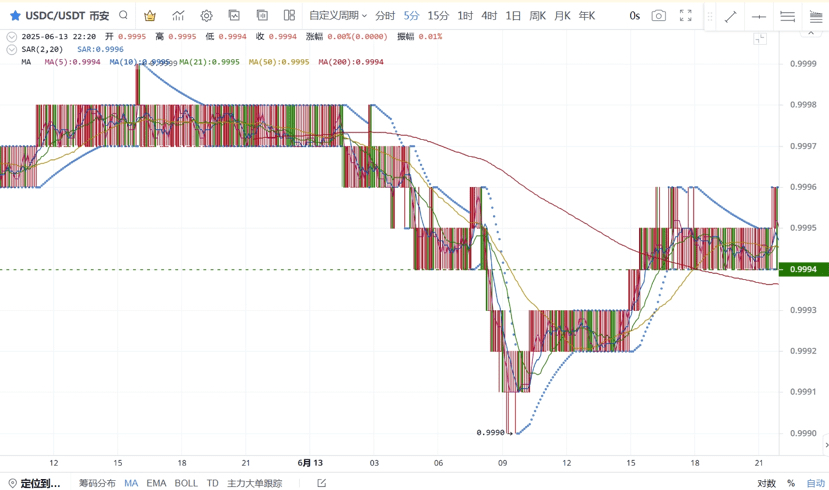
✅As BTC fell, the USDC/USDT trading pair followed BTC and fell sharply, reaching a recent low of 0.999. A large number of investors sold USDC in exchange for USDT to add margin to contracts.
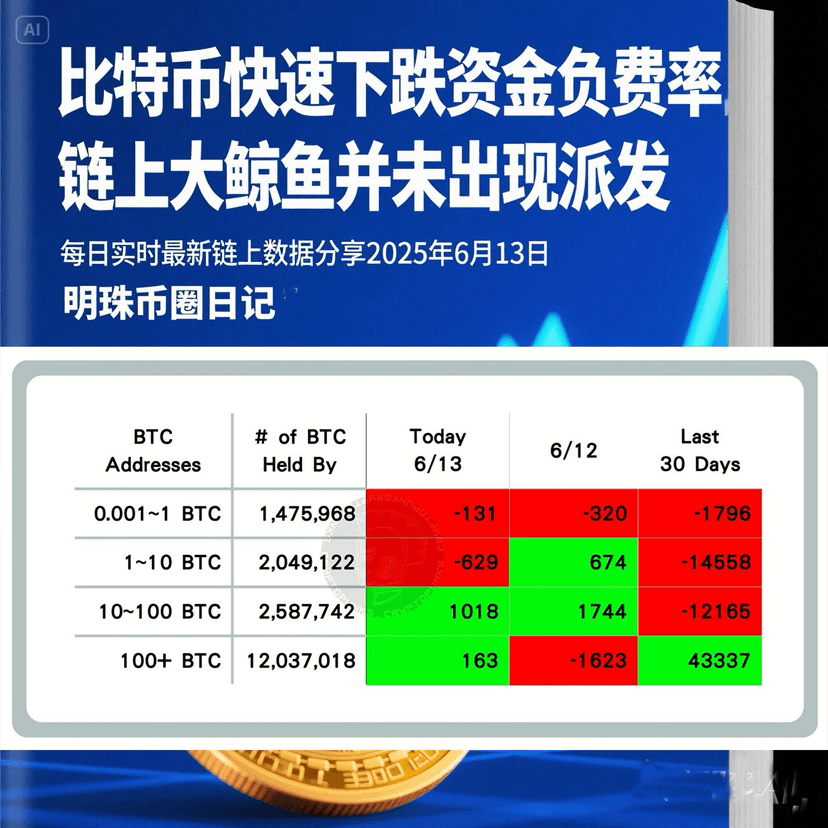
✅BTC100+ Big whales bought in small amounts, and no distribution occurred
✅Today's spot ETF data $BTC net flow: +$86.3 M $ETH net flow: +$112.3 million
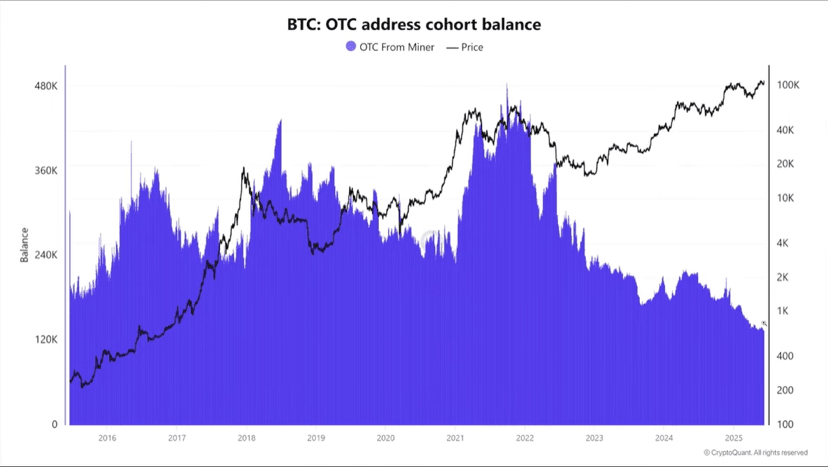
✅ The balance of Kuanggong OTC transactions has decreased significantly.
✅Binance’s funding rate has reached negative rate again
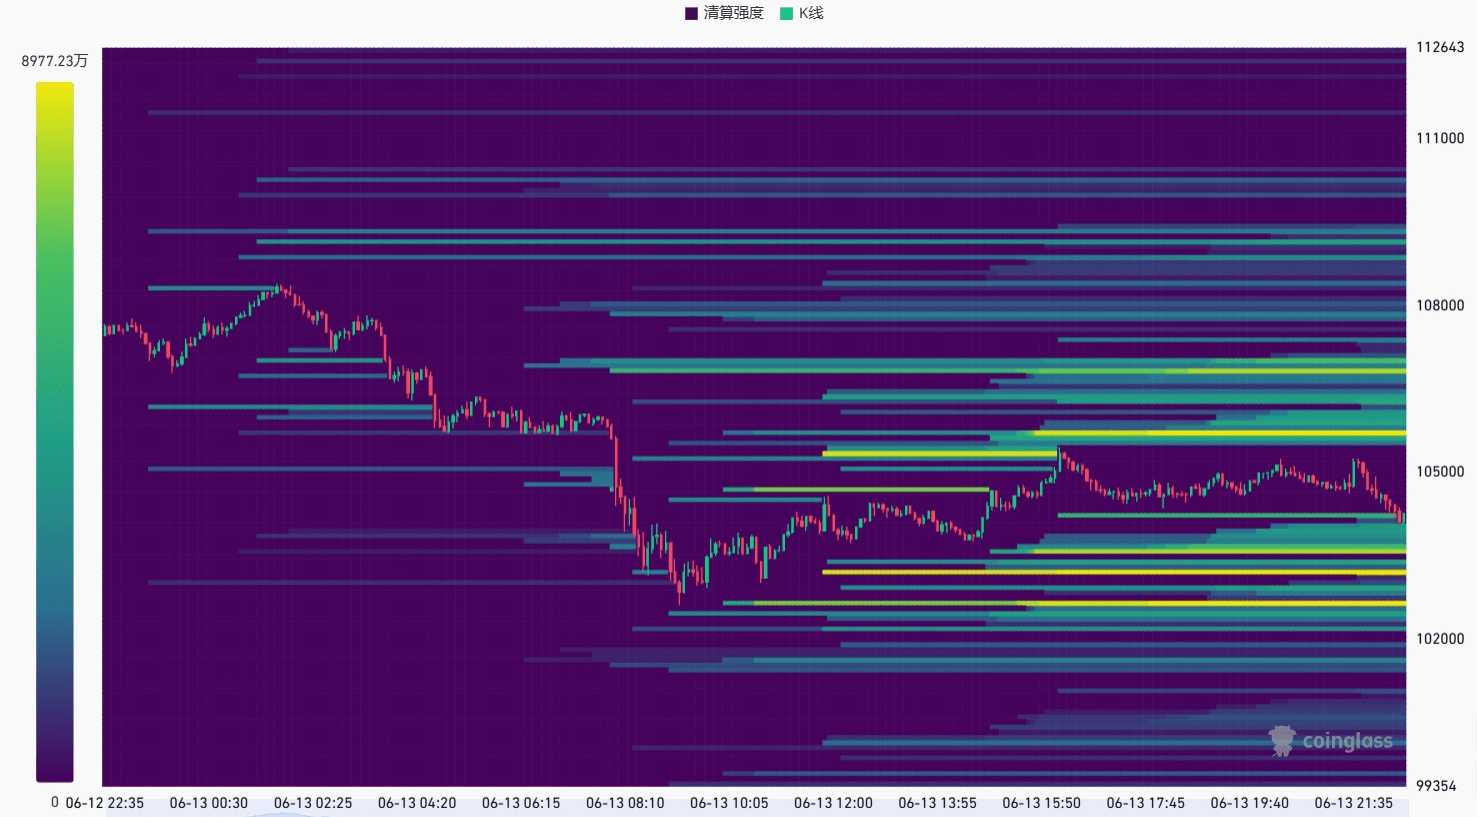
✅In the past 24 hours, the entire network has a liquidation of 1.159 billion US dollars, of which long orders have a liquidation of 1.035 billion US dollars and short orders have a liquidation of 124 million US dollars. The largest single liquidation value exceeded 200 million US dollars.
✅The inflow and outflow of BTC wallets on exchanges indicate that a large number of long-term investors have not panic-sold
✅The exchange's wallet balance still maintains its historical status
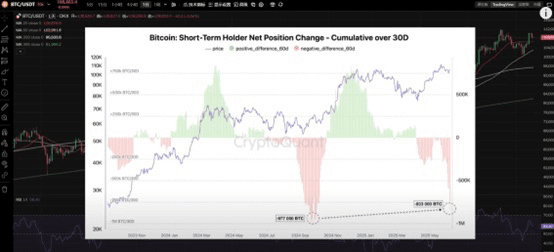
✅BTC short-term holders continue to decline and BTC long-term holders continue to increase
✅The number of BTC short-term holders is at a low level, and there is no high-level exchange with long-term holders
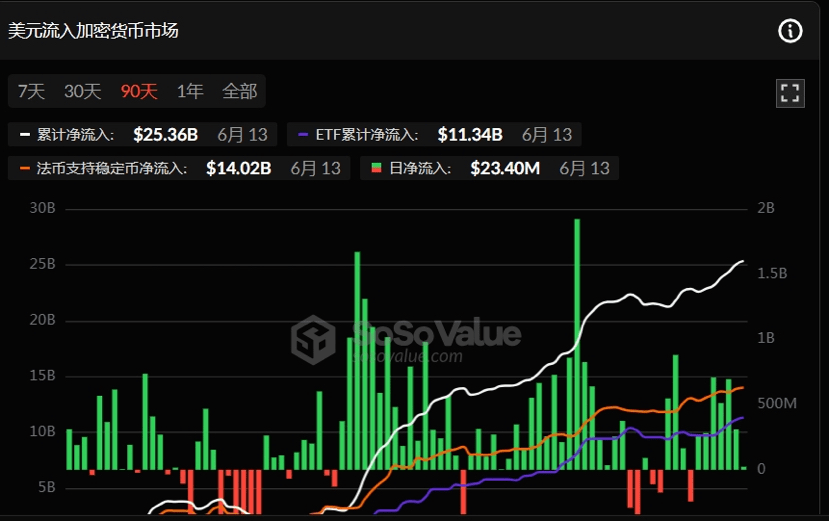
✅ US dollars flow into the cryptocurrency market Daily net inflow: $23.40M
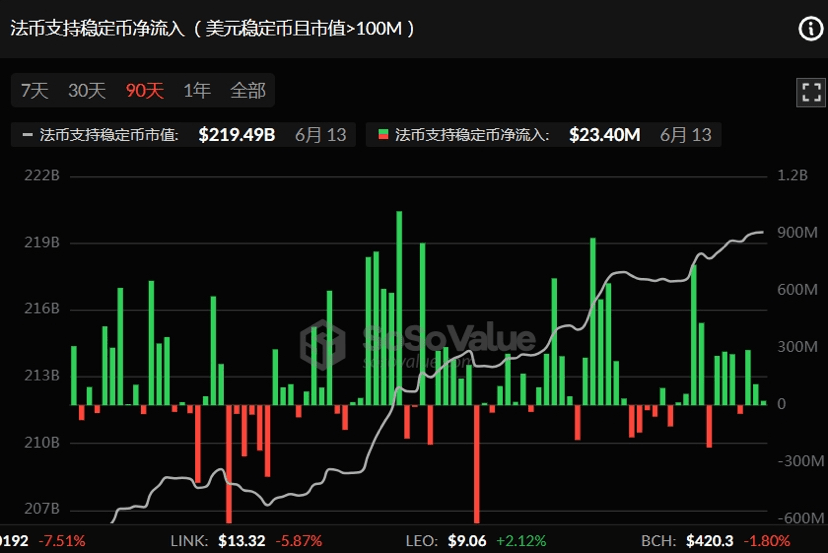
✅ Net inflow of Fiat-backed stablecoins (USD stablecoins with market value > 100M) Net inflow of Fiat-backed stablecoins: $23.40M
✅BTC on-chain data shows that institutions have no obvious signs of reducing their positions and leaving the market
✅BTC fell sharply due to the news of the Iran war. The price tested the lower support level and then rebounded.
⚠️Breaking news: Iranian state television said that General Gholam Ali Rashid, deputy commander-in-chief of the Iranian armed forces, and nuclear scientist Fereydoon Abbasi were both killed
⚠️Important data: Complete data on major geopolitical events
The following chart shows the S&P500, gold, and BTC in relation to major geopolitical events in recent years.
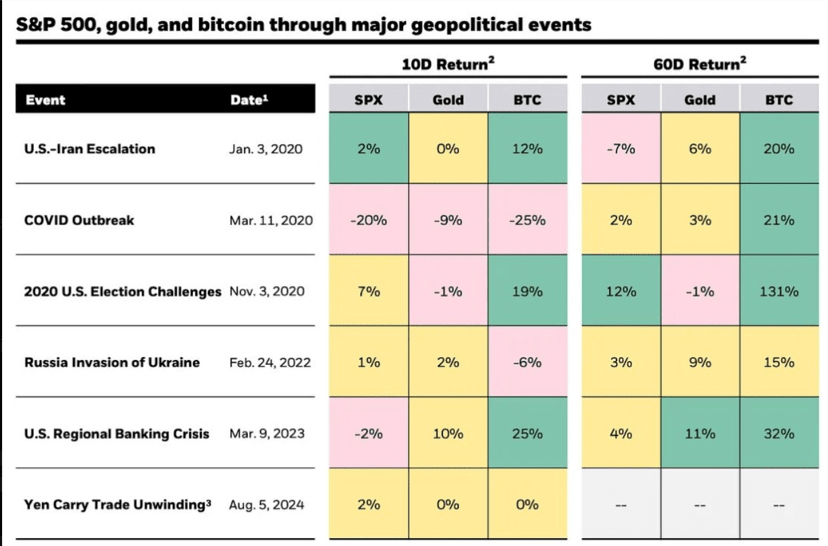
⚠️Conclusion:
Within a few days of the event, there may be fluctuations due to breaking news, but unless there is a "recession" afterwards, geopolitical sell-offs tend to be short-lived, "especially BTC, which has the strongest performance of the three assets after 60 days."
In the past 24 hours, the entire network has had a liquidation of $1.159 billion, of which $1.035 billion was for long orders and $124 million was for short orders. The largest single liquidation was worth more than $200 million.
B BTC price fell, positions decreased, and funding rates decreased, reflecting that a large number of long positions in the market left or were liquidated
As BTC fell, the USDC/USDT trading pair followed BTC and fell sharply, reaching a recent low of 0.999. A large number of investors sold USDC in exchange for USDT to add margin to contracts.
The balance of over-the-counter transactions of Miner Workers has decreased significantly.
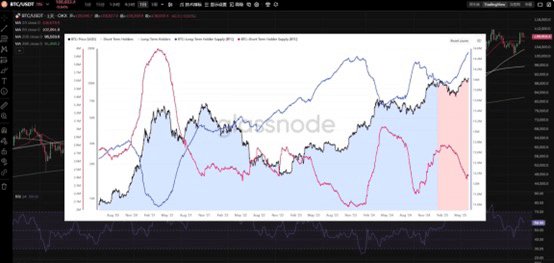
The number of BTC short-term holders is at a low level, and there is no high-level exchange with long-term holders.
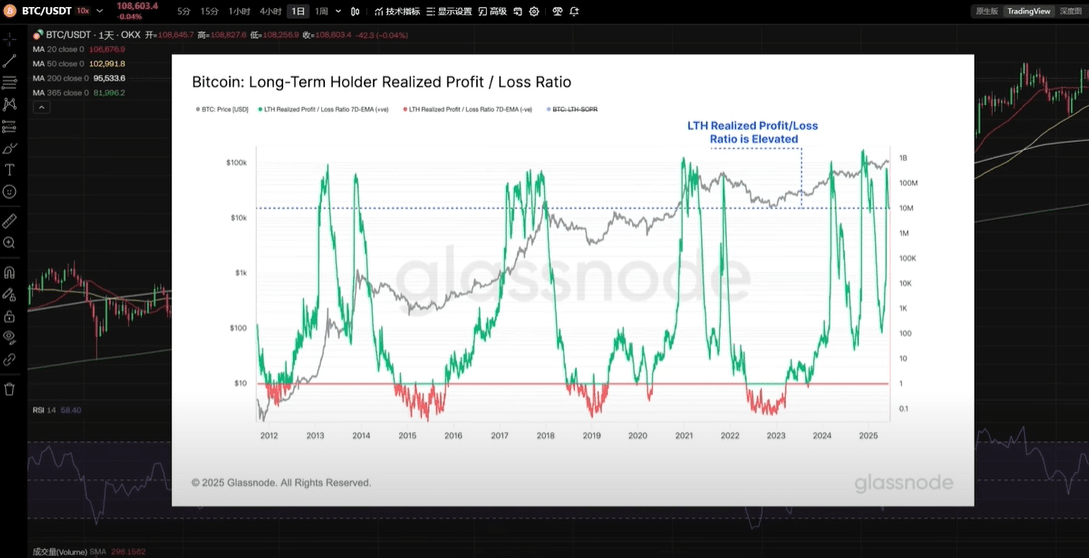
The profit-loss ratio of long-term BTC holders has peaked again
BTC wallet inflows and outflows from exchanges indicate that a large number of long-term investors are not panic selling
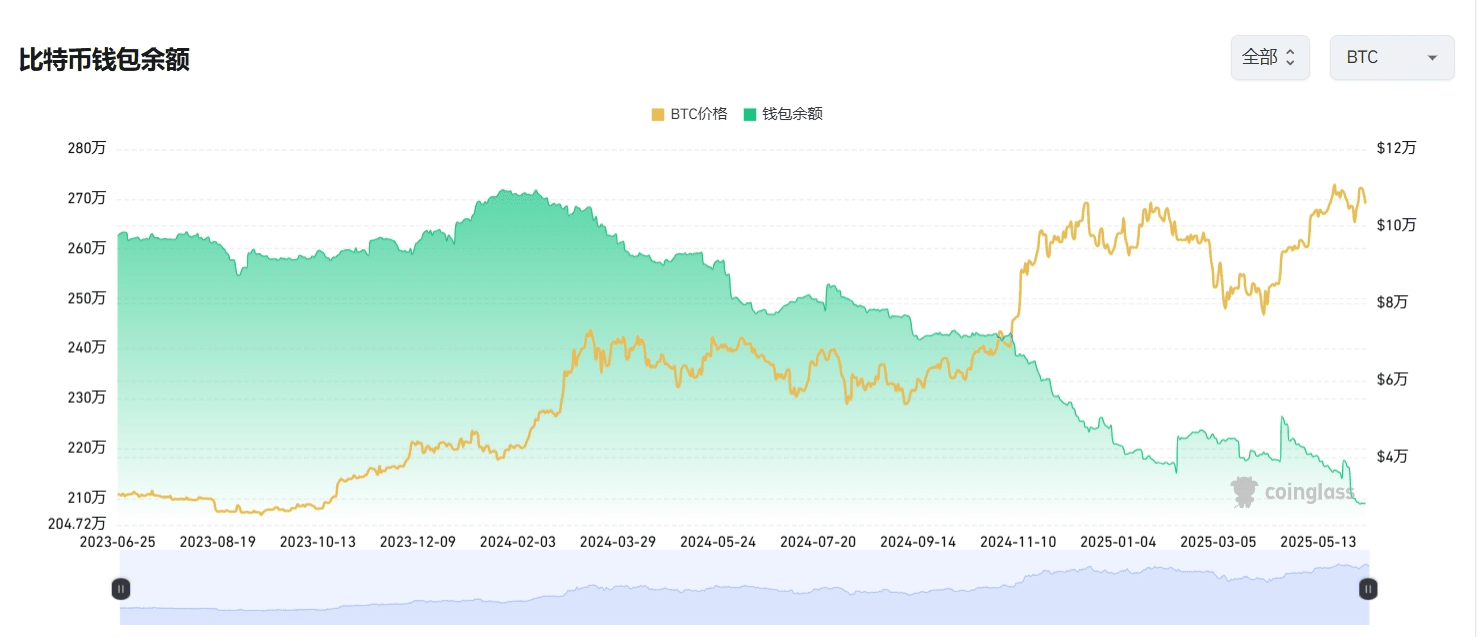
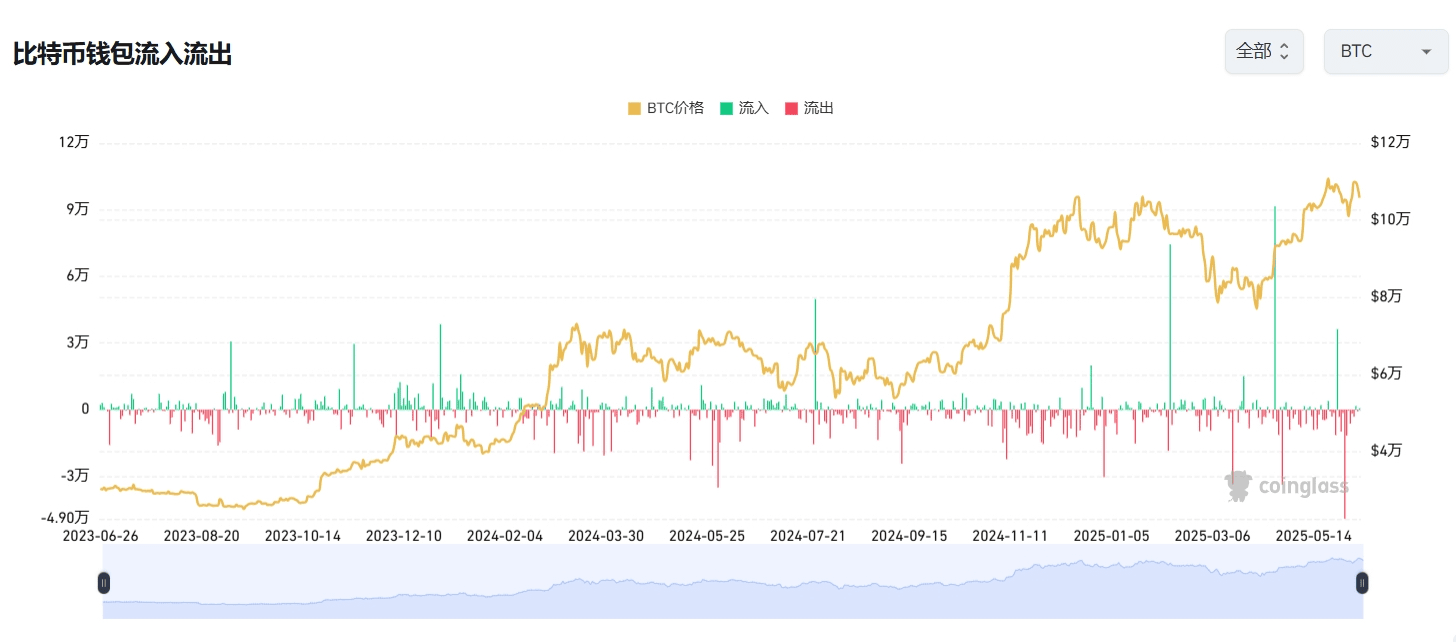
** Interpretation of the meaning of BTC inflow and outflow data
The BTC inflow and outflow of exchange wallets is a core on-chain indicator of the crypto market, directly reflecting the movement of major funds and market sentiment.
Inflow ↑ Holders deposit BTC into exchanges. Expected selling pressure increases. Beware of short-term declines.
Outflow ↓ Holders withdraw BTC from exchanges Increasing willingness to hoard/lock positions Indicates medium-term bullishness
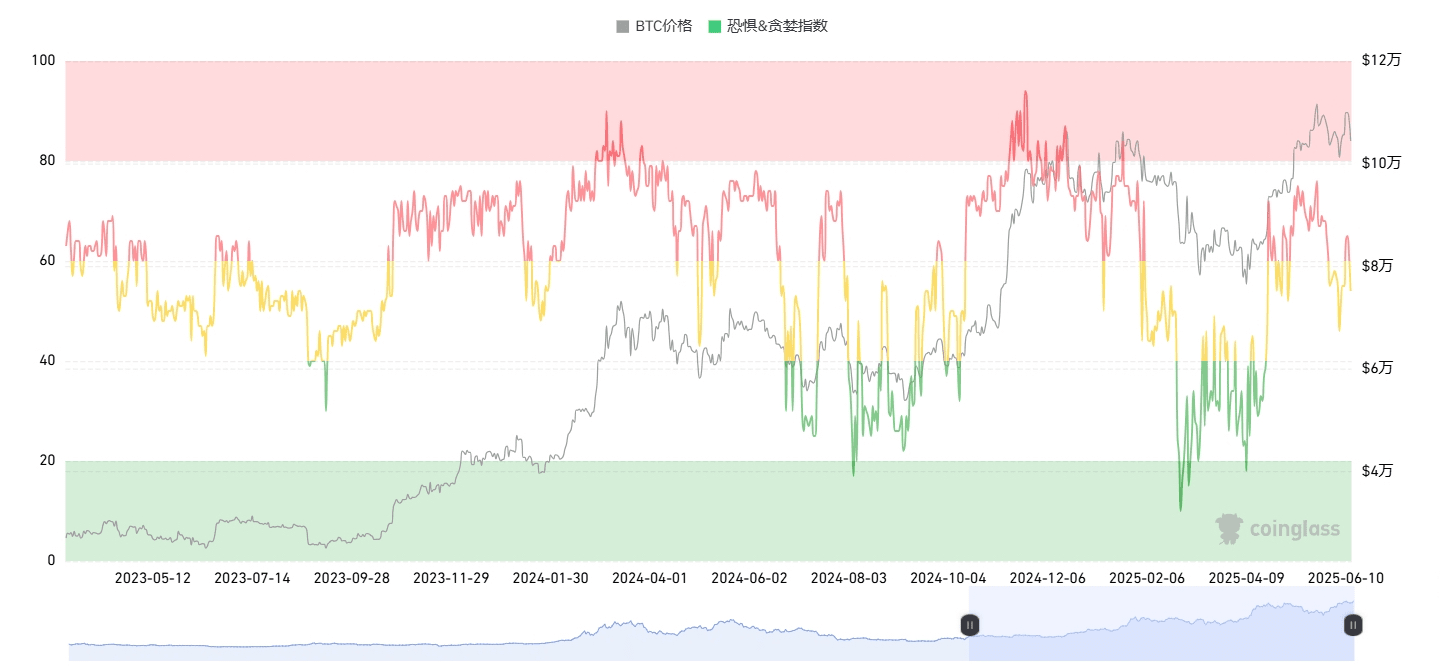
1. Greed and Fear Index Today: 54 Greed BTC returns to neutral after a pullback
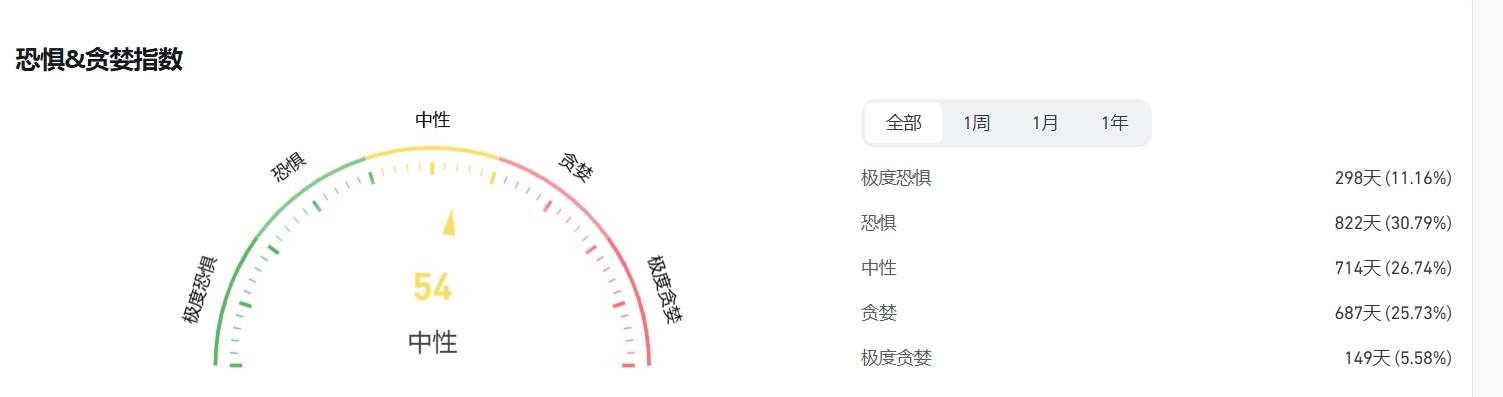
** Greed Panic/ Greed Index Interpretation
The behavior of the cryptocurrency market is very emotional. When the market is rising, people tend to be greedy and have a fear of missing out, and when the market is falling, they react irrationally by selling their cryptocurrencies.
With the help of the fear and greed index, we can help our friends get rid of the influence of their own emotional factors and make irrational judgments as much as possible.
There are two states:
Extreme fear indicates that investors are overly worried and could be a buying opportunity.
Being too greedy suggests that investors are too excited and the market may be due for a correction.
2. Bitcoin’s total market share: 63.46, a significant increase from yesterday, and altcoins are losing a lot of money
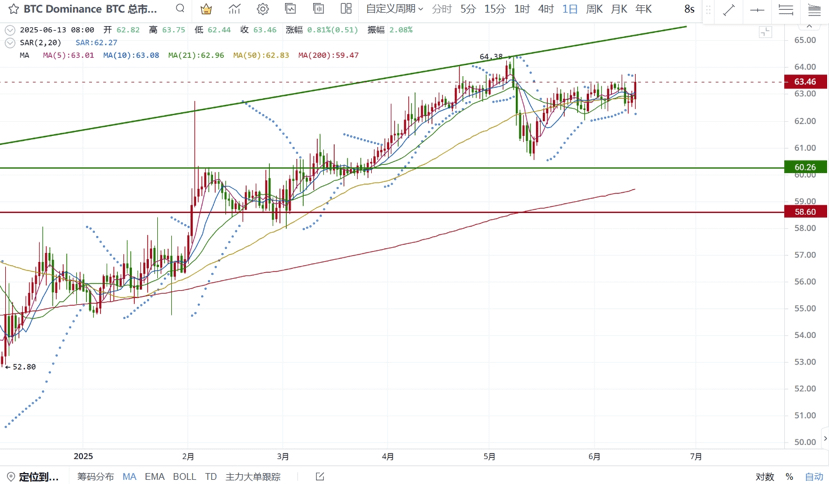
**Bitcoin's total market share is a core indicator to measure Bitcoin's relative influence in the entire cryptocurrency market. This indicator not only reflects Bitcoin's short-term market position, but also reveals changes in capital rotation, investor sentiment and macro trends.
Bitcoin market share is a barometer for judging the market stage:
Early stage of bull market: market share increases, and funds are allocated to Bitcoin first.
Mid- to late-stage bull market: Market share declines, funds rotate to altcoins, triggering the “altcoin season”
Market thermometer: >60% = risk aversion; <40% = altcoin frenzy.
Fund flow chart: reveals the allocation preferences of institutions and retail investors (Bitcoin → stable, altcoin → high risk and high return)
3. Bitcoin and Ethereum trading pair 0.0241976 Ethereum to Bitcoin trading pair fell sharply
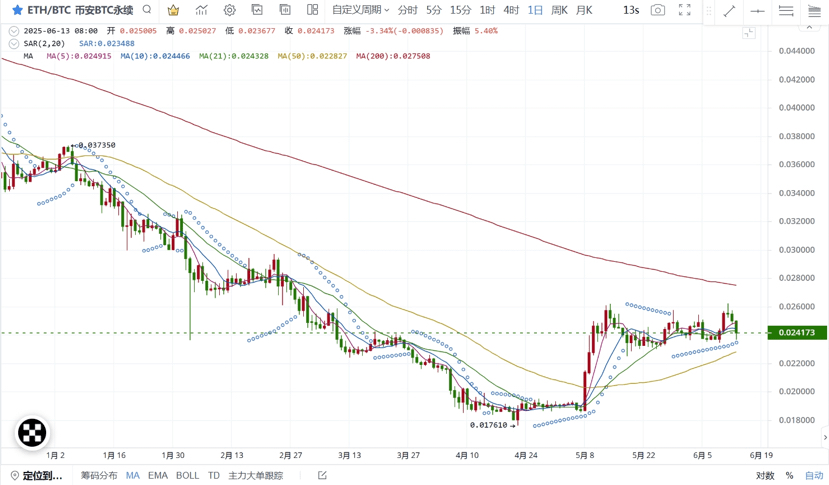
**The Bitcoin/Ethereum trading pair is the “risk thermometer” of the cryptocurrency market:
Ratio rises → market prefers high-risk assets (signal of the start of the altcoin season);
Ratio decreases → funds flee to Bitcoin (characteristic of a bear market or early bull market).
4. ETF inflow and outflow data ETF data maintained a small net inflow
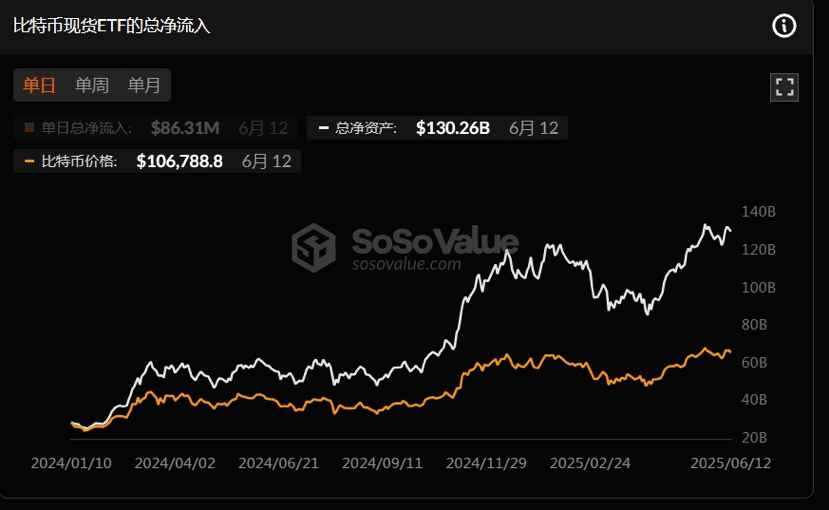
**ETF inflow and outflow data description: Bitcoin ETF's inflow and outflow data is a core indicator for tracking institutional sentiment, market trends and fund rotation.
5. Statistics of BTC buying and selling by retail, large and institutional investors on the chain. Whales did not sell in large quantities but bought in small amounts instead.
Thanks to @交易扑克大 for providing data collation and sharing
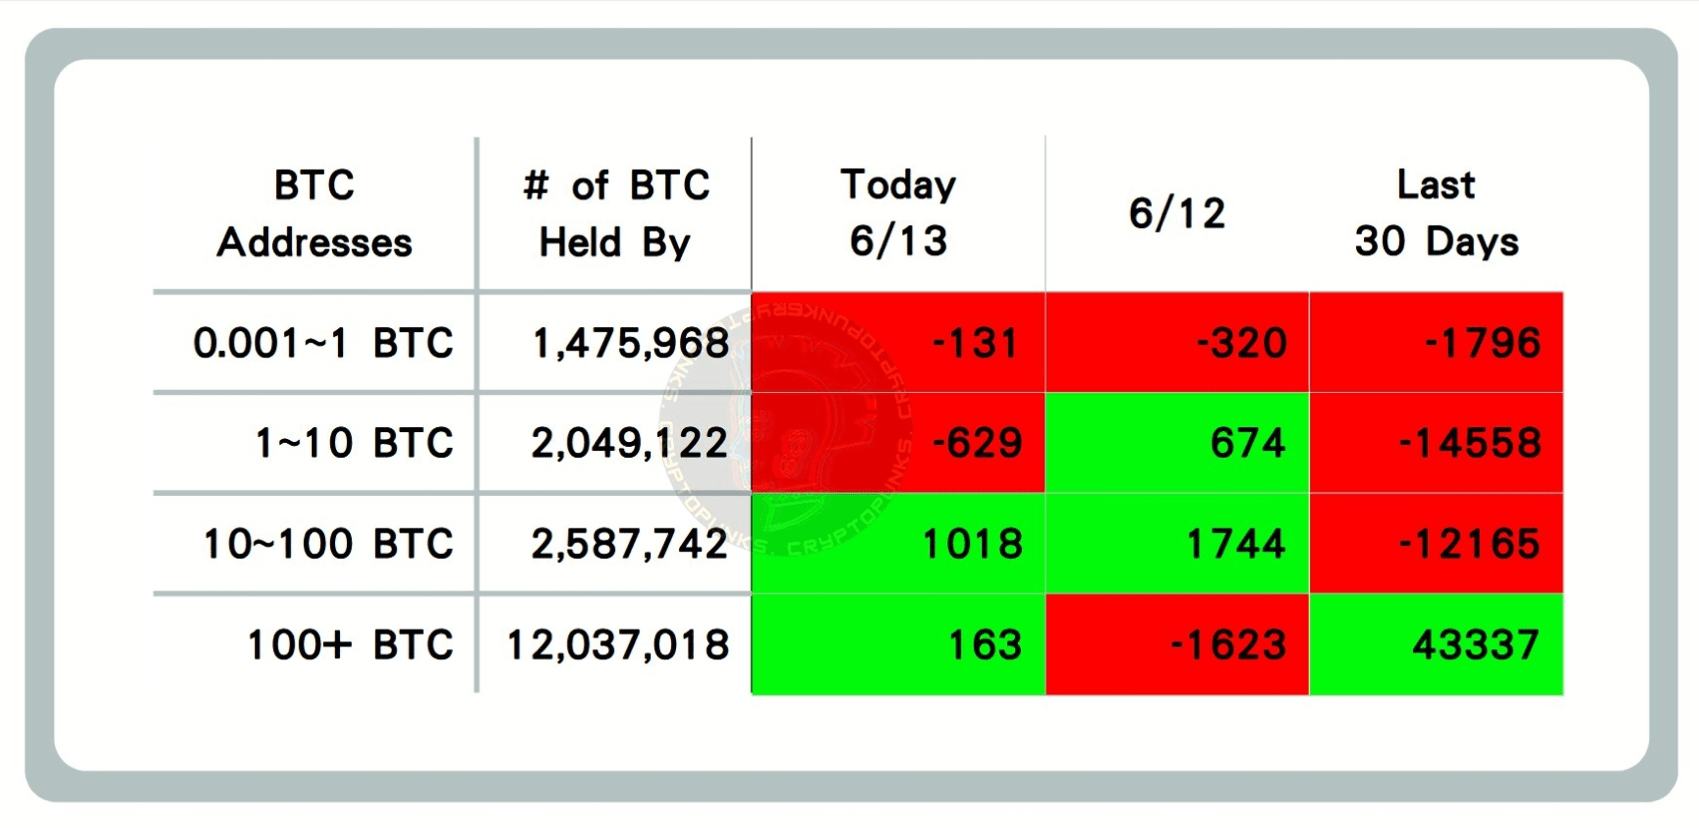
Data description: Represents the increase or decrease of on-chain flow of ≤ 1 BTC, 1-10 BTC, 10-100 BTC, and 100+ BTC respectively. This data can reflect the market sentiment of retail investors, large investors, and institutions.
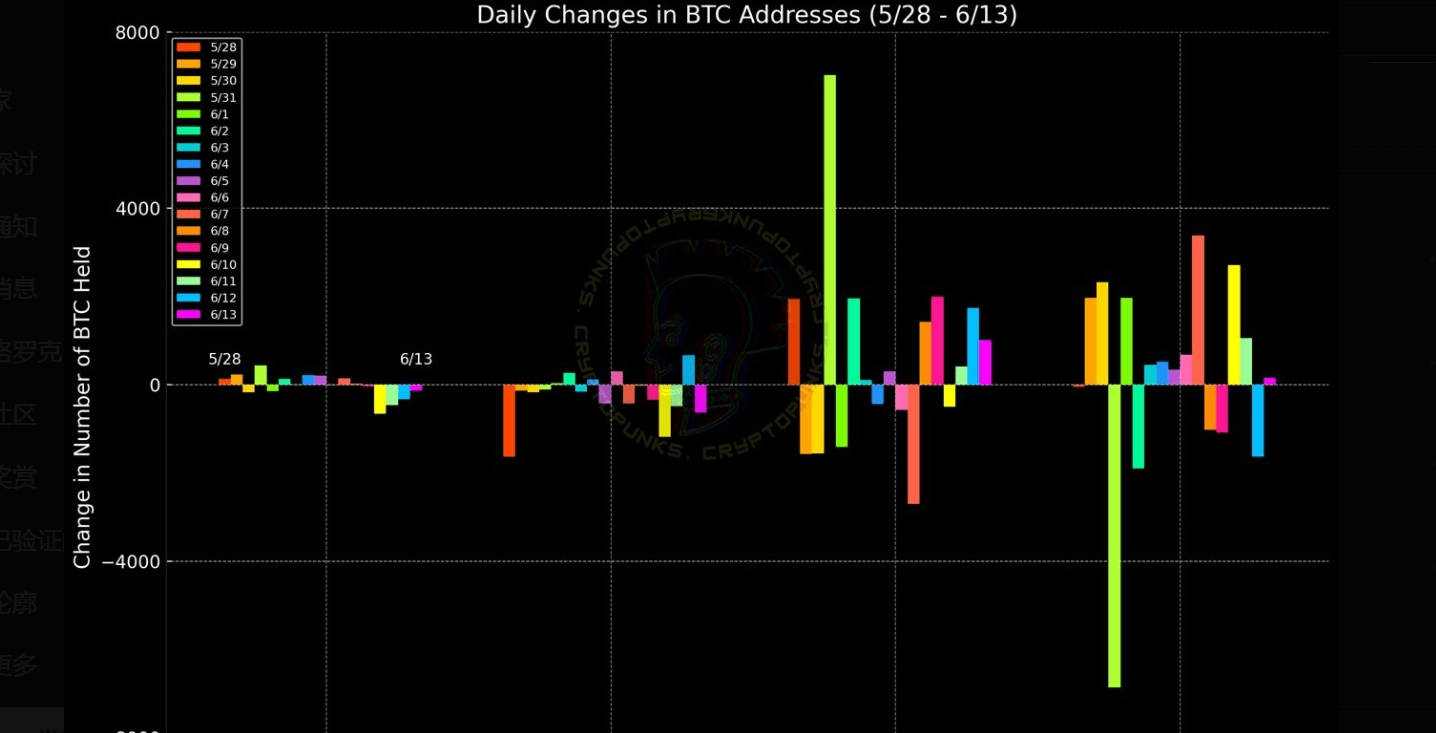
Data description: This data reflects the increase or decrease of on-chain flows of ≤ 1 BTC, 1-10 BTC, 10-100 BTC, and 100+ BTC within a week. This data can intuitively reflect the flow trend of BTC among retail investors, large investors, and institutions in the market.
When an extreme situation occurs in the on-chain data, a reversal often occurs (for example, if a large whale with more than 100 BTC on the chain buys a large amount, while others sell, the probability of Bitcoin rising greatly increases, and vice versa). At the same time, it is necessary to combine the analysis with other on-chain data and technical indicators.
6. MVRV realized market value ratio MVRV > 1
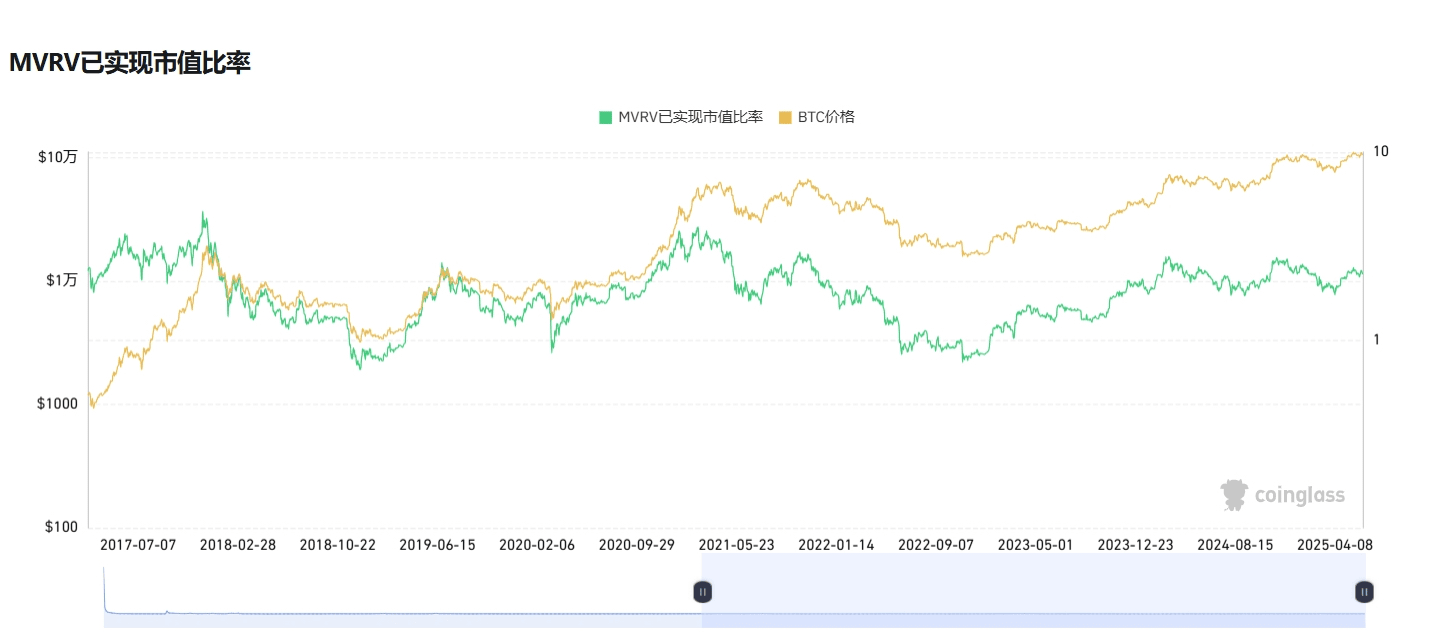
**MVRV realized market value ratio indicator description: MVRV realized market value ratio is an indicator used to evaluate the cryptocurrency market (especially Bitcoin). This indicator can help friends determine whether assets are overvalued or undervalued and identify potential tops and bottoms of market cycles.
MVRV > 1
When the ratio is greater than 1, it means that the market price is higher than the realized price, which means that most holders are in profit. This may indicate an overheated market, especially when MVRV reaches historical highs, which may indicate a market top.
MVRV < 1
When the ratio is less than 1, it means that the market price is lower than the realized price, which means that most holders are losing money. This may indicate that the market is undervalued, especially when MVRV reaches historical lows, which may indicate a market bottom.
7. Altcoin Seasonal Index 16 Is it in the Altcoin Season: No Significantly lower than yesterday
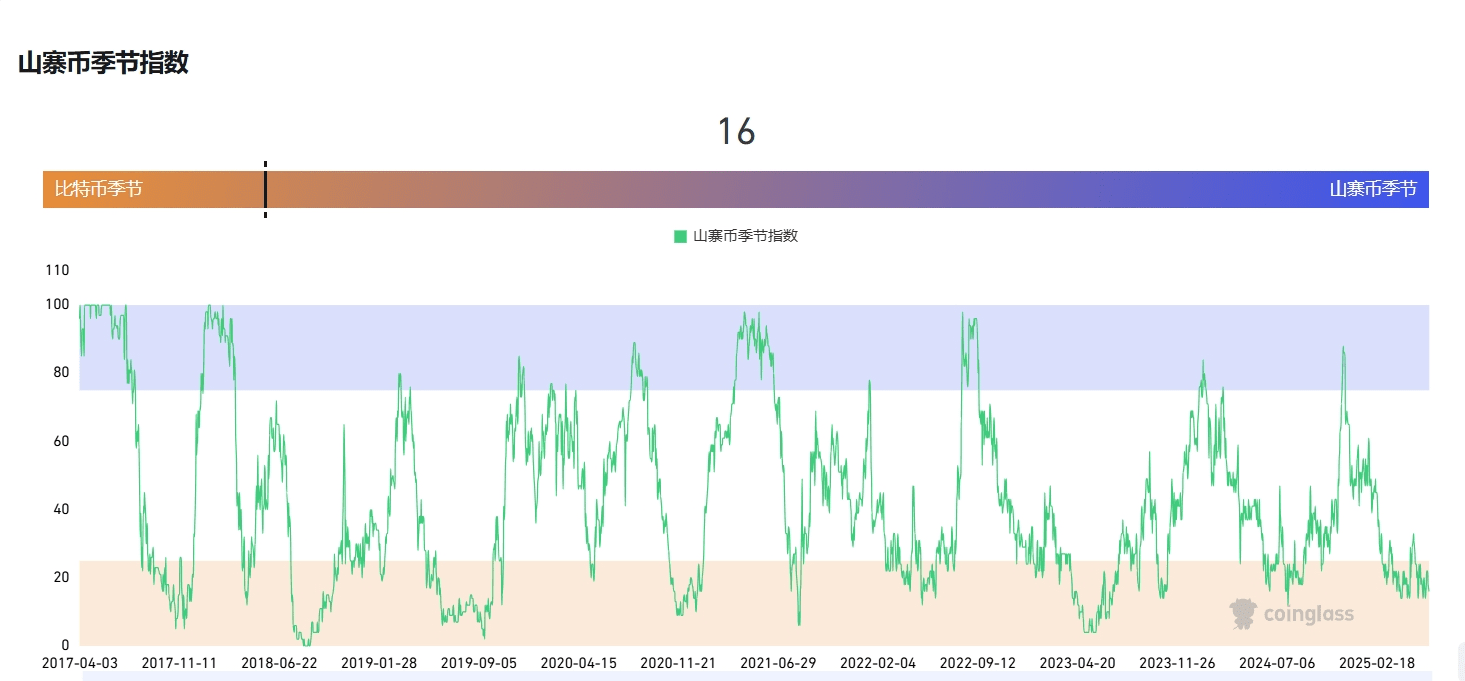
**Altcoin Seasonal Index Description: Altcoin Seasonal Index is an indicator used to measure the performance of non-Bitcoin in the cryptocurrency market. It is usually used to determine whether altcoins outperform Bitcoin in a specific time period, thereby helping investors understand market trends and investment opportunities.
8. US dollars flow into the cryptocurrency market. Small inflow
9. Net inflow of legal tender-backed stablecoins (USD stablecoins with market value > 100M) Small inflow
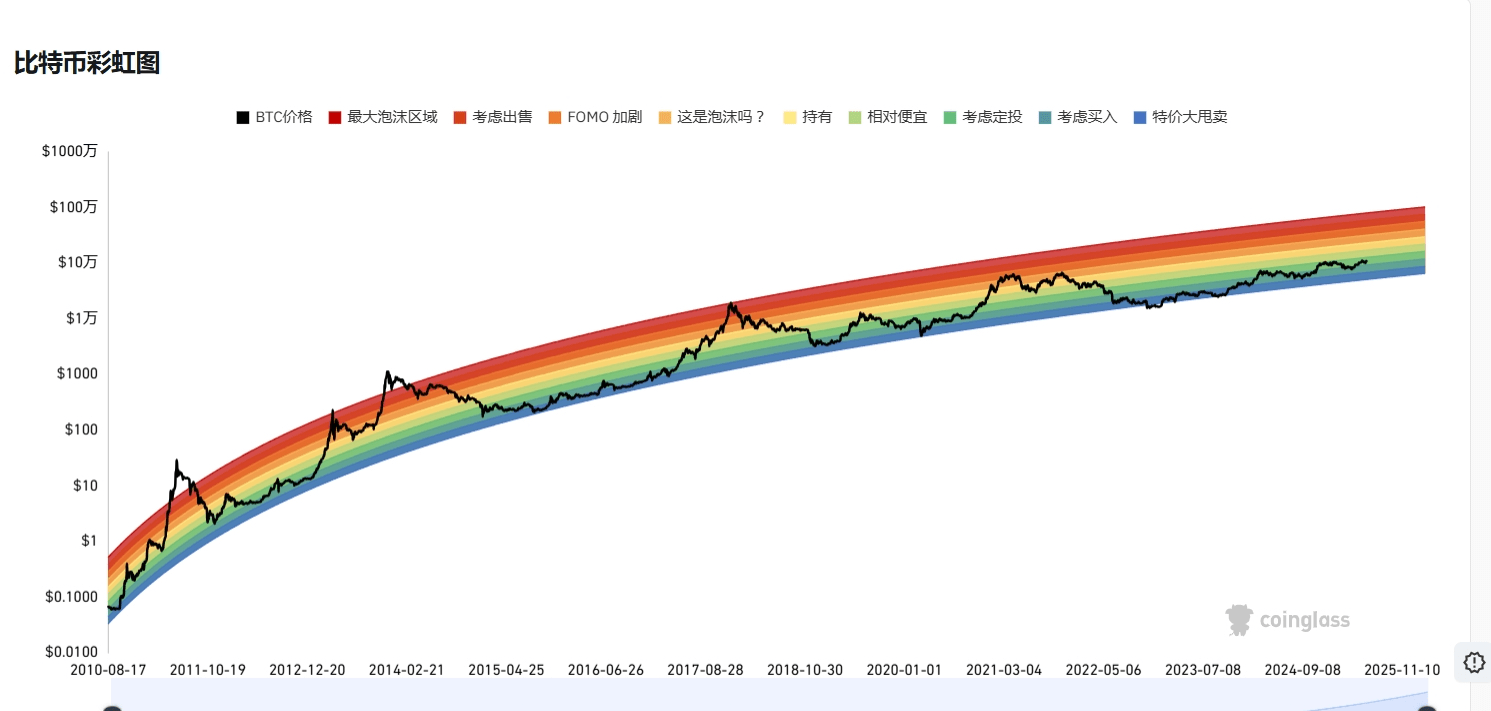
10. The rainbow chart shows that BTC has no signs of peaking
The above data only represents the prediction of BTC volatility trend and market sentiment from the perspective of on-chain data, and does not represent any investment advice. Please make your decision carefully! !

I am Mingzhu. Follow me and I will share real-time data and dynamics on the chain every day to help my friends predict and make decisions. Don’t miss the excitement. Welcome to leave a message for discussion.