Special Reminder:
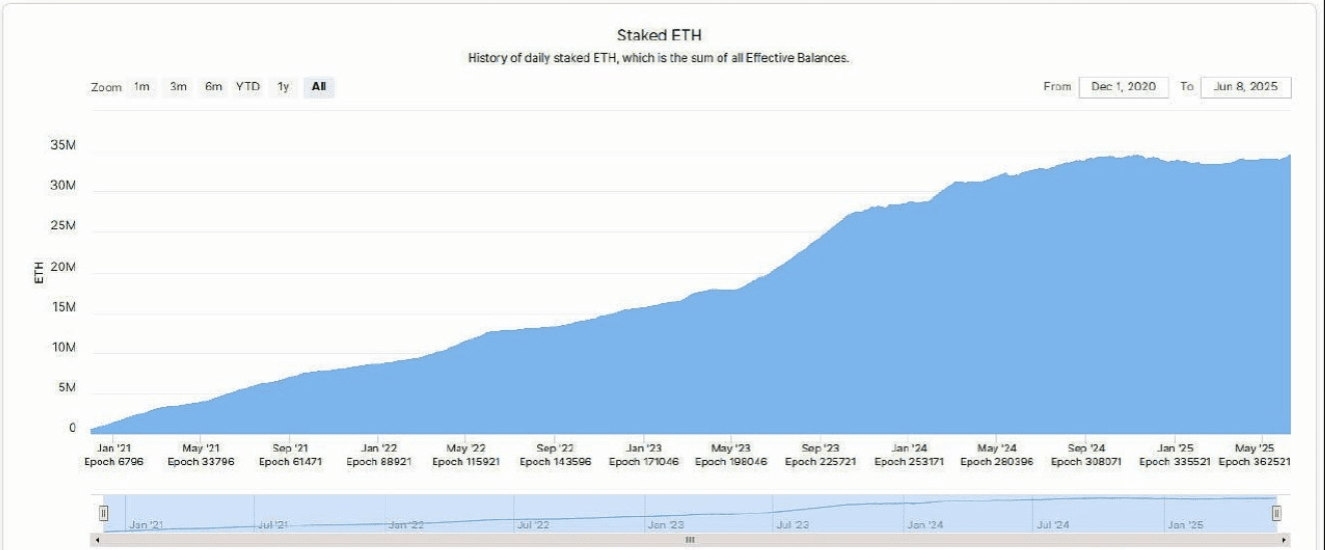
✅ The amount of staked Ethereum has reached 34.65 million, setting a new historical high.
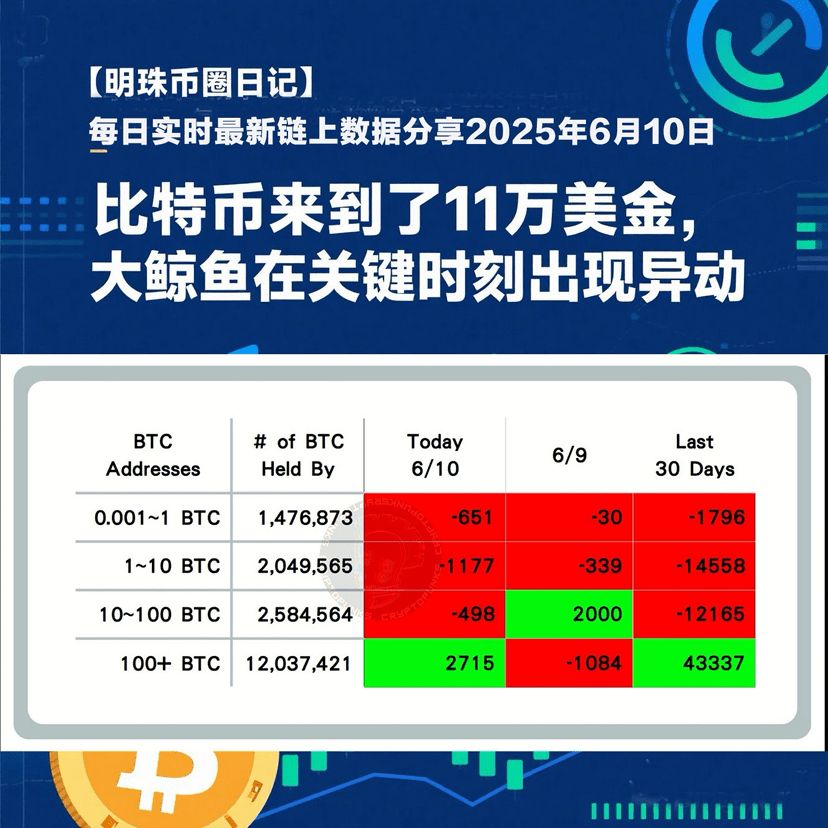
✅ $BTC100+ whales have made significant purchases, indicating extreme market conditions; pay close attention.
✅ Spot ETF Data $BTC Net Flow: +$386.2 Million $ETH Net Flow: +$52.7 Million
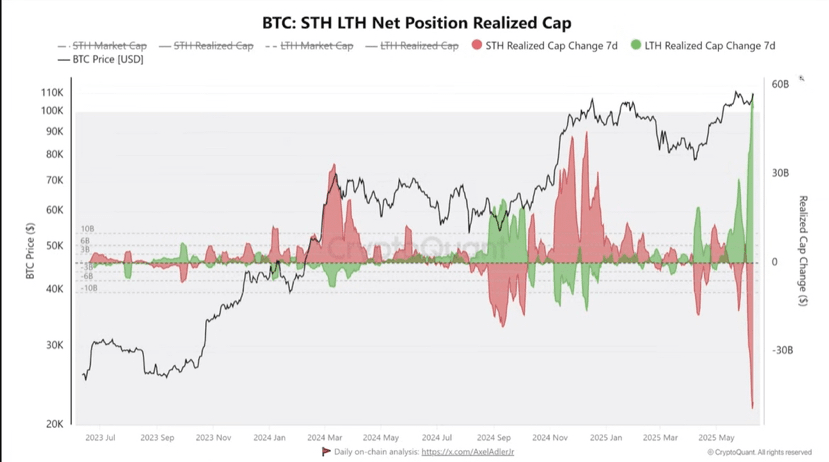
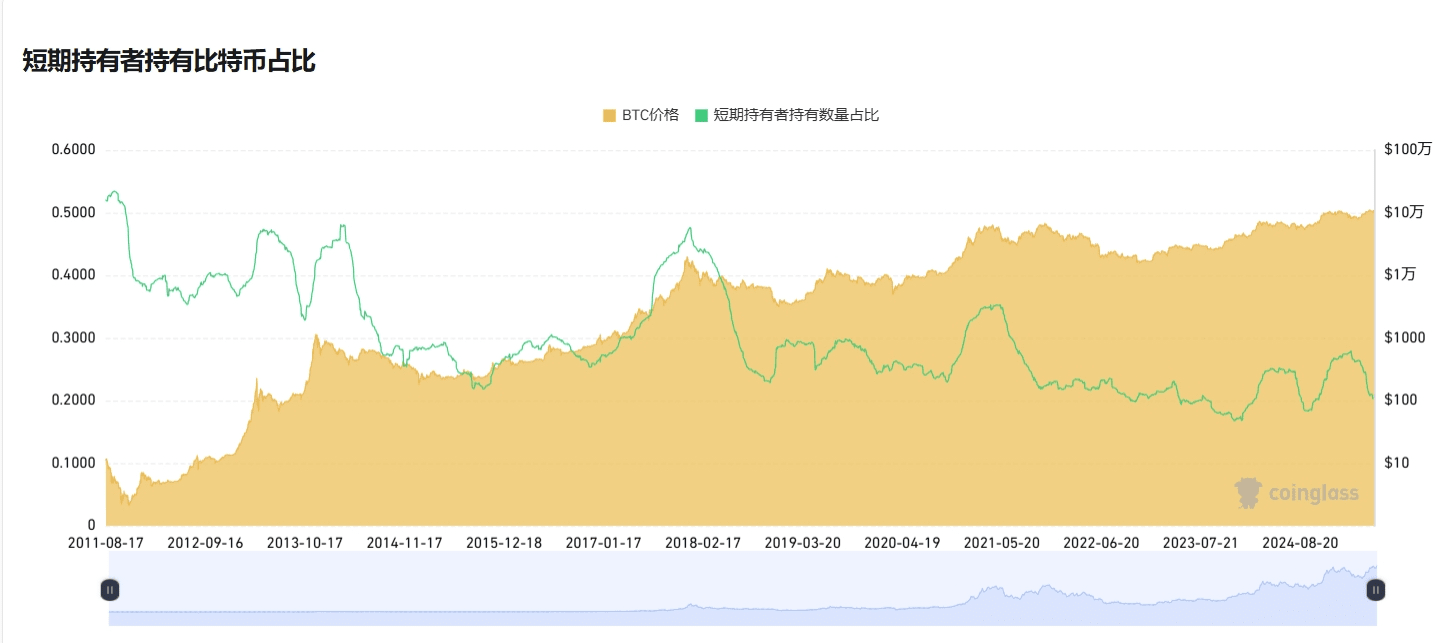
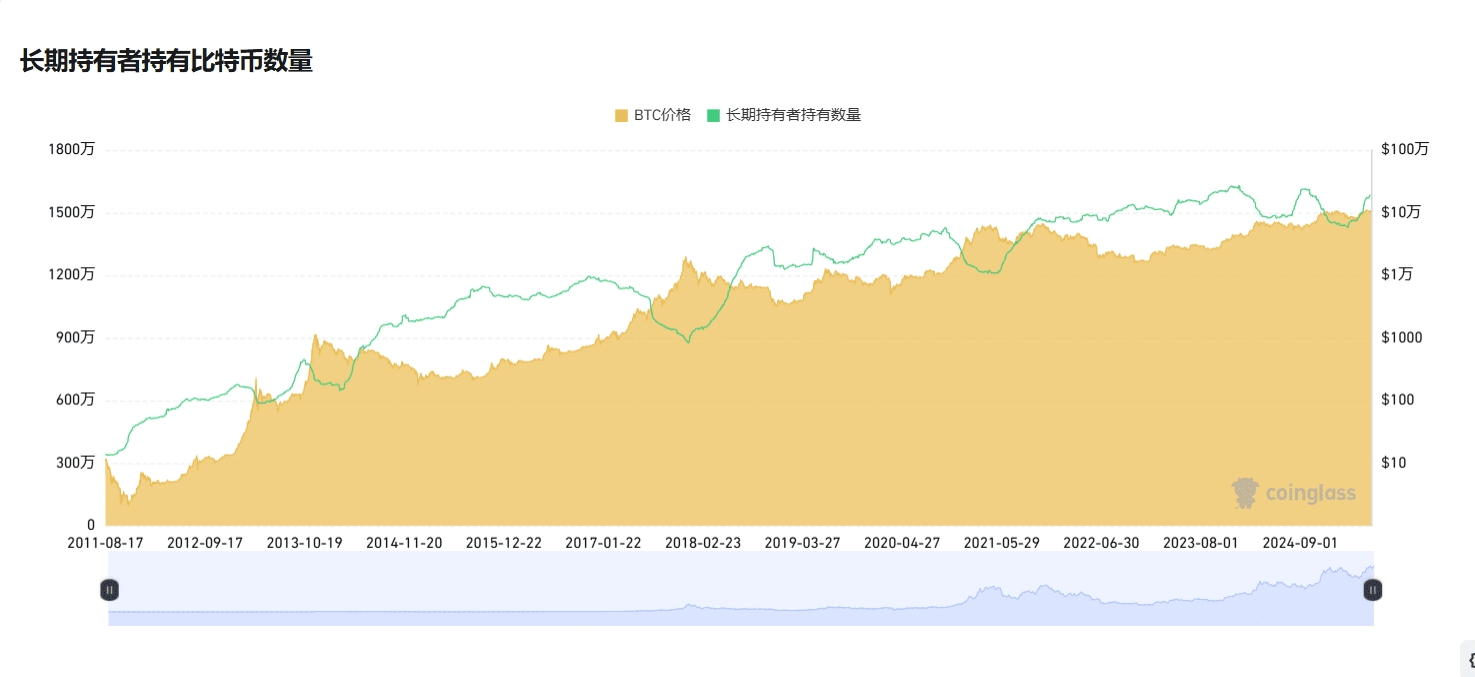
✅ The proportion of short-term holders holding Bitcoin continues to decline, while the proportion of long-term holders continues to rise.
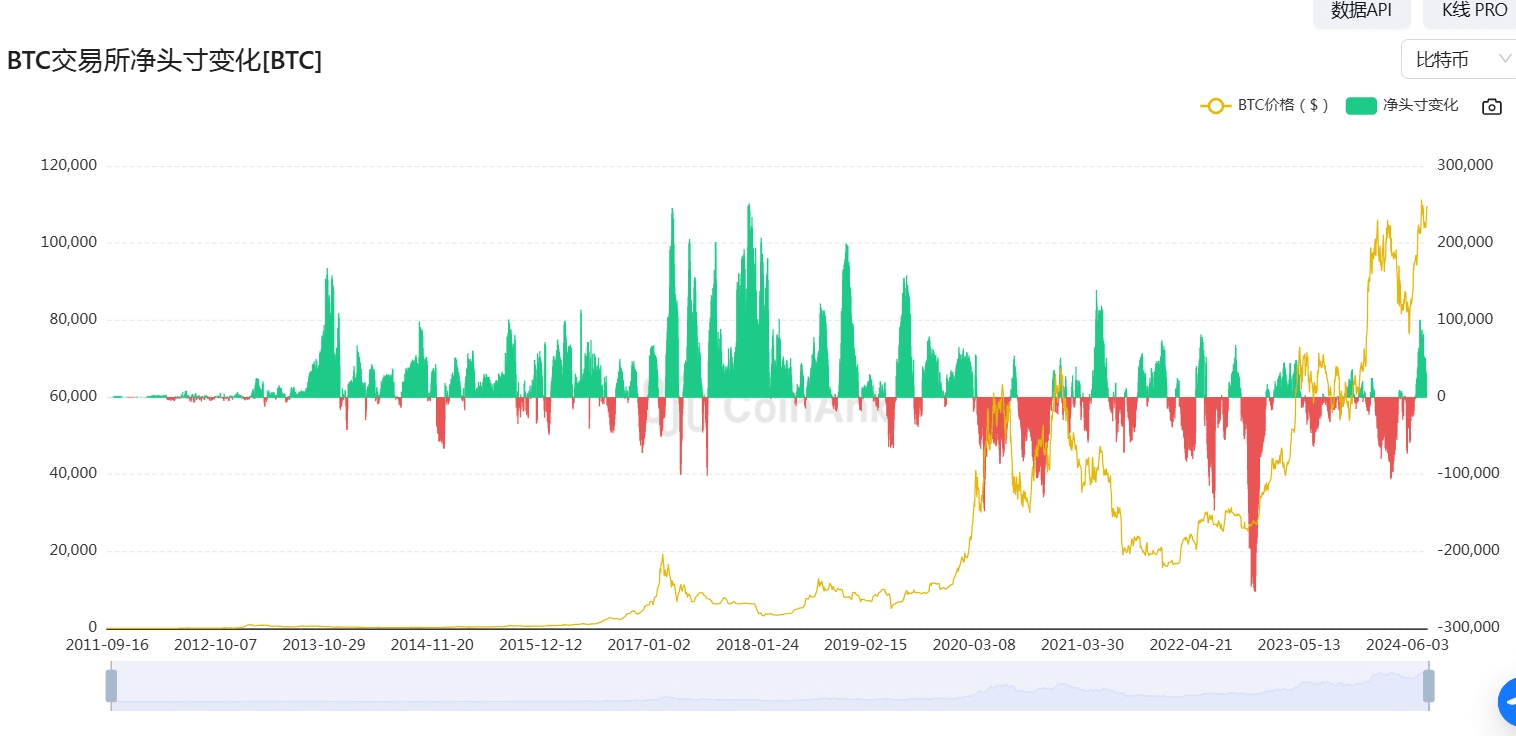
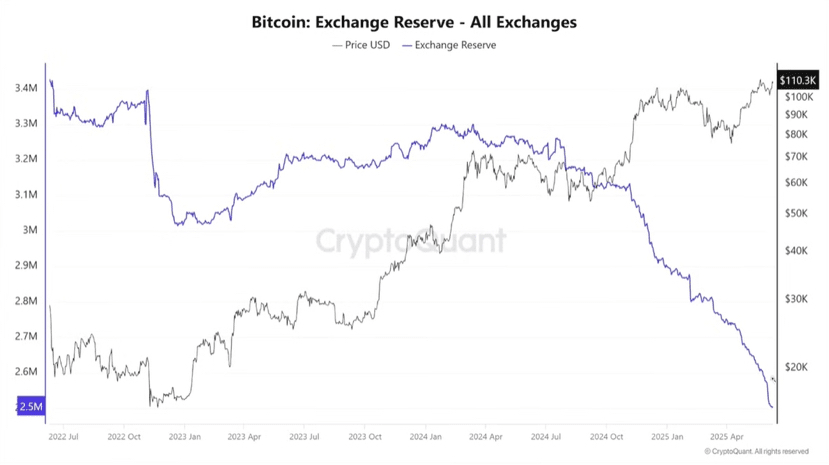
✅ The balance of Bitcoin wallets on exchanges continues to decline.
✅ Bitcoin wallets on exchanges continue to see outflows.
✅ Total Net Inflow of Bitcoin Spot ETF Daily Total Net Inflow: $386.27M
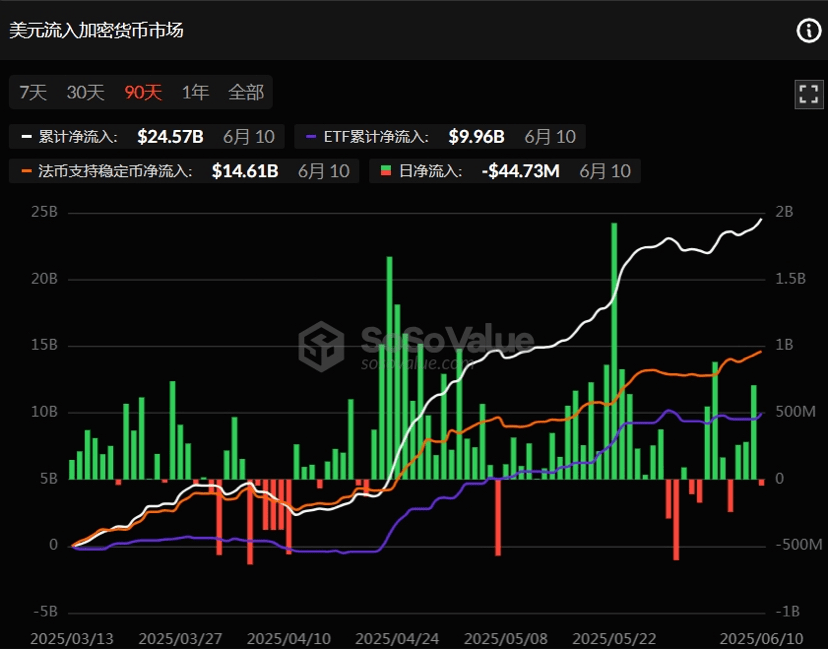
✅ USD inflow into the cryptocurrency market: Daily net inflow: -$44.73M
✅ Fiat-backed stablecoin net inflow (USD stablecoin with market cap > 100M): Net inflow: -$44.73M.
The amount of staked Ethereum has reached 34.65 million, setting a new historical high
Short-term traders are experiencing a massive sell-off, while long-term holders are buying in large quantities.
Exchange BTC Inflow and Outflow: BTC supply from exchanges continues to hit new lows, with many long-term investors withdrawing BTC from exchanges.
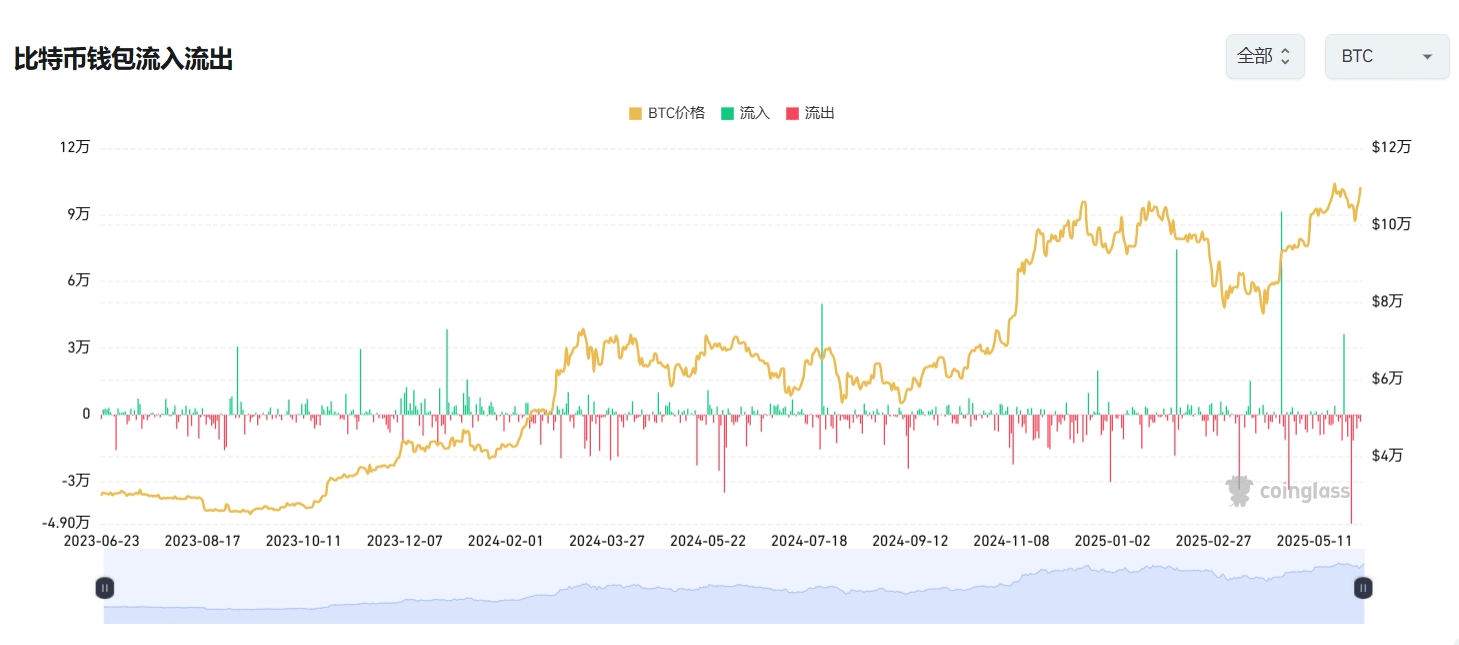
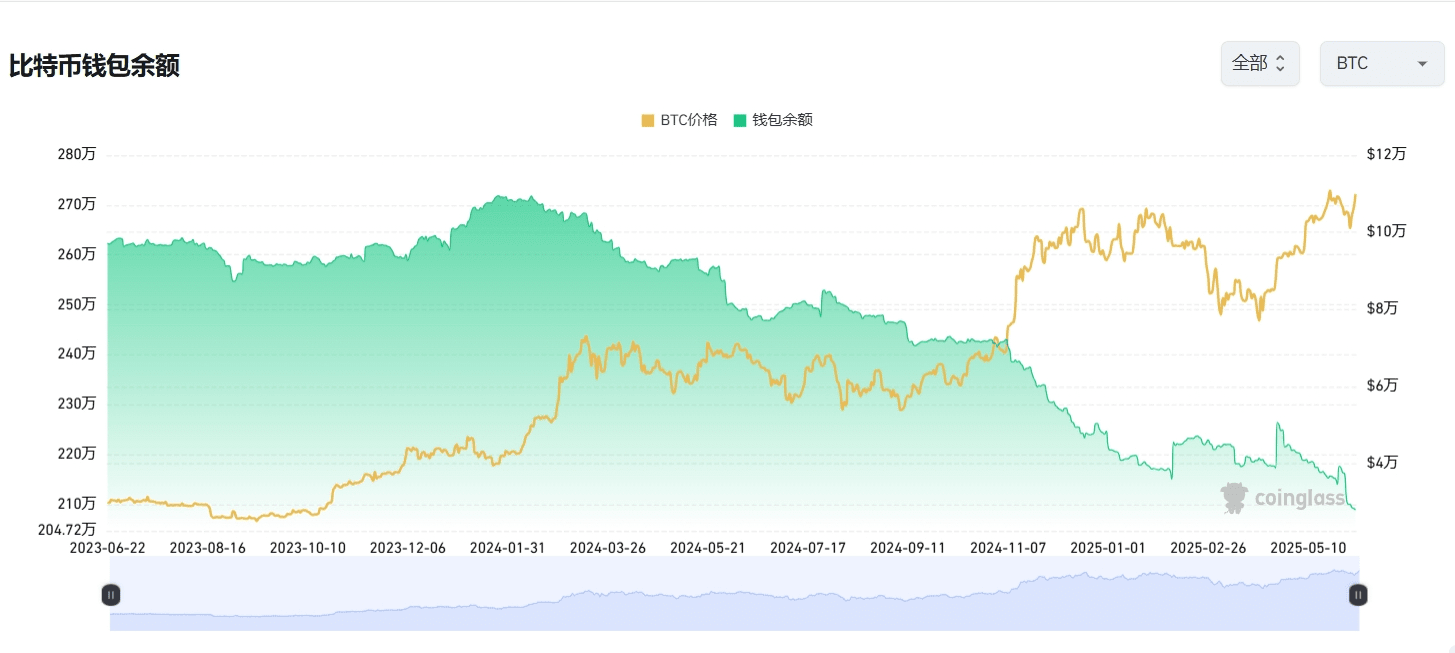
** Interpretation of BTC Inflow and Outflow Data
The BTC inflow and outflow from exchange wallets are core on-chain indicators of the crypto market, directly reflecting the movements of major funds and market sentiment.
Inflow ↑ Holders deposit BTC into exchanges Expectation of selling pressure increases Be cautious of short-term declines
Outflow ↓ Holders withdraw BTC from exchanges Willingness to hoard/lock up increases Indicates bullish outlook in the medium term.
1. Fear and Greed Index: Today's value is: 64 Greed. The market has entered a greedy phase.
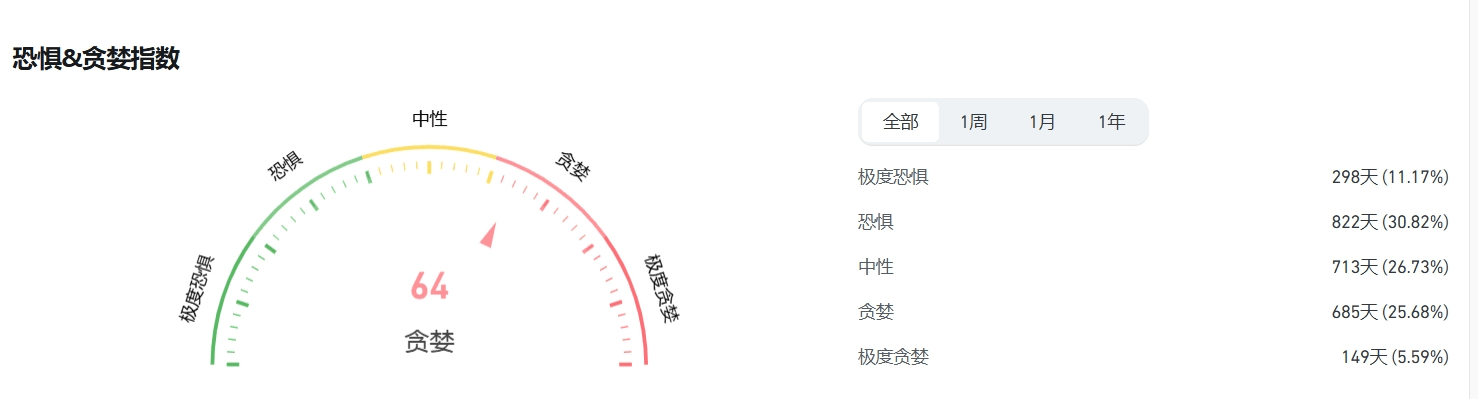
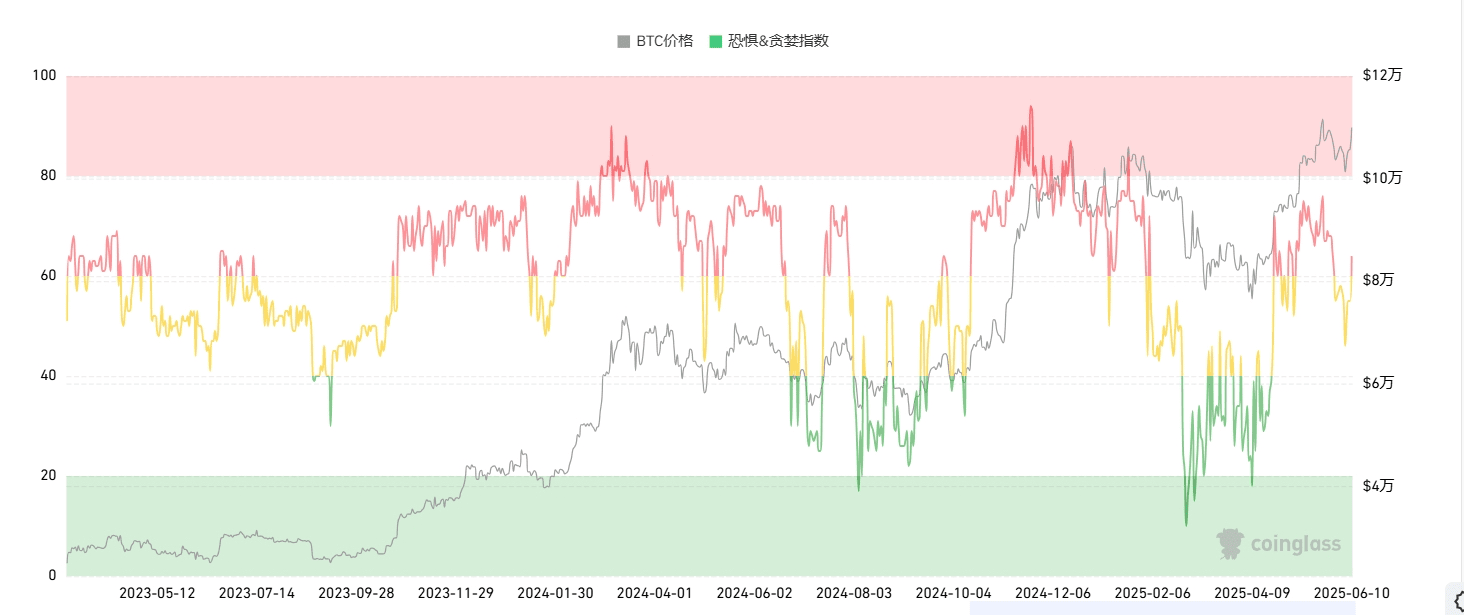
** Interpretation of Fear and Greed Index
Behavior in the cryptocurrency market is highly emotional. When the market rises, people tend to be greedy, creating a fear of missing out; when the market falls, they irrationally sell their cryptocurrencies.
With the help of the Fear and Greed Index, we aim to help everyone make rational judgments free from emotional influences.
There are two states:
Extreme fear indicates that investors are overly worried, which could be a buying opportunity.
Excessive greed indicates that investors are overly excited, and the market may undergo a correction.
2. Bitcoin Total Market Share: 62.76, slightly down from yesterday.
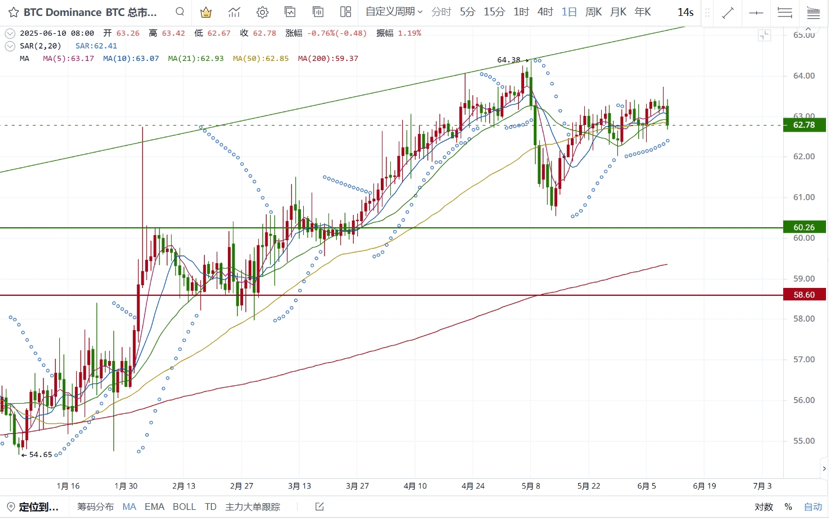
** Bitcoin's Total Market Share is a core indicator of Bitcoin's relative influence in the entire cryptocurrency market. This indicator not only reflects Bitcoin's short-term market position but also reveals changes in capital rotation, investor sentiment, and macro trends.
Bitcoin's market share is a 'weather vane' for assessing market phases:
Early bull market: Market share rises, capital prioritizes allocation to Bitcoin.
Late bull market: Market share declines, capital rotates into altcoins, triggering 'altcoin season'.
Market thermometer: >60% = Risk aversion dominant; <40% = Altcoin frenzy period.
Fund Flow Chart: Reveals the allocation preferences of institutions versus retail investors (Bitcoin → Stable, Altcoins → High Risk, High Return).
3. Bitcoin and Ethereum Trading Pair: 0.25177 Ethereum to Bitcoin trading pair has strengthened significantly
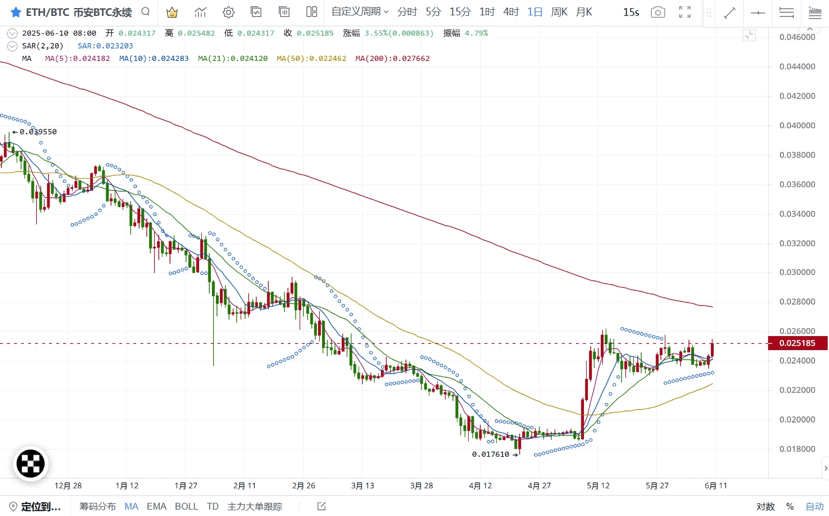
** The Bitcoin/Ethereum trading pair is the 'risk thermometer' of the cryptocurrency market:
Ratio rises → The market prefers high-risk assets (signal for the start of altcoin season);
Ratio declines → Funds are seeking refuge in Bitcoin (characteristics of a bear market or the beginning of a bull market).
4. ETF Inflow and Outflow Data: ETF data maintains a slight net inflow.
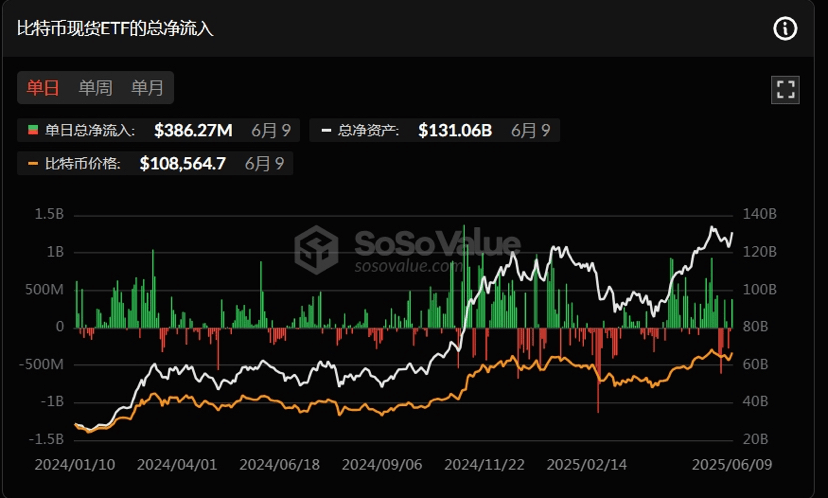
**ETF Inflow and Outflow Data Explanation: The inflow and outflow data of Bitcoin ETF are core indicators for tracking institutional sentiment, market trends, and capital rotation.
5. Statistics of on-chain BTC buying and selling by retail investors, large holders, and institutions: Whales have been continuously withdrawing for two days.
Thanks to @TradingPunk for providing data organization and sharing
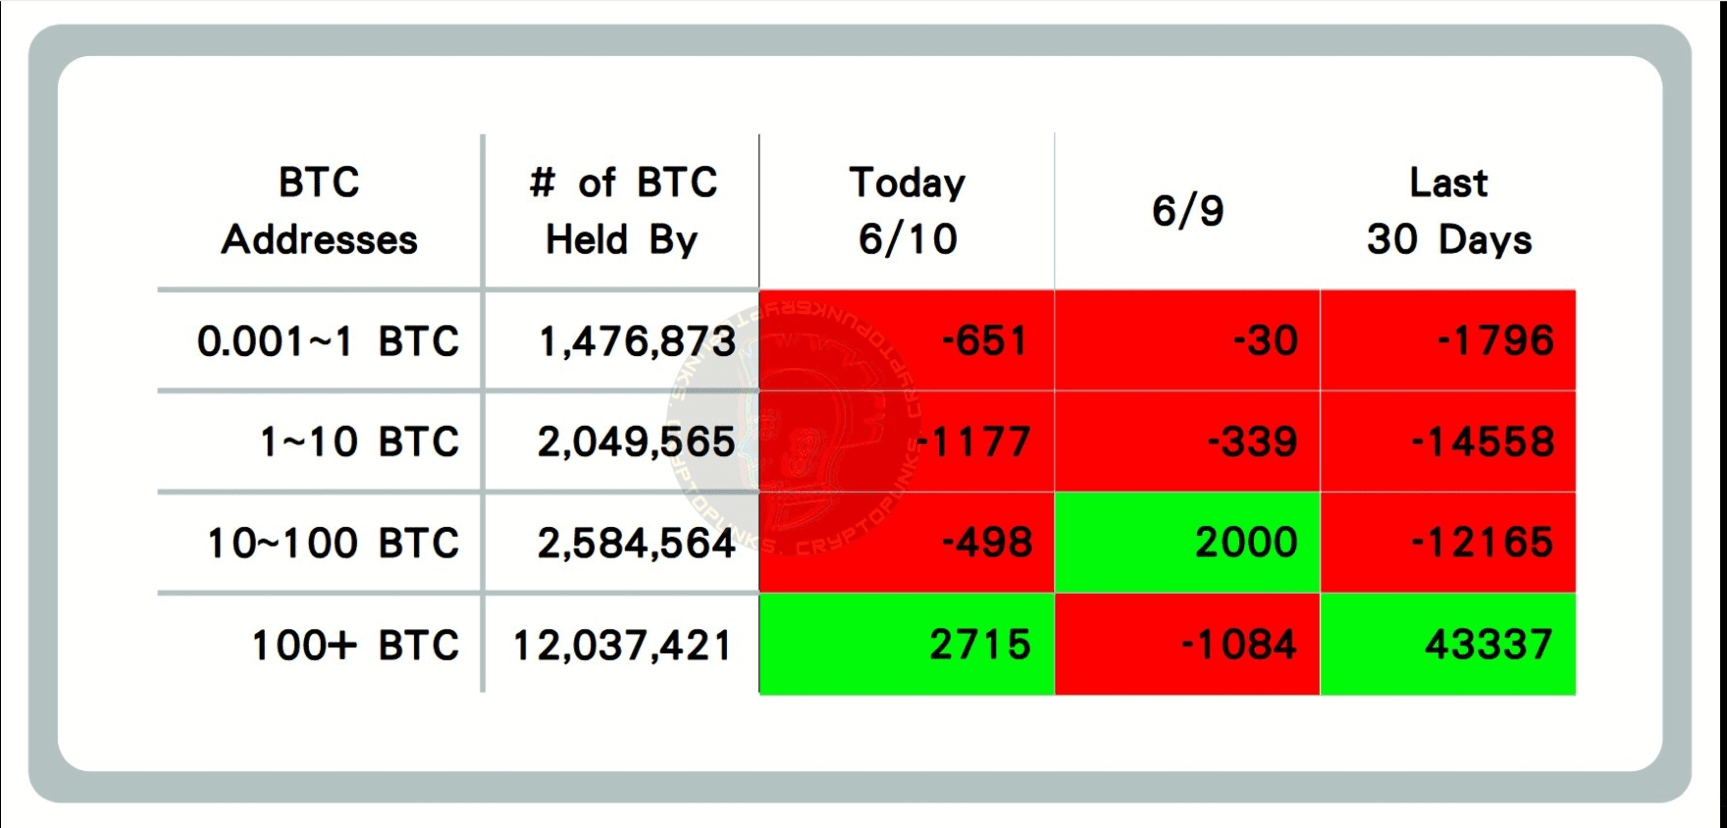
Data Explanation: Represents the inflow and outflow of ≤ 1 BTC, 1—10 BTC, 10—100 BTC, and 100+ BTC on-chain, reflecting market sentiment among retail investors, large holders, and institutions.
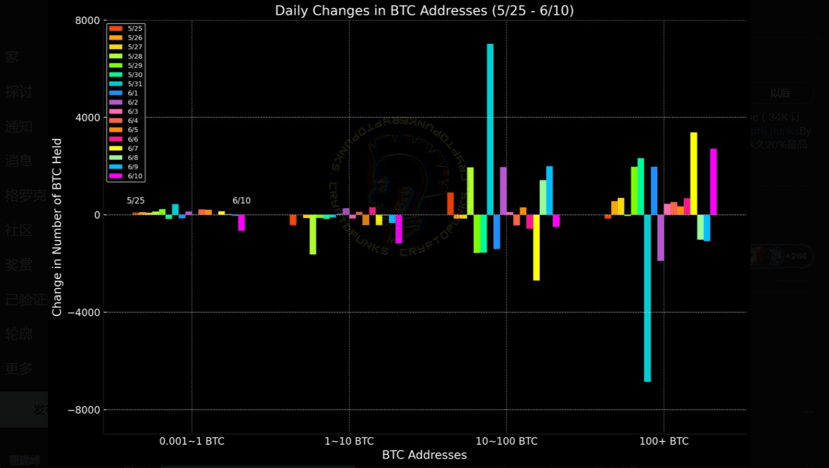
Data Explanation: This data reflects the inflow and outflow of ≤ 1 BTC, 1—10 BTC, 10—100 BTC, and 100+ BTC on-chain within a week, visually reflecting the BTC liquidity trends among retail investors, large holders, and institutions.
When extreme conditions occur in on-chain data, reversals are often seen (e.g., if whales holding over 100 BTC buy a large amount while others are selling, the probability of Bitcoin rising significantly increases, and vice versa). It is necessary to analyze in conjunction with other on-chain data and technical indicators.
6. MVRV Realized Market Value Ratio: MVRV > 1
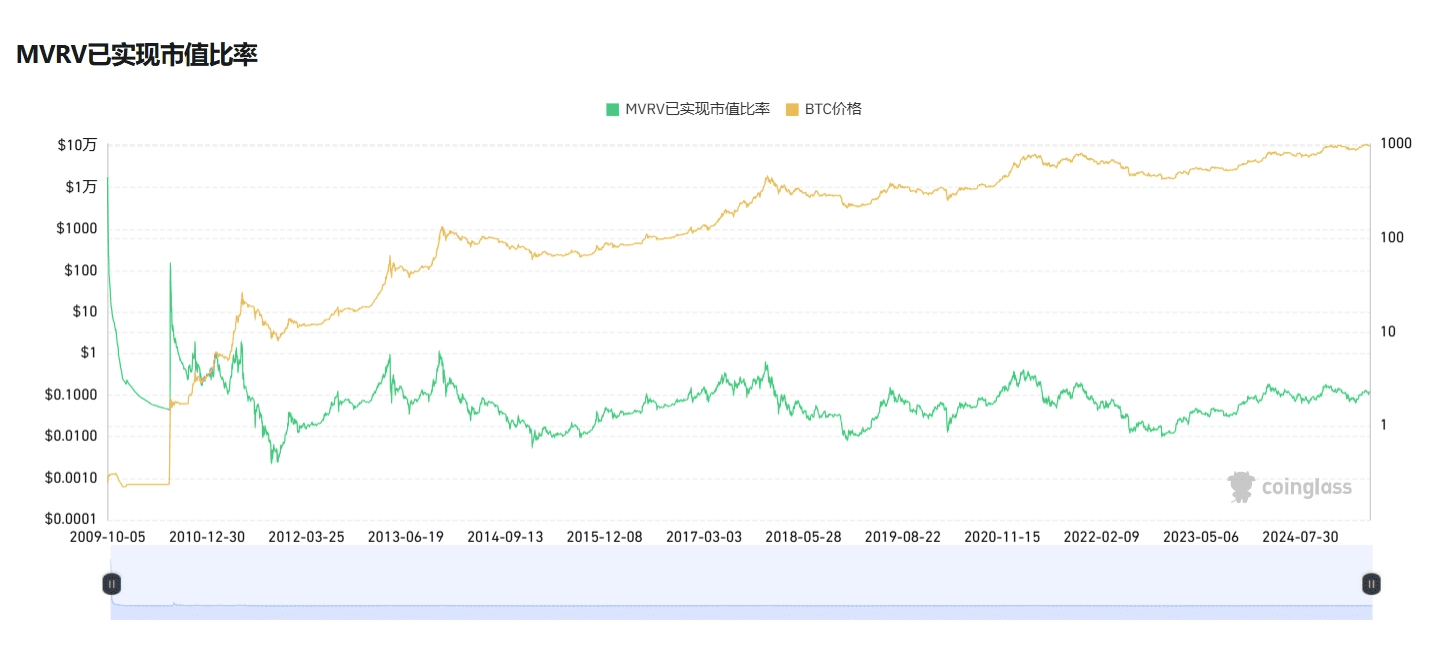
**MVRV Realized Market Value Ratio Indicator Explanation: The MVRV realized market value ratio is an indicator used to assess the cryptocurrency market (especially Bitcoin). It helps investors determine whether an asset is overvalued or undervalued and identify potential market tops and bottoms.
MVRV > 1
When the ratio is greater than 1, it indicates that the market price is above the realized price, meaning most holders are in a profitable state. This may suggest that the market is overheated, especially when MVRV reaches historical highs, which could indicate a market top.
MVRV < 1
When the ratio is less than 1, it indicates that the market price is below the realized price, meaning most holders are in a loss position. This may suggest that the market is undervalued, especially when MVRV reaches historical lows, which could indicate a market bottom.
7. Altcoin Season Index: 22 Is it altcoin season: No, slight recovery from yesterday.
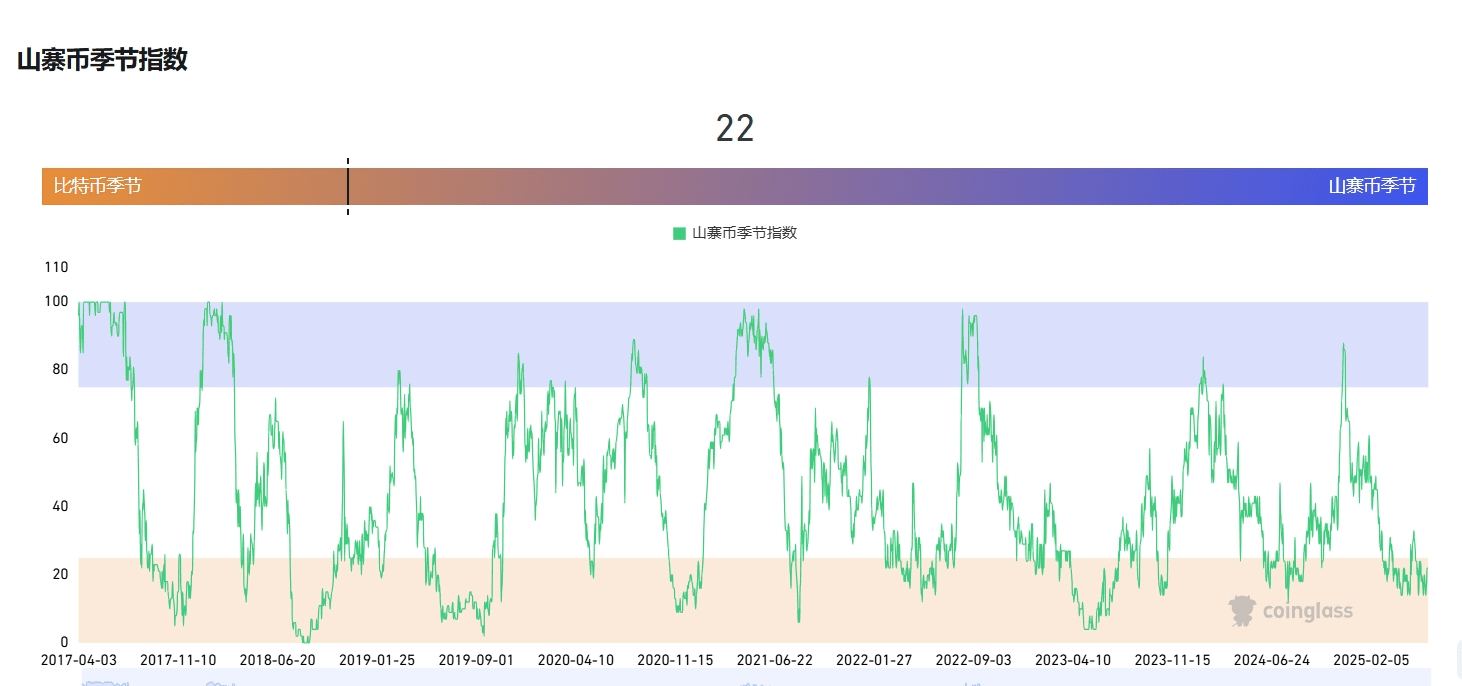
** Explanation of the Altcoin Season Index: The Altcoin Season Index is used to measure the performance of non-Bitcoin cryptocurrencies in the market. It is usually used to determine whether altcoins perform better than Bitcoin within a specific time frame, helping investors understand market trends and investment opportunities.
8. USD inflow into the cryptocurrency market: Small outflow
9. Fiat-backed stablecoin net inflow (USD stablecoin with market cap > 100M): Small outflow.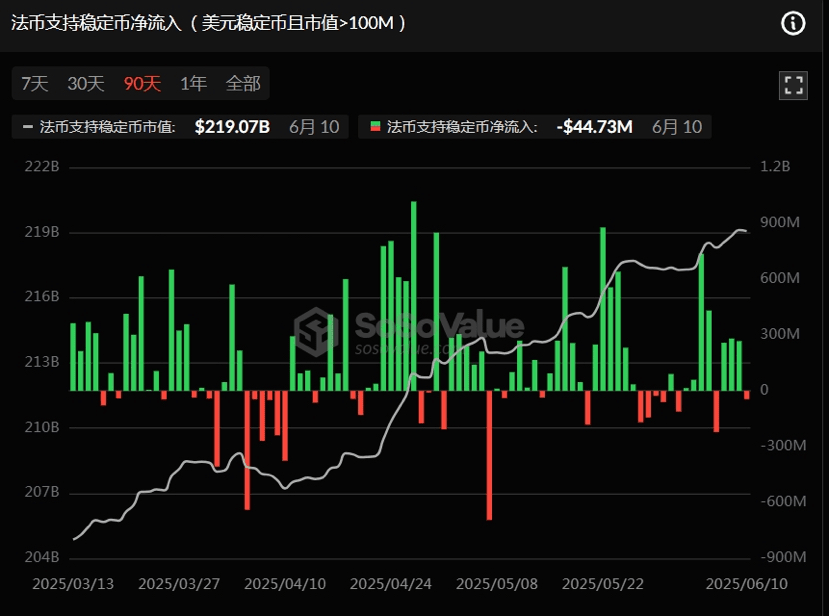
The above data represents an assessment of BTC volatility trends and market sentiment from the perspective of on-chain data and does not constitute any investment advice; please make careful decisions!!

I am a pearl, follow me for daily shares of real-time on-chain data and updates, helping everyone make informed decisions. Exciting content you won't want to miss, feel free to comment and discuss.
