[Daily chart analysis] - Trend pullback is healthy, waiting for a second upward attack
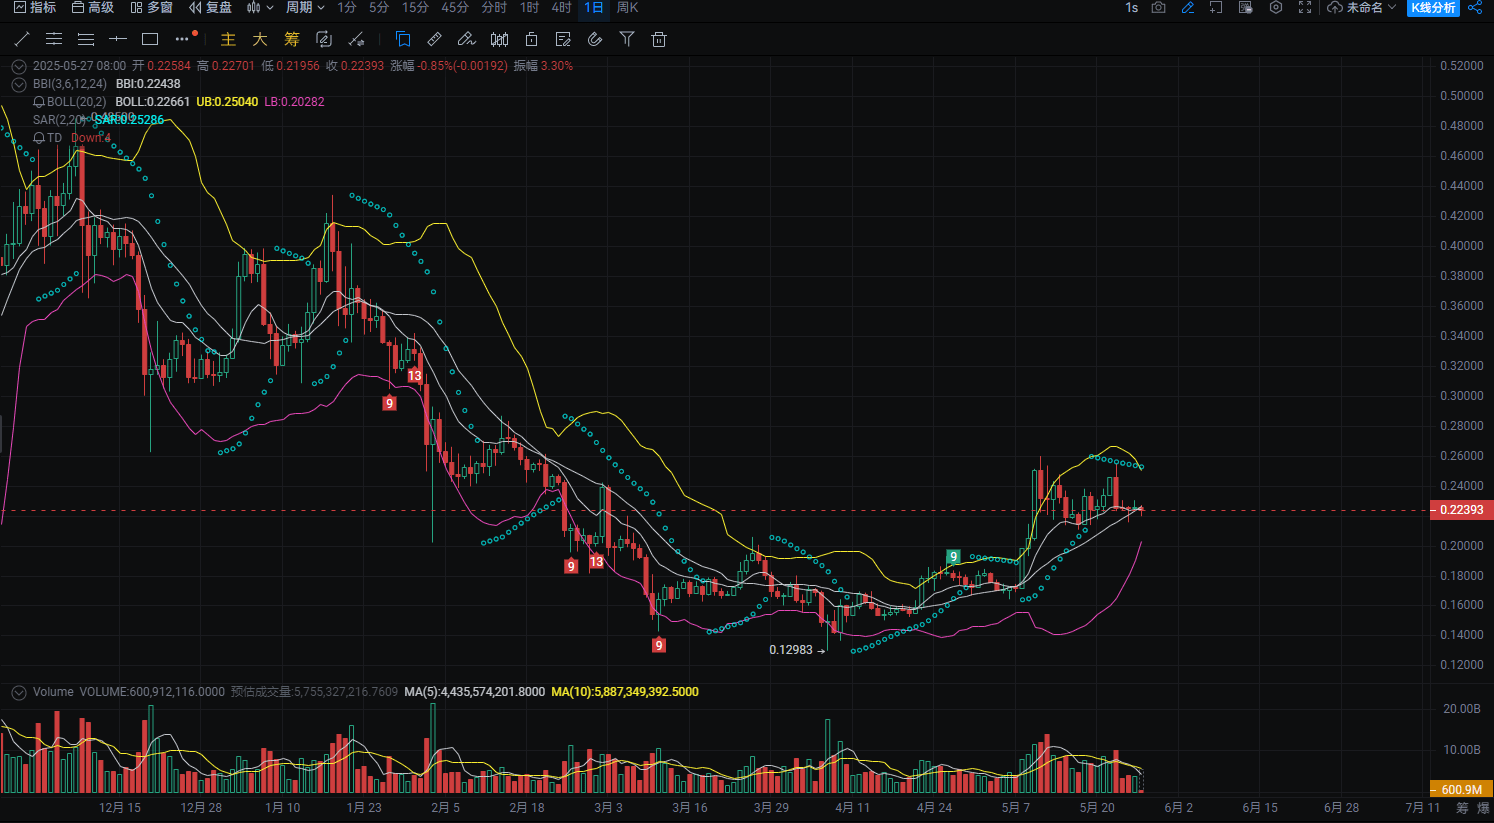
Trend structure: horizontal consolidation after a large bullish breakout, not breaking the middle track, forming a platform oscillation;
BOLL status: the middle track supports at 0.218, and the lower track continues to rise, indicating that the trend has not reversed;
[4-hour chart analysis] - Low-level accumulation, short-term reversal is about to occur
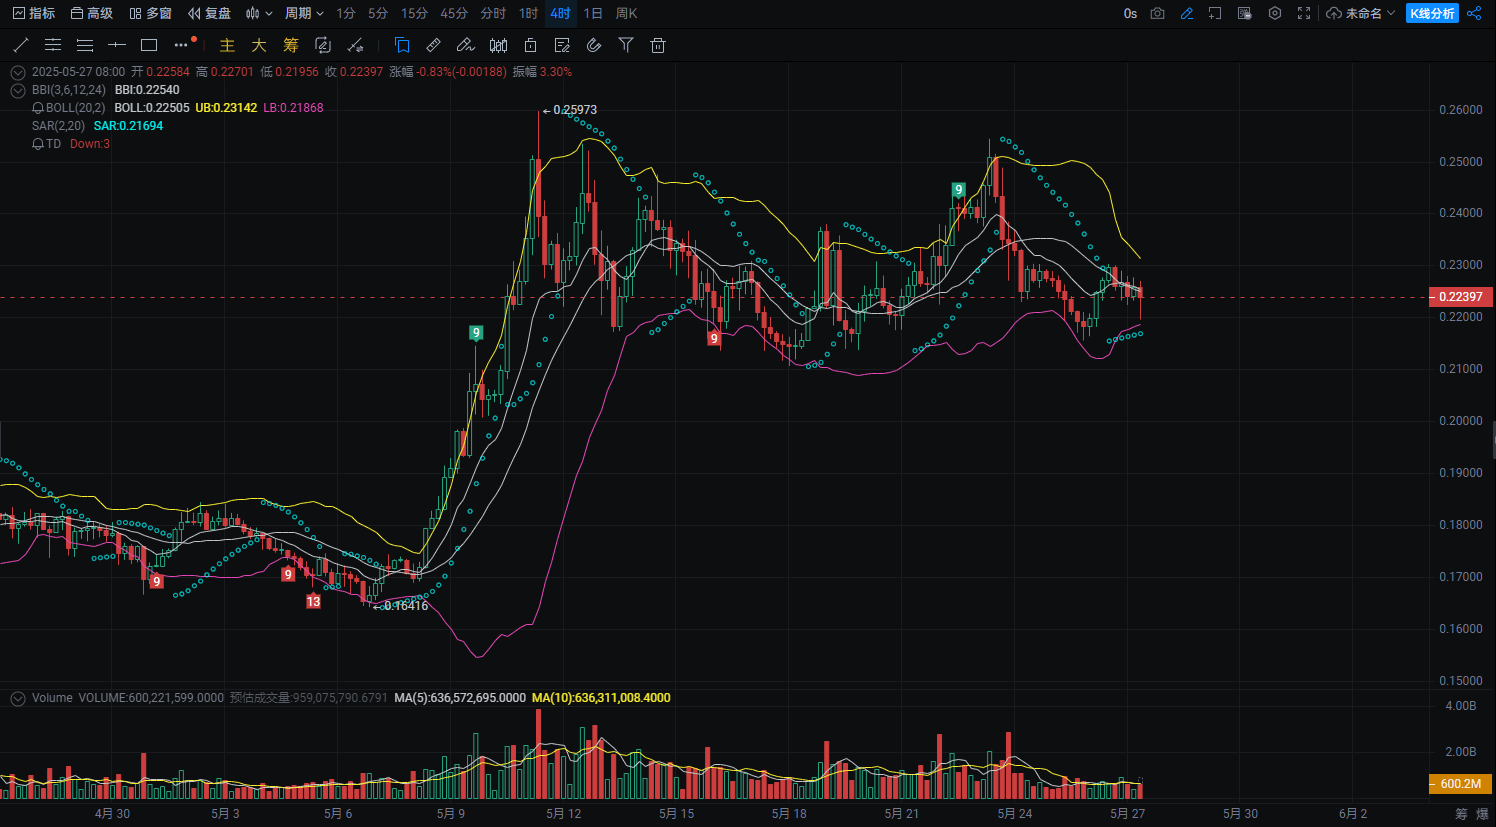
BOLL structure: the middle track and the lower track are converging, forming a triangular convergence structure;
K-line pattern: multiple tests of the previous low without breaking, high possibility of completing the bottom formation.
Currently oscillating near the resistance level of 0.225, can quickly rise after a confirmed breakout.
[1-hour chart analysis] - The small cycle has completed the bottoming, ready to explode at any time
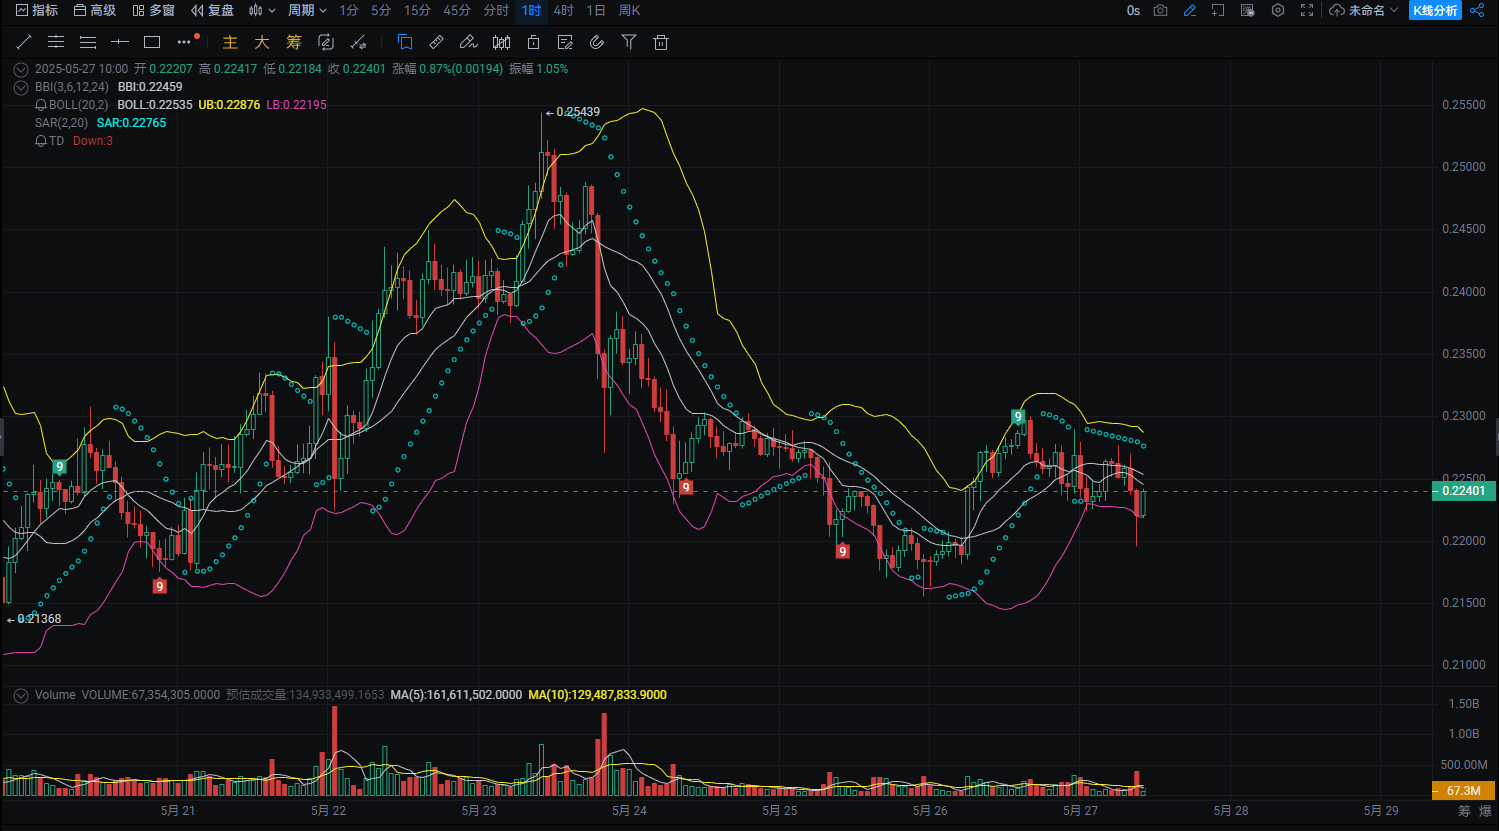
BOLL channel: price is accumulating strength near the middle track, operating at a low level;
The hourly rhythm has been adjusted, and if there is a volume increase, it can act as a trigger for the breakout.
Point strategy setting
Open position 0.224 -
First take profit level 0.228
Second take profit level 0.233
Stop loss level 0.217


