The chart shows a classic breakout pattern on a daily candlestick chart, likely representing a cryptocurrency like BTC (Bitcoin) or ETH (Ethereum), given the context. Here's the breakdown:
1. Resistance Line (Blue): This is a price level where the asset has historically struggled to break through, around the 194.00 mark. The price tested this level multiple times, showing selling pressure each time it approached.
2. Breakout (Green Box): The price eventually breaks above the resistance line with strong bullish momentum, as seen in the large green candlestick. This breakout suggests buyers have overcome the sellers, often signaling a potential uptrend continuation. For $BTC or $ETH , this could indicate a shift in market sentiment, possibly driven by positive news, increased adoption, or macroeconomic factors like inflation fears boosting crypto demand.
3. Protective Stop (Green Line): Traders often place a protective stop-loss below the breakout point, around 192.00 here, to manage risk. If the price falls back below this level, it might indicate a failed breakout, which can happen in volatile markets like BTC and ETH.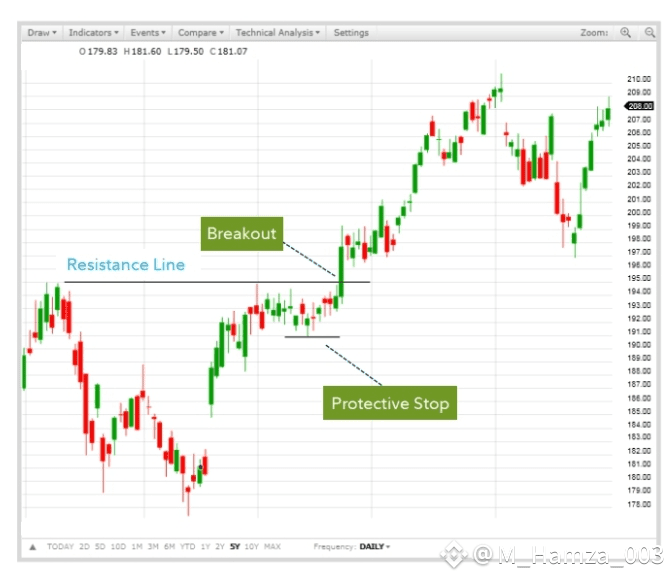
BTC/ETH Context: Breakouts like this in BTC or ETH markets often follow periods of consolidation, especially after major price movements. For instance, if this chart is from early 2025, it might reflect BTC or ETH breaking out after a correction phase following a prior rally (e.g., post-halving for BTC or Ethereum upgrades). The daily timeframe suggests this is a significant move, potentially leading to a new higher high if the breakout holds.
Market Implication: If the breakout sustains, it could attract more buyers, pushing prices higher (e.g., toward 210.00 or beyond). However, BTC and ETH are prone to false breakouts due to high volatility, so confirmation with volume and follow-through candles is key. A protective stop is critical to guard against a reversal, which could be triggered by broader market sell-offs or regulatory news impacting crypto.


