
Bit_Guru
42.5k Posts

Bit_Guru
 Square Verified+
Report
Block User
Only Live Trader on Binance Square 💛 // Binance, CMC & X kols handle @bitgu_ru // PnL is always Live

Live Trader

Creator Awards 2024
Open Trade
Frequent Trader
2.6 Years
63 Following
156.6K+ Followers
300.5K+ Liked
3 Badges
Posts
Portfolio
All
Quotes
Videos
Live
PINNED
·
--
Article
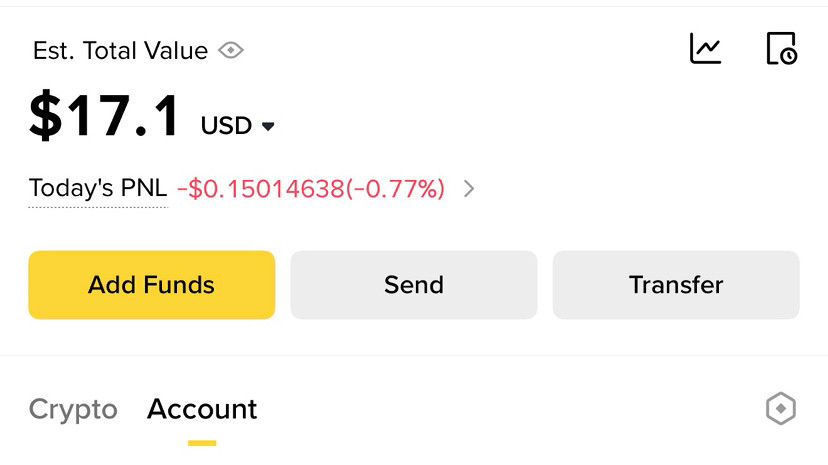
Is it possible to make $100 with only $17Many people think you need a big account to make real money in trading. That’s not true. The truth is simple it’s not about how much you start with, it’s about how you manage what you have.
Yes, it is absolutely possible to turn $17 into $100. But not by luck, not by gambling, and definitely not by chasing every pump you see. It requires discipline, patience, and a clear plan.
First, you need to understand one thing: small capital requires smart execution. You can’t afford big mistakes. One bad trade with high risk can wipe out your account. That’s why risk management becomes your strongest weapon.
Set a daily target. It doesn’t need to be huge. Even 3%–5% per day is enough. It may sound small, but consistency compounds faster than you think. If you stay disciplined, those small wins start building into something big.
Second, patience is everything. You don’t need to trade every day or every setup. Wait for clear opportunities strong support and resistance, clean breakouts, or obvious rejection zones. The market always gives chances, but only patient traders take the right ones.
Third, control your emotions. With a small account, people often overtrade because they want fast results. That’s where most fail. They increase leverage, take random entries, and ignore their plan. You have to do the opposite stay calm, follow your setup, and accept slow growth.
Another important point is consistency over hype. You don’t need one big win. You need many small correct decisions. That’s what builds your account. Even if you grow your account from $17 to $20, then $25, then $35 you are already winning.
Also, protect your capital at all costs. If you lose your account, the journey ends. If you protect it, you always have another chance.
In simple terms:
You don’t grow a small account by rushing
You grow it by repeating a disciplined process again and again
So yes, turning $17 into $100 is possible. But only for those who are willing to stay patient, follow a plan, and trade with control instead of emotion.
The market rewards consistency, not desperation
Start small
Stay focused
And let your discipline do the work
Trade Only coins Like $ETH , $BNB & $SOL
#cryptotradingpro #RiskManagementMastery
{future}(ETHUSDT)
{future}(BNBUSDT)
{future}(SOLUSDT)
Is it possible to make $100 with only $17
Many people think you need a big account to make real money in trading. That’s not true. The truth is simple it’s not about how much you start with, it’s about how you manage what you have.
Yes, it is absolutely possible to turn $17 into $100. But not by luck, not by gambling, and definitely not by chasing every pump you see. It requires discipline, patience, and a clear plan.
First, you need to understand one thing: small capital requires smart execution. You can’t afford big mistakes. One bad trade with high risk can wipe out your account. That’s why risk management becomes your strongest weapon.
Set a daily target. It doesn’t need to be huge. Even 3%–5% per day is enough. It may sound small, but consistency compounds faster than you think. If you stay disciplined, those small wins start building into something big.
Second, patience is everything. You don’t need to trade every day or every setup. Wait for clear opportunities strong support and resistance, clean breakouts, or obvious rejection zones. The market always gives chances, but only patient traders take the right ones.
Third, control your emotions. With a small account, people often overtrade because they want fast results. That’s where most fail. They increase leverage, take random entries, and ignore their plan. You have to do the opposite stay calm, follow your setup, and accept slow growth.
Another important point is consistency over hype. You don’t need one big win. You need many small correct decisions. That’s what builds your account. Even if you grow your account from $17 to $20, then $25, then $35 you are already winning.
Also, protect your capital at all costs. If you lose your account, the journey ends. If you protect it, you always have another chance.
In simple terms:
You don’t grow a small account by rushing
You grow it by repeating a disciplined process again and again
So yes, turning $17 into $100 is possible. But only for those who are willing to stay patient, follow a plan, and trade with control instead of emotion.
The market rewards consistency, not desperation
Start small
Stay focused
And let your discipline do the work
Trade Only coins Like $ETH , $BNB & $SOL
#cryptotradingpro #RiskManagementMastery
Yes, it is absolutely possible to turn $17 into $100. But not by luck, not by gambling, and definitely not by chasing every pump you see. It requires discipline, patience, and a clear plan.
First, you need to understand one thing: small capital requires smart execution. You can’t afford big mistakes. One bad trade with high risk can wipe out your account. That’s why risk management becomes your strongest weapon.
Set a daily target. It doesn’t need to be huge. Even 3%–5% per day is enough. It may sound small, but consistency compounds faster than you think. If you stay disciplined, those small wins start building into something big.
Second, patience is everything. You don’t need to trade every day or every setup. Wait for clear opportunities strong support and resistance, clean breakouts, or obvious rejection zones. The market always gives chances, but only patient traders take the right ones.
Third, control your emotions. With a small account, people often overtrade because they want fast results. That’s where most fail. They increase leverage, take random entries, and ignore their plan. You have to do the opposite stay calm, follow your setup, and accept slow growth.
Another important point is consistency over hype. You don’t need one big win. You need many small correct decisions. That’s what builds your account. Even if you grow your account from $17 to $20, then $25, then $35 you are already winning.
Also, protect your capital at all costs. If you lose your account, the journey ends. If you protect it, you always have another chance.
In simple terms:
You don’t grow a small account by rushing
You grow it by repeating a disciplined process again and again
So yes, turning $17 into $100 is possible. But only for those who are willing to stay patient, follow a plan, and trade with control instead of emotion.
The market rewards consistency, not desperation
Start small
Stay focused
And let your discipline do the work
Trade Only coins Like $ETH , $BNB & $SOL
#cryptotradingpro #RiskManagementMastery
313
55
746
689k
PINNED
·
--
Bullish
It took me 4 years in the crypto market to realize these things & you only need 2 minutes to read: 🤏
1. No matter the market condition, one thing stays the same: 8% of people will own 21 million Bitcoin.
2. Financial, capital, and risk management skills are 100 times more important than technical analysis or crypto research.
3. Earning while you sleep: There are many ways to make money in the crypto market without actively trading.
On average, #Bitcoin has increased more than 100% per year over the past 15 years. Yet, why do so few people make money? Because getting rich quickly is a common mentality. If you can't dedicate at least 4 hours a day to crypto, stick to Bitcoin and ETH—70% in BTC and 30% in ETH.
Trust no one: Trust leads to hope, disappointment, and errors. Learn independently and take responsibility for your actions. This is how to gain automatic minting experience!
The ultimate goal of investing: Make life more meaningful. If crypto investing can achieve that, do it. If not, reconsider.
Crypto is now a financial market: Originally born from technology, it's now influenced by macroeconomics and connected to mainstream financial markets.
People may discourage you from buying Bitcoin, but remember, once something is widely accepted, the opportunity might be gone. Seize your chance now!
Invest wisely, make meaningful choices, and let crypto pave the way to a better future.
#CryptoInvesting #ethbeta #Write2Earn! #BinanceTurns7 $BTC $ETH $SOL
{spot}(SOLUSDT)
{spot}(ETHUSDT)
{spot}(BTCUSDT)
It took me 4 years in the crypto market to realize these things & you only need 2 minutes to read: 🤏
1. No matter the market condition, one thing stays the same: 8% of people will own 21 million Bitcoin.
2. Financial, capital, and risk management skills are 100 times more important than technical analysis or crypto research.
3. Earning while you sleep: There are many ways to make money in the crypto market without actively trading.
On average, #Bitcoin has increased more than 100% per year over the past 15 years. Yet, why do so few people make money? Because getting rich quickly is a common mentality. If you can't dedicate at least 4 hours a day to crypto, stick to Bitcoin and ETH—70% in BTC and 30% in ETH.
Trust no one: Trust leads to hope, disappointment, and errors. Learn independently and take responsibility for your actions. This is how to gain automatic minting experience!
The ultimate goal of investing: Make life more meaningful. If crypto investing can achieve that, do it. If not, reconsider.
Crypto is now a financial market: Originally born from technology, it's now influenced by macroeconomics and connected to mainstream financial markets.
People may discourage you from buying Bitcoin, but remember, once something is widely accepted, the opportunity might be gone. Seize your chance now!
Invest wisely, make meaningful choices, and let crypto pave the way to a better future.
#CryptoInvesting #ethbeta #Write2Earn! #BinanceTurns7 $BTC $ETH $SOL
1. No matter the market condition, one thing stays the same: 8% of people will own 21 million Bitcoin.
2. Financial, capital, and risk management skills are 100 times more important than technical analysis or crypto research.
3. Earning while you sleep: There are many ways to make money in the crypto market without actively trading.
On average, #Bitcoin has increased more than 100% per year over the past 15 years. Yet, why do so few people make money? Because getting rich quickly is a common mentality. If you can't dedicate at least 4 hours a day to crypto, stick to Bitcoin and ETH—70% in BTC and 30% in ETH.
Trust no one: Trust leads to hope, disappointment, and errors. Learn independently and take responsibility for your actions. This is how to gain automatic minting experience!
The ultimate goal of investing: Make life more meaningful. If crypto investing can achieve that, do it. If not, reconsider.
Crypto is now a financial market: Originally born from technology, it's now influenced by macroeconomics and connected to mainstream financial markets.
People may discourage you from buying Bitcoin, but remember, once something is widely accepted, the opportunity might be gone. Seize your chance now!
Invest wisely, make meaningful choices, and let crypto pave the way to a better future.
#CryptoInvesting #ethbeta #Write2Earn! #BinanceTurns7 $BTC $ETH $SOL

302
102
2.2k
1.1M
·
--
$4 caught my eye… 👀🔥 DOWN!
Entry: 0.021495 - 0.021516
SL: 0.021598
TP1: 0.021319 | TP2: 0.021231 | TP3: 0.021143
$4 caught my eye… 👀🔥 DOWN!
Entry: 0.021495 - 0.021516
SL: 0.021598
TP1: 0.021319 | TP2: 0.021231 | TP3: 0.021143
Entry: 0.021495 - 0.021516
SL: 0.021598
TP1: 0.021319 | TP2: 0.021231 | TP3: 0.021143
2
121
·
--
Wait wait wait… 🚨 $LAB DOWN!
Entry: 0.051296 - 0.051347
SL: 0.051484
TP1: 0.051026 | TP2: 0.050891 | TP3: 0.050756
Wait wait wait… 🚨 $LAB DOWN!
Entry: 0.051296 - 0.051347
SL: 0.051484
TP1: 0.051026 | TP2: 0.050891 | TP3: 0.050756
Entry: 0.051296 - 0.051347
SL: 0.051484
TP1: 0.051026 | TP2: 0.050891 | TP3: 0.050756
1
335
·
--
Bullish
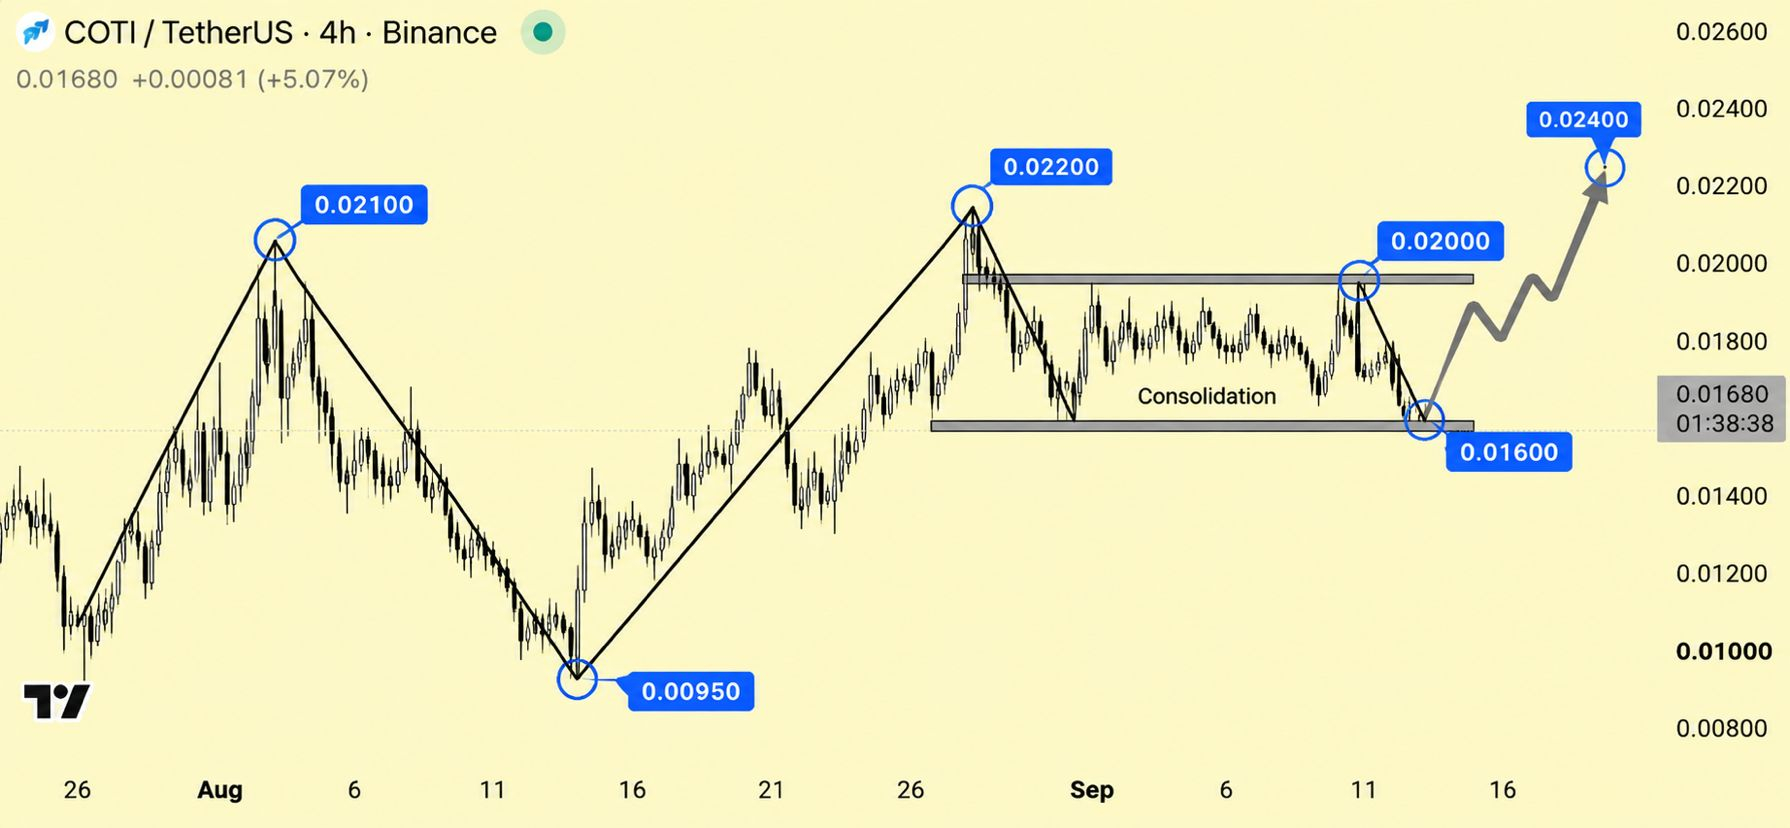
COTI Is Setting Up For Another Push! $COTI is holding the 0.01600 support after a long consolidation and is now showing signs of recovery. If buyers reclaim 0.02000 with strength, the structure can open the way toward 0.02200 and potentially 0.02400 as the next major target.
{future}(COTIUSDT)
COTI Is Setting Up For Another Push! $COTI is holding the 0.01600 support after a long consolidation and is now showing signs of recovery. If buyers reclaim 0.02000 with strength, the structure can open the way toward 0.02200 and potentially 0.02400 as the next major target.
2
241
·
--
This $LA setup is hot… ‼️🔥 UP!
Entry: 0.071832 - 0.071904
SL: 0.071548
TP1: 0.07258 | TP2: 0.072918 | TP3: 0.073256
This $LA setup is hot… ‼️🔥 UP!
Entry: 0.071832 - 0.071904
SL: 0.071548
TP1: 0.07258 | TP2: 0.072918 | TP3: 0.073256
Entry: 0.071832 - 0.071904
SL: 0.071548
TP1: 0.07258 | TP2: 0.072918 | TP3: 0.073256
364
·
--
Guys, watch $FIL closely… 🔥 UP!
Entry: 0.98772 - 0.98871
SL: 0.98602
TP1: 0.99443 | TP2: 0.9973 | TP3: 1.0002
Guys, watch $FIL closely… 🔥 UP!
Entry: 0.98772 - 0.98871
SL: 0.98602
TP1: 0.99443 | TP2: 0.9973 | TP3: 1.0002
Entry: 0.98772 - 0.98871
SL: 0.98602
TP1: 0.99443 | TP2: 0.9973 | TP3: 1.0002
508
·
--
Don’t miss $RENDER … ‼️ DOWN move!
Entry: 1.3807 - 1.3821
SL: 1.391
TP1: 1.3608 | TP2: 1.3509 | TP3: 1.3409
Don’t miss $RENDER … ‼️ DOWN move!
Entry: 1.3807 - 1.3821
SL: 1.391
TP1: 1.3608 | TP2: 1.3509 | TP3: 1.3409
Entry: 1.3807 - 1.3821
SL: 1.391
TP1: 1.3608 | TP2: 1.3509 | TP3: 1.3409
1
404
·
--
POLYXUSDT Technical Review: Scanner Signals, Key Levels and Market Risks𝗣𝗢𝗟𝗬𝗫 𝗲𝗻𝘁𝗲𝗿𝘀 𝘁𝗵𝗲 𝘀𝗰𝗮𝗻𝗻𝗲𝗿’𝘀 𝗳𝗼𝗰𝘂𝘀
POLYXUSDT is appearing on the scanner after a period of unusually wide price movement, with the immediate structure leaning lower. The scanner classified POLYX as a top loser and produced a SHORT setup with a confidence score of 98.67. That score describes the scanner’s internal reading; it does not establish certainty about the next move.
At the scanner timestamp of September 14, 2026, POLYX was quoted near 0.03963 USDT. The scanner recorded a 15-minute decline of approximately 0.95%, while its hot-list data showed a 12.805% decline for the selected move window. Binance market data showed a last price of 0.03959, an open of 0.04012 and a daily change of -1.321%. CoinGecko reported a price near 0.03972 and a 24-hour decline of 5.14%.
These figures are not identical because they come from different snapshots and market aggregations. Even so, they point to the same broad condition: POLYX has recently been volatile and is trading below its recent short-term highs.
𝗪𝗵𝗮𝘁 𝗣𝗼𝗹𝘆𝗺𝗲𝘀𝗵 𝗶𝘀 𝗱𝗲𝘀𝗶𝗴𝗻𝗲𝗱 𝘁𝗼 𝗱𝗼
The supplied project data describes Polymesh as an institutional-grade, permissioned blockchain built specifically for regulated assets. Its stated focus is the real-world asset market, with an emphasis on governance, identity, compliance, confidentiality and settlement.
Polymesh is built on the Substrate framework and uses a Nominated Proof of Stake consensus algorithm. The supplied data places the project in the Layer 1, smart-contract-platform, real-world-asset and RWA-protocol categories.
That gives Polymesh a clearly defined technical and market position. It is presented as a specialized network for regulated assets rather than as a broad, category-neutral blockchain. However, the research does not verify a founding date, named founders, a launch timeline or a detailed institutional adoption history. Those points should not be inferred from the available information.
The same limitation applies to current network activity. The supplied research does not include verified figures for active addresses, transaction growth, tokenized asset value, developer activity or the number of live applications. The project’s purpose is documented, but the dataset does not establish the current scale of its ecosystem.
𝗣𝗢𝗟𝗬𝗫 𝘂𝘁𝗶𝗹𝗶𝘁𝘆 𝗿𝗲𝗺𝗮𝗶𝗻𝘀 𝗽𝗮𝗿𝘁𝗶𝗮𝗹𝗹𝘆 𝘂𝗻𝗱𝗲𝗳𝗶𝗻𝗲𝗱
The POLYX token is associated with the Polymesh network, but the available research does not provide a complete official utility schedule. It confirms the connection between POLYX and Polymesh, along with the network’s Substrate foundation, Nominated Proof of Stake design and real-world-asset focus.
It does not provide a verified breakdown of how much POLYX is used for transaction fees, staking, governance, service access or other network functions. That missing detail is important because the long-term economic role of a token depends partly on how directly network activity creates demand for it.
The supplied data also does not include current validator requirements, governance rules, application activity or usage-based demand measures. As a result, the ecosystem thesis can be described, but the research does not support a stronger conclusion about the token’s present utility or adoption.
𝗦𝘂𝗽𝗽𝗹𝘆 𝗮𝗻𝗱 𝗺𝗮𝗿𝗸𝗲𝘁-𝗰𝗮𝗽 𝗰𝗼𝗻𝘁𝗲𝘅𝘁
POLYX has a reported circulating supply of 1,318,316,181 tokens. The same figure is listed as total supply, while maximum supply is unavailable and described as infinite. CoinGecko reports a market capitalization of approximately 52.48 million US dollars, a market-cap rank of 438 and a fully diluted valuation equal to the reported market capitalization.
The matching market-cap and fully diluted valuation figures do not show a separate large future dilution amount in the supplied snapshot. They do not, however, remove the need to monitor future issuance because maximum supply is not listed and is described as infinite.
Binance recorded approximately 16.95 million USDT in 24-hour quote volume, while CoinGecko reported about 22.29 million US dollars in total volume across its tracked markets. This is substantial trading activity compared with a market capitalization near 52 million dollars. At the same time, a market of this size can respond quickly when liquidity changes or traders move in the same direction.
CoinGecko reports that POLYX remains far below its all-time high of 0.748771 dollars, recorded on March 31, 2024. The token was approximately 94.7% below that high in the supplied data. CoinGecko also lists an all-time low of 0.027562 dollars from August 18, 2026. The token is therefore above its recent low but still far below its historical peak.
Recent gains should be viewed in that context. CoinGecko reports price changes of 6.76% over seven days, 19.69% over 14 days and 36.05% over 30 days, while the 200-day and one-year changes remain negative at -8.54% and -71.04%. The data describes a strong recent rebound inside a much weaker longer-term performance profile.
𝗧𝗵𝗲 𝗰𝗵𝗮𝗿𝘁 𝘀𝘁𝗿𝘂𝗰𝘁𝘂𝗿𝗲 𝗯𝗲𝗵𝗶𝗻𝗱 𝘁𝗵𝗲 𝘀𝗰𝗮𝗻𝗻𝗲𝗿
The short-term chart shows a large expansion in range followed by a retreat. On the four-hour data, POLYX moved from an open near 0.04200 to a high of 0.04654 and a low of 0.03835 in one major candle window, closing near 0.03868. Later four-hour candles recovered toward 0.04356 and 0.04484, but price then fell back toward 0.03958.
This is not a clean, steady trend. It is a wide, two-sided market in which sharp rallies have been followed by sharp retracements. The hourly candles show a similar pattern. POLYX briefly reached 0.04484 before moving down through the 0.042, 0.041 and 0.040 areas. The latest hourly data showed price near 0.03958, with a recent high around 0.03982 and a low around 0.03948.
The recovery from the 0.03773 intraday low did not yet establish a durable higher low above the recent rejection zone. Price remains close to support, but the chart has not confirmed that buyers have regained control.
The scanner’s volume ratio was 0.7308, meaning the current move was not accompanied by volume above its comparison baseline. That reading is not decisive by itself. It can indicate that selling pressure is losing energy, but it can also show that buyers are not providing enough urgency to reverse the decline. The raw chart does not settle that question without additional volume and order-book information.
𝗞𝗲𝘆 𝗹𝗲𝘃𝗲𝗹𝘀 𝗮𝗻𝗱 𝘀𝗰𝗮𝗻𝗻𝗲𝗿 𝗶𝗻𝘃𝗮𝗹𝗶𝗱𝗮𝘁𝗶𝗼𝗻
The scanner places its short-entry zone between 0.0396498 and 0.0396894. The scanner price of 0.03963 was already slightly below that band, so the location of any later move matters. A return into the entry zone followed by rejection would match the scanner’s stated structure more closely than an immediate breakdown well below it.
The first nearby resistance is 0.03981, followed by the scanner stop level at 0.039947. A sustained move above 0.039947 would invalidate the stated short structure. That level sits just above the recent hourly trading area and provides a clear reference for judging whether sellers are defending the failed recovery.
On the downside, the scanner lists support at 0.0394056, followed by reference levels at 0.0390791, 0.0387938 and 0.0385085. These levels are tightly grouped because POLYX is trading in a compressed range after a much larger volatility burst.
The scanner reports a risk-reward ratio of 2.2154. That figure belongs to the defined entry, stop and target levels. It does not account for execution quality, slippage or whether price will reach any of the listed targets.
The central technical question is whether POLYX can remain below 0.03981 and fail to reclaim 0.039947. If that happens, the lower support and reference levels become relevant. If price moves back through the invalidation area, the short structure loses credibility and the market may be attempting another move toward the recent 0.04068 to 0.04229 region.
𝗕𝗶𝘁𝗰𝗼𝗶𝗻 𝗶𝘀 𝗳𝗶𝗿𝗺, 𝗯𝘂𝘁 𝗣𝗢𝗟𝗬𝗫 𝗶𝘀 𝗻𝗼𝘁 𝗳𝗼𝗹𝗹𝗼𝘄𝗶𝗻𝗴
The broader market backdrop is mixed. Bitcoin was quoted around 77,604.30 dollars in the supplied Binance data, up 1.194% over 24 hours, with a session high of 78,343.80 and a low of 76,350.10. Bitcoin was therefore holding a positive daily move while POLYX was trading lower.
That relative weakness is one reason the POLYX setup has attracted short-term scanner attention. It does not mean POLYX must continue falling. Smaller tokens can lag Bitcoin during a market rotation and later respond if broader risk appetite spreads into altcoins. The divergence can also reflect token-specific selling, profit-taking after a rally or changing liquidity.
The most measured interpretation is that POLYX has not confirmed Bitcoin’s strength. BTC is firm in the supplied snapshot, but POLYX has not held its recent upper range. A stronger Bitcoin move could improve market sentiment, while a reversal from the 78,343.80 high could add pressure to an already unstable altcoin chart.
𝗥𝗶𝘀𝗸𝘀 𝗮𝗻𝗱 𝗺𝗶𝘀𝘀𝗶𝗻𝗴 𝗰𝗮𝘁𝗮𝗹𝘆𝘀𝘁𝘀
The supplied research contains no recent verified news items or specific catalyst announcements for POLYX. It does not confirm a partnership, exchange event, protocol upgrade, token unlock announcement, institutional product launch or adoption milestone. That absence does not prove that no such event exists; it means the dataset does not support claiming one.
The main fundamental risk is the gap between the network’s stated purpose and measurable usage. Polymesh has a documented focus on regulated real-world assets, but the available data does not show current tokenized asset value, transaction growth, application revenue, active users or developer metrics. Without those figures, the long-term case remains partly based on the project’s stated direction rather than demonstrated scale in this dataset.
Supply is another consideration. Maximum supply is unavailable and described as infinite. Although circulating supply and total supply are listed at the same level, future issuance, distribution changes or staking economics could affect the token’s market profile.
Market structure adds a separate risk. POLYX has experienced a large decline from its all-time high, while the recent rebound has occurred alongside wide hourly and four-hour ranges. Such conditions can produce rapid reversals and false breakouts.
There are also data-quality differences between feeds. The scanner price, Binance price and CoinGecko price are slightly different, and the reported 24-hour percentage changes do not match. Comparisons are more useful when they use the same venue, timestamp and market type.
𝗪𝗵𝗮𝘁 𝘁𝗼 𝘄𝗮𝘁𝗰𝗵 𝗻𝗲𝘅𝘁
The first area to monitor is the 0.03981 to 0.039947 zone. Rejection below that area would keep the scanner’s bearish structure intact, while a sustained reclaim would weaken it. The 0.0394056 support level is the first downside test. A break could expose the 0.0390791, 0.0387938 and 0.0385085 reference levels, although each would need to be assessed against fresh volume and market conditions.
Volume deserves particular attention. The 0.7308 ratio is not strong confirmation of the decline. If price falls while volume expands, the breakdown would appear more forceful. If price falls on shrinking activity and quickly reclaims support, the move could reflect exhaustion rather than continuation.
Open interest was reported at 50,463,120 POLYX, but the snapshot does not provide a time series. It therefore cannot show whether positions are being added or closed. That limits what can be concluded about leverage and positioning.
The wider checklist includes Bitcoin’s ability to hold its current range, the behavior of other real-world-asset tokens, any verified Polymesh development update and evidence of real network usage. Those factors could influence whether the recent rebound develops further or remains a volatile recovery.
The balanced conclusion is that POLYX has a clearly defined regulated-asset mission and a technically active market, while the scanner has identified a precise short-term structure. At the same time, the token’s long-term decline, uncertain maximum supply, missing ecosystem metrics and lack of verified current catalysts leave important questions unresolved. For now, the key chart decision is whether POLYX reclaims 0.039947 or continues rotating toward the scanner’s lower reference levels.
POLYXUSDT Technical Review: Scanner Signals, Key Levels and Market Risks
𝗣𝗢𝗟𝗬𝗫 𝗲𝗻𝘁𝗲𝗿𝘀 𝘁𝗵𝗲 𝘀𝗰𝗮𝗻𝗻𝗲𝗿’𝘀 𝗳𝗼𝗰𝘂𝘀
POLYXUSDT is appearing on the scanner after a period of unusually wide price movement, with the immediate structure leaning lower. The scanner classified POLYX as a top loser and produced a SHORT setup with a confidence score of 98.67. That score describes the scanner’s internal reading; it does not establish certainty about the next move.
At the scanner timestamp of September 14, 2026, POLYX was quoted near 0.03963 USDT. The scanner recorded a 15-minute decline of approximately 0.95%, while its hot-list data showed a 12.805% decline for the selected move window. Binance market data showed a last price of 0.03959, an open of 0.04012 and a daily change of -1.321%. CoinGecko reported a price near 0.03972 and a 24-hour decline of 5.14%.
These figures are not identical because they come from different snapshots and market aggregations. Even so, they point to the same broad condition: POLYX has recently been volatile and is trading below its recent short-term highs.
𝗪𝗵𝗮𝘁 𝗣𝗼𝗹𝘆𝗺𝗲𝘀𝗵 𝗶𝘀 𝗱𝗲𝘀𝗶𝗴𝗻𝗲𝗱 𝘁𝗼 𝗱𝗼
The supplied project data describes Polymesh as an institutional-grade, permissioned blockchain built specifically for regulated assets. Its stated focus is the real-world asset market, with an emphasis on governance, identity, compliance, confidentiality and settlement.
Polymesh is built on the Substrate framework and uses a Nominated Proof of Stake consensus algorithm. The supplied data places the project in the Layer 1, smart-contract-platform, real-world-asset and RWA-protocol categories.
That gives Polymesh a clearly defined technical and market position. It is presented as a specialized network for regulated assets rather than as a broad, category-neutral blockchain. However, the research does not verify a founding date, named founders, a launch timeline or a detailed institutional adoption history. Those points should not be inferred from the available information.
The same limitation applies to current network activity. The supplied research does not include verified figures for active addresses, transaction growth, tokenized asset value, developer activity or the number of live applications. The project’s purpose is documented, but the dataset does not establish the current scale of its ecosystem.
𝗣𝗢𝗟𝗬𝗫 𝘂𝘁𝗶𝗹𝗶𝘁𝘆 𝗿𝗲𝗺𝗮𝗶𝗻𝘀 𝗽𝗮𝗿𝘁𝗶𝗮𝗹𝗹𝘆 𝘂𝗻𝗱𝗲𝗳𝗶𝗻𝗲𝗱
The POLYX token is associated with the Polymesh network, but the available research does not provide a complete official utility schedule. It confirms the connection between POLYX and Polymesh, along with the network’s Substrate foundation, Nominated Proof of Stake design and real-world-asset focus.
It does not provide a verified breakdown of how much POLYX is used for transaction fees, staking, governance, service access or other network functions. That missing detail is important because the long-term economic role of a token depends partly on how directly network activity creates demand for it.
The supplied data also does not include current validator requirements, governance rules, application activity or usage-based demand measures. As a result, the ecosystem thesis can be described, but the research does not support a stronger conclusion about the token’s present utility or adoption.
𝗦𝘂𝗽𝗽𝗹𝘆 𝗮𝗻𝗱 𝗺𝗮𝗿𝗸𝗲𝘁-𝗰𝗮𝗽 𝗰𝗼𝗻𝘁𝗲𝘅𝘁
POLYX has a reported circulating supply of 1,318,316,181 tokens. The same figure is listed as total supply, while maximum supply is unavailable and described as infinite. CoinGecko reports a market capitalization of approximately 52.48 million US dollars, a market-cap rank of 438 and a fully diluted valuation equal to the reported market capitalization.
The matching market-cap and fully diluted valuation figures do not show a separate large future dilution amount in the supplied snapshot. They do not, however, remove the need to monitor future issuance because maximum supply is not listed and is described as infinite.
Binance recorded approximately 16.95 million USDT in 24-hour quote volume, while CoinGecko reported about 22.29 million US dollars in total volume across its tracked markets. This is substantial trading activity compared with a market capitalization near 52 million dollars. At the same time, a market of this size can respond quickly when liquidity changes or traders move in the same direction.
CoinGecko reports that POLYX remains far below its all-time high of 0.748771 dollars, recorded on March 31, 2024. The token was approximately 94.7% below that high in the supplied data. CoinGecko also lists an all-time low of 0.027562 dollars from August 18, 2026. The token is therefore above its recent low but still far below its historical peak.
Recent gains should be viewed in that context. CoinGecko reports price changes of 6.76% over seven days, 19.69% over 14 days and 36.05% over 30 days, while the 200-day and one-year changes remain negative at -8.54% and -71.04%. The data describes a strong recent rebound inside a much weaker longer-term performance profile.
𝗧𝗵𝗲 𝗰𝗵𝗮𝗿𝘁 𝘀𝘁𝗿𝘂𝗰𝘁𝘂𝗿𝗲 𝗯𝗲𝗵𝗶𝗻𝗱 𝘁𝗵𝗲 𝘀𝗰𝗮𝗻𝗻𝗲𝗿
The short-term chart shows a large expansion in range followed by a retreat. On the four-hour data, POLYX moved from an open near 0.04200 to a high of 0.04654 and a low of 0.03835 in one major candle window, closing near 0.03868. Later four-hour candles recovered toward 0.04356 and 0.04484, but price then fell back toward 0.03958.
This is not a clean, steady trend. It is a wide, two-sided market in which sharp rallies have been followed by sharp retracements. The hourly candles show a similar pattern. POLYX briefly reached 0.04484 before moving down through the 0.042, 0.041 and 0.040 areas. The latest hourly data showed price near 0.03958, with a recent high around 0.03982 and a low around 0.03948.
The recovery from the 0.03773 intraday low did not yet establish a durable higher low above the recent rejection zone. Price remains close to support, but the chart has not confirmed that buyers have regained control.
The scanner’s volume ratio was 0.7308, meaning the current move was not accompanied by volume above its comparison baseline. That reading is not decisive by itself. It can indicate that selling pressure is losing energy, but it can also show that buyers are not providing enough urgency to reverse the decline. The raw chart does not settle that question without additional volume and order-book information.
𝗞𝗲𝘆 𝗹𝗲𝘃𝗲𝗹𝘀 𝗮𝗻𝗱 𝘀𝗰𝗮𝗻𝗻𝗲𝗿 𝗶𝗻𝘃𝗮𝗹𝗶𝗱𝗮𝘁𝗶𝗼𝗻
The scanner places its short-entry zone between 0.0396498 and 0.0396894. The scanner price of 0.03963 was already slightly below that band, so the location of any later move matters. A return into the entry zone followed by rejection would match the scanner’s stated structure more closely than an immediate breakdown well below it.
The first nearby resistance is 0.03981, followed by the scanner stop level at 0.039947. A sustained move above 0.039947 would invalidate the stated short structure. That level sits just above the recent hourly trading area and provides a clear reference for judging whether sellers are defending the failed recovery.
On the downside, the scanner lists support at 0.0394056, followed by reference levels at 0.0390791, 0.0387938 and 0.0385085. These levels are tightly grouped because POLYX is trading in a compressed range after a much larger volatility burst.
The scanner reports a risk-reward ratio of 2.2154. That figure belongs to the defined entry, stop and target levels. It does not account for execution quality, slippage or whether price will reach any of the listed targets.
The central technical question is whether POLYX can remain below 0.03981 and fail to reclaim 0.039947. If that happens, the lower support and reference levels become relevant. If price moves back through the invalidation area, the short structure loses credibility and the market may be attempting another move toward the recent 0.04068 to 0.04229 region.
𝗕𝗶𝘁𝗰𝗼𝗶𝗻 𝗶𝘀 𝗳𝗶𝗿𝗺, 𝗯𝘂𝘁 𝗣𝗢𝗟𝗬𝗫 𝗶𝘀 𝗻𝗼𝘁 𝗳𝗼𝗹𝗹𝗼𝘄𝗶𝗻𝗴
The broader market backdrop is mixed. Bitcoin was quoted around 77,604.30 dollars in the supplied Binance data, up 1.194% over 24 hours, with a session high of 78,343.80 and a low of 76,350.10. Bitcoin was therefore holding a positive daily move while POLYX was trading lower.
That relative weakness is one reason the POLYX setup has attracted short-term scanner attention. It does not mean POLYX must continue falling. Smaller tokens can lag Bitcoin during a market rotation and later respond if broader risk appetite spreads into altcoins. The divergence can also reflect token-specific selling, profit-taking after a rally or changing liquidity.
The most measured interpretation is that POLYX has not confirmed Bitcoin’s strength. BTC is firm in the supplied snapshot, but POLYX has not held its recent upper range. A stronger Bitcoin move could improve market sentiment, while a reversal from the 78,343.80 high could add pressure to an already unstable altcoin chart.
𝗥𝗶𝘀𝗸𝘀 𝗮𝗻𝗱 𝗺𝗶𝘀𝘀𝗶𝗻𝗴 𝗰𝗮𝘁𝗮𝗹𝘆𝘀𝘁𝘀
The supplied research contains no recent verified news items or specific catalyst announcements for POLYX. It does not confirm a partnership, exchange event, protocol upgrade, token unlock announcement, institutional product launch or adoption milestone. That absence does not prove that no such event exists; it means the dataset does not support claiming one.
The main fundamental risk is the gap between the network’s stated purpose and measurable usage. Polymesh has a documented focus on regulated real-world assets, but the available data does not show current tokenized asset value, transaction growth, application revenue, active users or developer metrics. Without those figures, the long-term case remains partly based on the project’s stated direction rather than demonstrated scale in this dataset.
Supply is another consideration. Maximum supply is unavailable and described as infinite. Although circulating supply and total supply are listed at the same level, future issuance, distribution changes or staking economics could affect the token’s market profile.
Market structure adds a separate risk. POLYX has experienced a large decline from its all-time high, while the recent rebound has occurred alongside wide hourly and four-hour ranges. Such conditions can produce rapid reversals and false breakouts.
There are also data-quality differences between feeds. The scanner price, Binance price and CoinGecko price are slightly different, and the reported 24-hour percentage changes do not match. Comparisons are more useful when they use the same venue, timestamp and market type.
𝗪𝗵𝗮𝘁 𝘁𝗼 𝘄𝗮𝘁𝗰𝗵 𝗻𝗲𝘅𝘁
The first area to monitor is the 0.03981 to 0.039947 zone. Rejection below that area would keep the scanner’s bearish structure intact, while a sustained reclaim would weaken it. The 0.0394056 support level is the first downside test. A break could expose the 0.0390791, 0.0387938 and 0.0385085 reference levels, although each would need to be assessed against fresh volume and market conditions.
Volume deserves particular attention. The 0.7308 ratio is not strong confirmation of the decline. If price falls while volume expands, the breakdown would appear more forceful. If price falls on shrinking activity and quickly reclaims support, the move could reflect exhaustion rather than continuation.
Open interest was reported at 50,463,120 POLYX, but the snapshot does not provide a time series. It therefore cannot show whether positions are being added or closed. That limits what can be concluded about leverage and positioning.
The wider checklist includes Bitcoin’s ability to hold its current range, the behavior of other real-world-asset tokens, any verified Polymesh development update and evidence of real network usage. Those factors could influence whether the recent rebound develops further or remains a volatile recovery.
The balanced conclusion is that POLYX has a clearly defined regulated-asset mission and a technically active market, while the scanner has identified a precise short-term structure. At the same time, the token’s long-term decline, uncertain maximum supply, missing ecosystem metrics and lack of verified current catalysts leave important questions unresolved. For now, the key chart decision is whether POLYX reclaims 0.039947 or continues rotating toward the scanner’s lower reference levels.
POLYXUSDT is appearing on the scanner after a period of unusually wide price movement, with the immediate structure leaning lower. The scanner classified POLYX as a top loser and produced a SHORT setup with a confidence score of 98.67. That score describes the scanner’s internal reading; it does not establish certainty about the next move.
At the scanner timestamp of September 14, 2026, POLYX was quoted near 0.03963 USDT. The scanner recorded a 15-minute decline of approximately 0.95%, while its hot-list data showed a 12.805% decline for the selected move window. Binance market data showed a last price of 0.03959, an open of 0.04012 and a daily change of -1.321%. CoinGecko reported a price near 0.03972 and a 24-hour decline of 5.14%.
These figures are not identical because they come from different snapshots and market aggregations. Even so, they point to the same broad condition: POLYX has recently been volatile and is trading below its recent short-term highs.
𝗪𝗵𝗮𝘁 𝗣𝗼𝗹𝘆𝗺𝗲𝘀𝗵 𝗶𝘀 𝗱𝗲𝘀𝗶𝗴𝗻𝗲𝗱 𝘁𝗼 𝗱𝗼
The supplied project data describes Polymesh as an institutional-grade, permissioned blockchain built specifically for regulated assets. Its stated focus is the real-world asset market, with an emphasis on governance, identity, compliance, confidentiality and settlement.
Polymesh is built on the Substrate framework and uses a Nominated Proof of Stake consensus algorithm. The supplied data places the project in the Layer 1, smart-contract-platform, real-world-asset and RWA-protocol categories.
That gives Polymesh a clearly defined technical and market position. It is presented as a specialized network for regulated assets rather than as a broad, category-neutral blockchain. However, the research does not verify a founding date, named founders, a launch timeline or a detailed institutional adoption history. Those points should not be inferred from the available information.
The same limitation applies to current network activity. The supplied research does not include verified figures for active addresses, transaction growth, tokenized asset value, developer activity or the number of live applications. The project’s purpose is documented, but the dataset does not establish the current scale of its ecosystem.
𝗣𝗢𝗟𝗬𝗫 𝘂𝘁𝗶𝗹𝗶𝘁𝘆 𝗿𝗲𝗺𝗮𝗶𝗻𝘀 𝗽𝗮𝗿𝘁𝗶𝗮𝗹𝗹𝘆 𝘂𝗻𝗱𝗲𝗳𝗶𝗻𝗲𝗱
The POLYX token is associated with the Polymesh network, but the available research does not provide a complete official utility schedule. It confirms the connection between POLYX and Polymesh, along with the network’s Substrate foundation, Nominated Proof of Stake design and real-world-asset focus.
It does not provide a verified breakdown of how much POLYX is used for transaction fees, staking, governance, service access or other network functions. That missing detail is important because the long-term economic role of a token depends partly on how directly network activity creates demand for it.
The supplied data also does not include current validator requirements, governance rules, application activity or usage-based demand measures. As a result, the ecosystem thesis can be described, but the research does not support a stronger conclusion about the token’s present utility or adoption.
𝗦𝘂𝗽𝗽𝗹𝘆 𝗮𝗻𝗱 𝗺𝗮𝗿𝗸𝗲𝘁-𝗰𝗮𝗽 𝗰𝗼𝗻𝘁𝗲𝘅𝘁
POLYX has a reported circulating supply of 1,318,316,181 tokens. The same figure is listed as total supply, while maximum supply is unavailable and described as infinite. CoinGecko reports a market capitalization of approximately 52.48 million US dollars, a market-cap rank of 438 and a fully diluted valuation equal to the reported market capitalization.
The matching market-cap and fully diluted valuation figures do not show a separate large future dilution amount in the supplied snapshot. They do not, however, remove the need to monitor future issuance because maximum supply is not listed and is described as infinite.
Binance recorded approximately 16.95 million USDT in 24-hour quote volume, while CoinGecko reported about 22.29 million US dollars in total volume across its tracked markets. This is substantial trading activity compared with a market capitalization near 52 million dollars. At the same time, a market of this size can respond quickly when liquidity changes or traders move in the same direction.
CoinGecko reports that POLYX remains far below its all-time high of 0.748771 dollars, recorded on March 31, 2024. The token was approximately 94.7% below that high in the supplied data. CoinGecko also lists an all-time low of 0.027562 dollars from August 18, 2026. The token is therefore above its recent low but still far below its historical peak.
Recent gains should be viewed in that context. CoinGecko reports price changes of 6.76% over seven days, 19.69% over 14 days and 36.05% over 30 days, while the 200-day and one-year changes remain negative at -8.54% and -71.04%. The data describes a strong recent rebound inside a much weaker longer-term performance profile.
𝗧𝗵𝗲 𝗰𝗵𝗮𝗿𝘁 𝘀𝘁𝗿𝘂𝗰𝘁𝘂𝗿𝗲 𝗯𝗲𝗵𝗶𝗻𝗱 𝘁𝗵𝗲 𝘀𝗰𝗮𝗻𝗻𝗲𝗿
The short-term chart shows a large expansion in range followed by a retreat. On the four-hour data, POLYX moved from an open near 0.04200 to a high of 0.04654 and a low of 0.03835 in one major candle window, closing near 0.03868. Later four-hour candles recovered toward 0.04356 and 0.04484, but price then fell back toward 0.03958.
This is not a clean, steady trend. It is a wide, two-sided market in which sharp rallies have been followed by sharp retracements. The hourly candles show a similar pattern. POLYX briefly reached 0.04484 before moving down through the 0.042, 0.041 and 0.040 areas. The latest hourly data showed price near 0.03958, with a recent high around 0.03982 and a low around 0.03948.
The recovery from the 0.03773 intraday low did not yet establish a durable higher low above the recent rejection zone. Price remains close to support, but the chart has not confirmed that buyers have regained control.
The scanner’s volume ratio was 0.7308, meaning the current move was not accompanied by volume above its comparison baseline. That reading is not decisive by itself. It can indicate that selling pressure is losing energy, but it can also show that buyers are not providing enough urgency to reverse the decline. The raw chart does not settle that question without additional volume and order-book information.
𝗞𝗲𝘆 𝗹𝗲𝘃𝗲𝗹𝘀 𝗮𝗻𝗱 𝘀𝗰𝗮𝗻𝗻𝗲𝗿 𝗶𝗻𝘃𝗮𝗹𝗶𝗱𝗮𝘁𝗶𝗼𝗻
The scanner places its short-entry zone between 0.0396498 and 0.0396894. The scanner price of 0.03963 was already slightly below that band, so the location of any later move matters. A return into the entry zone followed by rejection would match the scanner’s stated structure more closely than an immediate breakdown well below it.
The first nearby resistance is 0.03981, followed by the scanner stop level at 0.039947. A sustained move above 0.039947 would invalidate the stated short structure. That level sits just above the recent hourly trading area and provides a clear reference for judging whether sellers are defending the failed recovery.
On the downside, the scanner lists support at 0.0394056, followed by reference levels at 0.0390791, 0.0387938 and 0.0385085. These levels are tightly grouped because POLYX is trading in a compressed range after a much larger volatility burst.
The scanner reports a risk-reward ratio of 2.2154. That figure belongs to the defined entry, stop and target levels. It does not account for execution quality, slippage or whether price will reach any of the listed targets.
The central technical question is whether POLYX can remain below 0.03981 and fail to reclaim 0.039947. If that happens, the lower support and reference levels become relevant. If price moves back through the invalidation area, the short structure loses credibility and the market may be attempting another move toward the recent 0.04068 to 0.04229 region.
𝗕𝗶𝘁𝗰𝗼𝗶𝗻 𝗶𝘀 𝗳𝗶𝗿𝗺, 𝗯𝘂𝘁 𝗣𝗢𝗟𝗬𝗫 𝗶𝘀 𝗻𝗼𝘁 𝗳𝗼𝗹𝗹𝗼𝘄𝗶𝗻𝗴
The broader market backdrop is mixed. Bitcoin was quoted around 77,604.30 dollars in the supplied Binance data, up 1.194% over 24 hours, with a session high of 78,343.80 and a low of 76,350.10. Bitcoin was therefore holding a positive daily move while POLYX was trading lower.
That relative weakness is one reason the POLYX setup has attracted short-term scanner attention. It does not mean POLYX must continue falling. Smaller tokens can lag Bitcoin during a market rotation and later respond if broader risk appetite spreads into altcoins. The divergence can also reflect token-specific selling, profit-taking after a rally or changing liquidity.
The most measured interpretation is that POLYX has not confirmed Bitcoin’s strength. BTC is firm in the supplied snapshot, but POLYX has not held its recent upper range. A stronger Bitcoin move could improve market sentiment, while a reversal from the 78,343.80 high could add pressure to an already unstable altcoin chart.
𝗥𝗶𝘀𝗸𝘀 𝗮𝗻𝗱 𝗺𝗶𝘀𝘀𝗶𝗻𝗴 𝗰𝗮𝘁𝗮𝗹𝘆𝘀𝘁𝘀
The supplied research contains no recent verified news items or specific catalyst announcements for POLYX. It does not confirm a partnership, exchange event, protocol upgrade, token unlock announcement, institutional product launch or adoption milestone. That absence does not prove that no such event exists; it means the dataset does not support claiming one.
The main fundamental risk is the gap between the network’s stated purpose and measurable usage. Polymesh has a documented focus on regulated real-world assets, but the available data does not show current tokenized asset value, transaction growth, application revenue, active users or developer metrics. Without those figures, the long-term case remains partly based on the project’s stated direction rather than demonstrated scale in this dataset.
Supply is another consideration. Maximum supply is unavailable and described as infinite. Although circulating supply and total supply are listed at the same level, future issuance, distribution changes or staking economics could affect the token’s market profile.
Market structure adds a separate risk. POLYX has experienced a large decline from its all-time high, while the recent rebound has occurred alongside wide hourly and four-hour ranges. Such conditions can produce rapid reversals and false breakouts.
There are also data-quality differences between feeds. The scanner price, Binance price and CoinGecko price are slightly different, and the reported 24-hour percentage changes do not match. Comparisons are more useful when they use the same venue, timestamp and market type.
𝗪𝗵𝗮𝘁 𝘁𝗼 𝘄𝗮𝘁𝗰𝗵 𝗻𝗲𝘅𝘁
The first area to monitor is the 0.03981 to 0.039947 zone. Rejection below that area would keep the scanner’s bearish structure intact, while a sustained reclaim would weaken it. The 0.0394056 support level is the first downside test. A break could expose the 0.0390791, 0.0387938 and 0.0385085 reference levels, although each would need to be assessed against fresh volume and market conditions.
Volume deserves particular attention. The 0.7308 ratio is not strong confirmation of the decline. If price falls while volume expands, the breakdown would appear more forceful. If price falls on shrinking activity and quickly reclaims support, the move could reflect exhaustion rather than continuation.
Open interest was reported at 50,463,120 POLYX, but the snapshot does not provide a time series. It therefore cannot show whether positions are being added or closed. That limits what can be concluded about leverage and positioning.
The wider checklist includes Bitcoin’s ability to hold its current range, the behavior of other real-world-asset tokens, any verified Polymesh development update and evidence of real network usage. Those factors could influence whether the recent rebound develops further or remains a volatile recovery.
The balanced conclusion is that POLYX has a clearly defined regulated-asset mission and a technically active market, while the scanner has identified a precise short-term structure. At the same time, the token’s long-term decline, uncertain maximum supply, missing ecosystem metrics and lack of verified current catalysts leave important questions unresolved. For now, the key chart decision is whether POLYX reclaims 0.039947 or continues rotating toward the scanner’s lower reference levels.
1
321
·
--
Guys, watch $POLYX closely… 🔥 DOWN!
Entry: 0.03965 - 0.039689
SL: 0.039947
TP1: 0.039079 | TP2: 0.038794 | TP3: 0.038508
Guys, watch $POLYX closely… 🔥 DOWN!
Entry: 0.03965 - 0.039689
SL: 0.039947
TP1: 0.039079 | TP2: 0.038794 | TP3: 0.038508
Entry: 0.03965 - 0.039689
SL: 0.039947
TP1: 0.039079 | TP2: 0.038794 | TP3: 0.038508
2
414
·
--
Look at $FLOCK … 👀🚨 DOWN setup!
Entry: 0.068864 - 0.068933
SL: 0.069181
TP1: 0.068233 | TP2: 0.067917 | TP3: 0.067601
Look at $FLOCK … 👀🚨 DOWN setup!
Entry: 0.068864 - 0.068933
SL: 0.069181
TP1: 0.068233 | TP2: 0.067917 | TP3: 0.067601
Entry: 0.068864 - 0.068933
SL: 0.069181
TP1: 0.068233 | TP2: 0.067917 | TP3: 0.067601
508
·
--
Wait… $POWR is getting serious! ⚡ DOWN!
Entry: 0.05995 - 0.06001
SL: 0.060399
TP1: 0.059087 | TP2: 0.058656 | TP3: 0.058224
Wait… $POWR is getting serious! ⚡ DOWN!
Entry: 0.05995 - 0.06001
SL: 0.060399
TP1: 0.059087 | TP2: 0.058656 | TP3: 0.058224
Entry: 0.05995 - 0.06001
SL: 0.060399
TP1: 0.059087 | TP2: 0.058656 | TP3: 0.058224
304
·
--
This $ARK setup is hot… ‼️🔥 DOWN!
Entry: 0.16668 - 0.16685
SL: 0.16793
TP1: 0.16428 | TP2: 0.16308 | TP3: 0.16189
This $ARK setup is hot… ‼️🔥 DOWN!
Entry: 0.16668 - 0.16685
SL: 0.16793
TP1: 0.16428 | TP2: 0.16308 | TP3: 0.16189
Entry: 0.16668 - 0.16685
SL: 0.16793
TP1: 0.16428 | TP2: 0.16308 | TP3: 0.16189
481
·
--
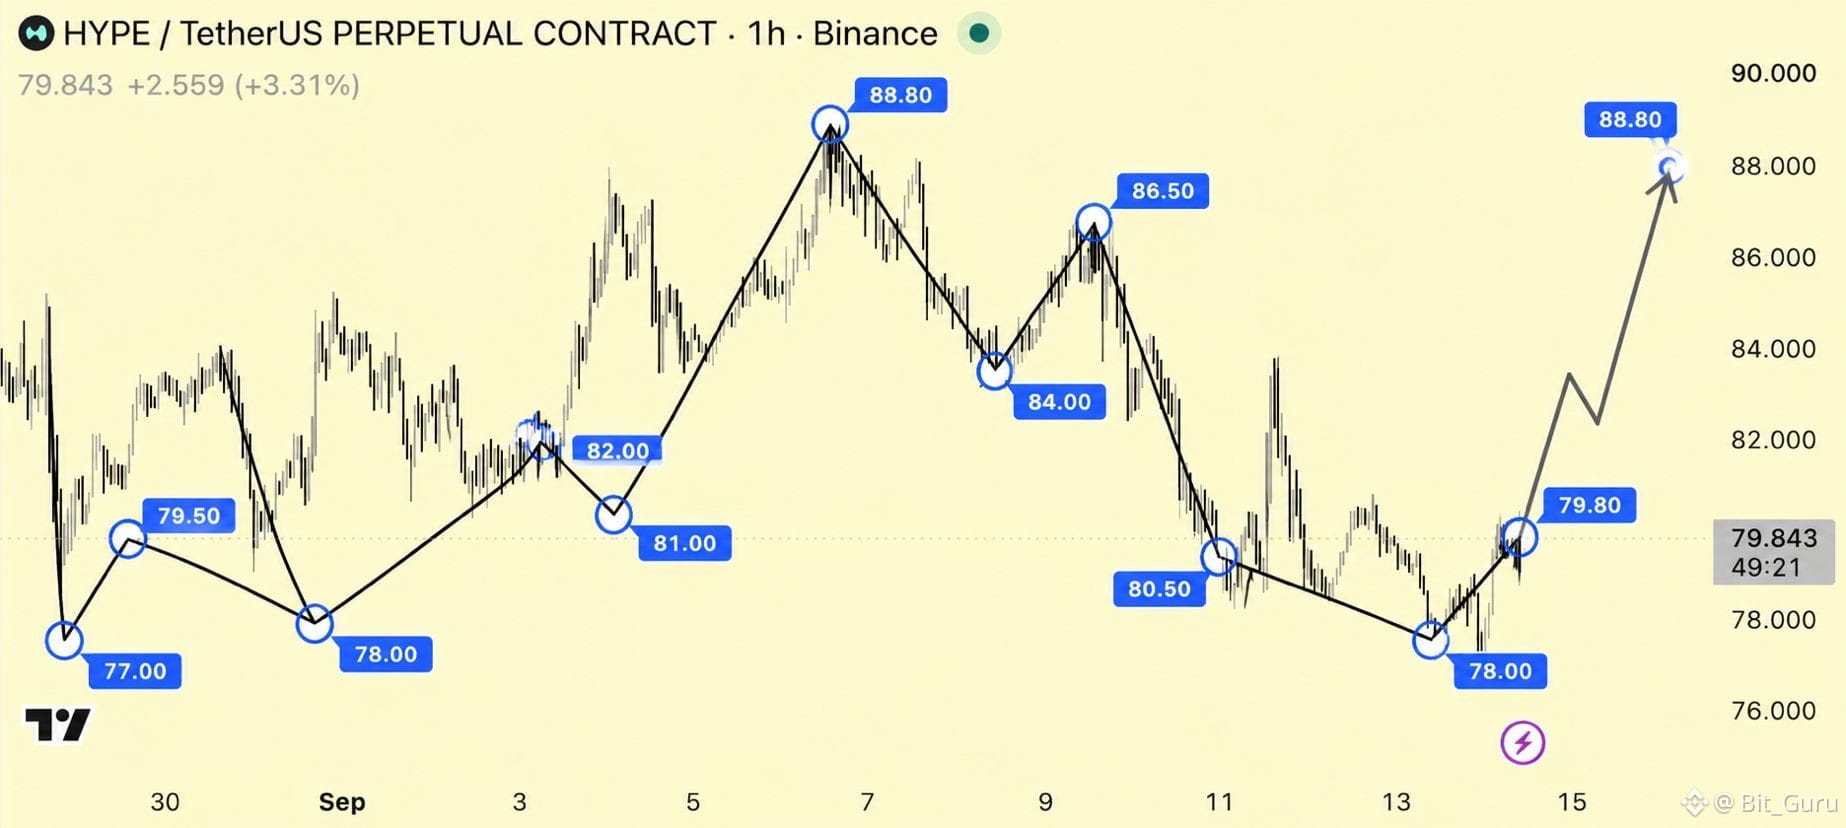
$HYPE Is Showing A Strong Recovery! HYPE has bounced from the 78.00 area and reclaimed 79.80, forming a fresh higher low after the recent selloff. If buyers hold this structure, a move toward 82.00 and then 86.50 is possible, with 88.80 as the major upside target.
{future}(HYPEUSDT)
$HYPE Is Showing A Strong Recovery! HYPE has bounced from the 78.00 area and reclaimed 79.80, forming a fresh higher low after the recent selloff. If buyers hold this structure, a move toward 82.00 and then 86.50 is possible, with 88.80 as the major upside target.
249
·
--
Guys, watch $WAXP closely… 🔥 UP!
Entry: 0.00556664 - 0.00557221
SL: 0.00553435
TP1: 0.00564210 | TP2: 0.00567705 | TP3: 0.00571200
Guys, watch $WAXP closely… 🔥 UP!
Entry: 0.00556664 - 0.00557221
SL: 0.00553435
TP1: 0.00564210 | TP2: 0.00567705 | TP3: 0.00571200
Entry: 0.00556664 - 0.00557221
SL: 0.00553435
TP1: 0.00564210 | TP2: 0.00567705 | TP3: 0.00571200
485
·
--
UBUSDT Analysis: Momentum, Key Levels, and Unibase’s Unfinished Fundamental Case𝗧𝗵𝗲 𝗳𝗶𝗿𝘀𝘁 𝗰𝗹𝘂𝗲 𝗶𝘀 𝘁𝗵𝗲 𝗽𝗿𝗶𝗰𝗲 𝗮𝗰𝘁𝗶𝗼𝗻, 𝗻𝗼𝘁 𝘁𝗵𝗲 𝘀𝘁𝗼𝗿𝘆
UBUSDT appeared on the RR Trader scanner with a LONG direction, a confidence score of 100, and a TOP_GAINER ranking of 12. That makes it notable from a short-term market perspective, but the chart is more complicated than a simple straight-line rally. Unibase, the project associated with the UB token, is categorized in the artificial intelligence and infrastructure sectors, while the token has recently experienced a sharp increase in price and a volatile recovery.
The exchange ticker shows UBUSDT at 0.134160, up 13.522 percent over 24 hours, with a high of 0.140390 and a low of 0.117830. CoinGecko’s separate snapshot lists UB at 0.134621 and a 13.86073 percent daily gain. Those figures were collected from different sources and at different times, so the difference is expected. It also shows that the exact quoted price depends on the venue and timestamp.
The central question is not simply whether the move can continue. It is whether buyers can defend the higher trading range after the first wave of momentum fades. The recent chart includes a strong advance, a sharp rejection, and a partial recovery toward the current market area.
𝗪𝗵𝗮𝘁 𝗨𝗻𝗶𝗯𝗮𝘀𝗲 𝘀𝗮𝘆𝘀 𝗶𝘁 𝗶𝘀 𝗯𝘂𝗶𝗹𝗱𝗶𝗻𝗴
According to the project description in the research data, Unibase describes itself as a decentralized AI memory layer. It is designed to provide AI agents with long-term memory and cross-platform interoperability, enabling them to retain information, learn, evolve, and collaborate more autonomously. The broader ambition is an Open Agent Internet: a modular, verifiable, and composable ecosystem of on-chain AI agents.
That description places Unibase at the intersection of AI agents, memory, data availability, and blockchain infrastructure. The project’s stated objective is to provide a foundation that allows agents to preserve useful context and interact across platforms. Its categories include Artificial Intelligence, Infrastructure, Ethereum Ecosystem, Data Availability, AI Framework, the x402 Ecosystem, and Binance Alpha Spotlight.
Those statements describe the project’s intended role rather than confirming that the complete vision has already been delivered. The supplied research does not verify Unibase’s active user base, number of deployed agents, production usage, revenue, or network performance. It also does not provide a verified founding history, team background, funding record, or detailed launch timeline. Those omissions matter when separating the underlying idea from measurable adoption.
𝗨𝗕 𝘂𝘁𝗶𝗹𝗶𝘁𝘆 𝗮𝗻𝗱 𝘁𝗵𝗲 𝗲𝗰𝗼𝘀𝘆𝘀𝘁𝗲𝗺 𝗮𝗿𝗼𝘂𝗻𝗱 𝗶𝘁
The practical utility of UB is not fully detailed in the supplied research. No verified breakdown explains whether the token is used for storage payments, agent execution, data access, staking, governance, network security, or transaction fees. It is therefore more accurate to describe UB as the token associated with Unibase’s AI memory and agent-infrastructure concept, while leaving its exact live economic functions open for further confirmation.
The research includes token contract references on Ethereum and BNB Chain, indicating that UB has a multichain presence. However, the existence of contracts does not independently establish deep cross-chain usage, a functioning bridge, or broad ecosystem adoption. The research also identifies a project website, documentation, an official social account, and a GitHub organization, but it does not provide developer activity metrics or independently verified application usage.
For an infrastructure project, those missing details are important. The narrative explains what Unibase aims to build, while usage data would show how much of that system is already operating. The available research supports the existence of the project’s stated direction, but it does not establish the scale of its current ecosystem.
𝗦𝘂𝗽𝗽𝗹𝘆, 𝗺𝗮𝗿𝗸𝗲𝘁 𝗰𝗮𝗽𝗶𝘁𝗮𝗹𝗶𝘇𝗮𝘁𝗶𝗼𝗻, 𝗮𝗻𝗱 𝗱𝗶𝗹𝘂𝘁𝗶𝗼𝗻
The tokenomics data lists a maximum supply of 10 billion UB and a circulating supply of 2.5 billion. The reported circulating portion is therefore 25 percent of the maximum supply. CoinGecko lists a market capitalization of approximately 336.55 million dollars, a market-cap rank of 127, and a fully diluted valuation of approximately 1.346 billion dollars. The reported market-cap-to-FDV ratio is 0.25, matching the circulating-supply figure.
This distinction is important when assessing UBUSDT. Market capitalization reflects the tokens reported as circulating, while fully diluted valuation applies the current price to the entire maximum supply. If additional tokens enter circulation, the supply available in the market may increase. The research does not include an unlock calendar, allocation breakdown, vesting schedule, or information about treasury and investor holdings, so the timing and size of future supply changes are unavailable.
CoinGecko reports approximately 15.26 million dollars in total 24-hour volume. The exchange ticker reports quote volume of approximately 12.79 million dollars and volume of 97.17 million UB. These figures indicate active trading, but they do not show how concentrated the activity is across venues or whether it is mostly spot or derivatives trading.
The market also reports open interest of 29,999,333 for UBUSDT. Because the unit and venue context are not specified, that figure is best treated as an indication of active leveraged-market participation rather than a precise measure of bullish conviction.
𝗧𝗵𝗲 𝗿𝗲𝗰𝗲𝗻𝘁 𝗰𝗵𝗮𝗿𝘁 𝘀𝘁𝗿𝘂𝗰𝘁𝘂𝗿𝗲
The hourly data shows an advance from the 0.11808 to 0.11835 area toward 0.14039. Early candles climbed through 0.12172, 0.12447, 0.12731, and 0.13060, with trading activity increasing during the move. Price then reached 0.13370 and later extended to 0.13856 and 0.14039 on the hourly record.
The market did not hold the first peak. A high-volume hourly candle traded between 0.12555 and 0.13678 and closed around 0.12724. That was a large rejection and showed that sellers became active above the mid-0.13 region. Price then stabilized through several hours between roughly 0.128 and 0.134 before recovering toward the current market area.
On the four-hour view, the sequence appears as an impulse rally followed by a volatile retracement and a partial recovery. The four-hour low of 0.11682 is a broader reference, while 0.12555 marks the deepest low of the sharp pullback in the recent sequence. The current move is constructive in the narrow sense that price reclaimed 0.13000 and returned toward 0.13400, but it is not a low-volatility advance. The wide candle ranges show that both buyers and sellers remain active.
The scanner records a 15-minute move of 0.6396 percent and a volume ratio of 0.6179. The positive short-term move supports the scanner’s bullish setup, while the sub-one volume ratio indicates that immediate momentum was not accompanied by unusually high volume against its comparison baseline. That does not invalidate the setup, but it means a sustained move would require additional participation.
𝗪𝗵𝗮𝘁 𝘁𝗵𝗲 𝘀𝗰𝗮𝗻𝗻𝗲𝗿 𝗶𝘀 𝗵𝗶𝗴𝗵𝗹𝗶𝗴𝗵𝘁𝗶𝗻𝗴
The RR Trader setup places support at 0.13177 and resistance at 0.13370. Its proposed entry zone is 0.131971745 to 0.132103915, with a stop level at 0.1311774286. The scanner lists upside reference points at 0.1338905436, 0.1347838579, and 0.1356771721, and calculates a risk-reward figure of approximately 1.93. These are scanner outputs rather than independently confirmed forecasts.
The setup is notable because its proposed entry area sits just above the scanner’s support. The model is therefore focused on buyers defending the recent base instead of relying on a continuation after the token’s move toward 0.14039. The first upside reference is close to the listed resistance, while the second and third references would require price to recover more of the rejected range.
At the time of the exchange ticker snapshot, price was 0.134160, already above the scanner’s resistance at 0.13370. There are two straightforward interpretations. Price may be beginning to break through resistance, or it may have moved beyond the preferred zone and be vulnerable to a pullback toward support. The scanner was created at 10:00 UTC, while the broader market data was updated later, so timing may explain part of the difference.
The key technical test is whether 0.13370 changes from overhead resistance into support. Holding above that level would strengthen the bullish reading. A move below 0.13177 would weaken it, while a break below 0.1311774286 would invalidate the scanner’s defined setup. These levels describe the model’s structure; they do not determine how the market must behave.
𝗕𝗶𝘁𝗰𝗼𝗶𝗻 𝗮𝗻𝗱 𝘁𝗵𝗲 𝗯𝗿𝗼𝗮𝗱𝗲𝗿 𝗺𝗮𝗿𝗸𝗲𝘁
The supplied BTCUSDT ticker shows Bitcoin at 77,764.40, up 1.469 percent over 24 hours, with a range from 76,350.10 to 78,343.80 and quote volume of more than 8.22 billion dollars. Bitcoin’s daily move is considerably smaller than UB’s, so the two assets are showing different levels of short-term performance.
UB is down 2.6792 percent over seven days, up 10.6762 percent over 14 days, and up 66.53428 percent over 60 days. This combination places the current rally inside a mixed short-term structure and a stronger medium-term performance record. It also confirms that the advance has not been uniform across each measurement period.
The supplied research does not identify a market-wide catalyst specifically explaining the UBUSDT move. The two recent news items concern a proposed United States crypto market-structure bill and a reported Revolut data breach. Neither is presented as a Unibase announcement or a direct UB catalyst, so connecting either item to the rally would be speculative.
𝗪𝗵𝗮𝘁 𝗰𝗼𝘂𝗹𝗱 𝗰𝗵𝗮𝗻𝗴𝗲 𝘁𝗵𝗲 𝗻𝗲𝘅𝘁 𝗺𝗼𝘃𝗲
The technical case would become stronger if buyers defended the 0.13177 to 0.13210 area during a retest, if price held above 0.13370, and if advancing candles attracted greater volume. A sustained move above 0.13370 could bring the scanner’s 0.13389, 0.13478, and 0.13568 references into focus. A return toward 0.13856 to 0.14039 would test the recent rejection area rather than automatically confirming continuation.
From a fundamental perspective, evidence of working AI memory products, agent deployments, developer activity, user growth, or clear token utility would make the project’s stated concept more measurable. None of those developments is confirmed in the supplied data, so they remain areas for observation rather than explanations of the current price.
The main market risks are visible in the available figures. The recent chart has shown a wide range, including a rapid move from the 0.14000 area toward 0.12555. Only 25 percent of the maximum token supply is reported as circulating, and no unlock schedule is provided. The future supply profile is therefore not fully defined in the research.
The supplied data also does not provide an audit status, security history, token-holder concentration, or details of administrative controls. Those are unresolved due-diligence questions. The presence of contracts on more than one chain also does not independently establish the extent of cross-chain usage or the security of any related infrastructure.
𝗟𝗲𝘃𝗲𝗹𝘀 𝗮𝗻𝗱 𝗲𝘃𝗶𝗱𝗲𝗻𝗰𝗲 𝘁𝗼 𝘄𝗮𝘁𝗰𝗵
In the immediate structure, 0.13370 is the first pivotal level because it is the scanner’s resistance and sits close to the current price. Above it, 0.13389, 0.13478, and 0.13568 are the scanner’s successive upside references. The recent hourly high at 0.14039 is a larger resistance reference and the clearest test of whether the market is continuing or only recovering.
On the downside, 0.13177 is the first scanner support, followed by the 0.13118 invalidation level. The broader chart provides additional references around 0.12800, 0.12555, and 0.11682. Losing the first two levels would weaken the short-term structure. A deeper move toward 0.12555 would place the recent recovery under greater pressure, while 0.11682 is the wider four-hour low.
Beyond price, useful evidence would include volume behavior during advances and sell-offs, changes in open interest alongside volatility, supply changes, contract activity, developer updates, and measurable network usage. Token unlock information and evidence of actual AI-agent activity would help clarify whether the project’s stated infrastructure thesis is translating into ecosystem demand.
Bitcoin’s recent high of 78,343.80 and low of 76,350.10 are also relevant market references. A decisive move outside that range could alter the broader backdrop for UBUSDT, although the supplied research does not establish a specific relationship between the two assets.
𝗕𝗮𝗹𝗮𝗻𝗰𝗲𝗱 𝗰𝗼𝗻𝗰𝗹𝘂𝘀𝗶𝗼𝗻
UBUSDT is notable because the market has combined a strong 24-hour rally with a recognizable recovery pattern after a heavy rejection. The RR Trader scanner favors a setup around 0.13200, with 0.13177 as support and 0.13370 as the first resistance. Its reported risk-reward ratio is approximately 1.93, but the live price has already moved above the scanner’s preferred zone. That difference makes the distinction between a controlled retest and an extended move important.
Unibase’s concept is ambitious and clearly defined in the project description: a decentralized AI memory layer designed to support long-term memory, cross-platform interoperability, and on-chain AI agents. However, the available research confirms the vision more clearly than it confirms adoption, revenue, production scale, technical milestones, or the token’s exact utility.
The supply profile also deserves attention. The maximum supply is 10 billion UB, while the reported circulating supply is 2.5 billion. With no verified unlock schedule included, the future timing of additional supply remains uncertain.
The cleanest reading is balanced. Technically, UBUSDT has short-term momentum while it remains above the scanner’s support area, but the recent rejection and relatively subdued scanner volume ratio show that continuation is not established. Fundamentally, Unibase remains a developing AI infrastructure project whose valuation depends on execution and measurable ecosystem demand. The next move will be shaped by the interaction between 0.13370 resistance, the 0.13177 support area, Bitcoin’s direction, trading activity, and evidence that Unibase is turning its AI memory thesis into observable network use.
UBUSDT Analysis: Momentum, Key Levels, and Unibase’s Unfinished Fundamental Case
𝗧𝗵𝗲 𝗳𝗶𝗿𝘀𝘁 𝗰𝗹𝘂𝗲 𝗶𝘀 𝘁𝗵𝗲 𝗽𝗿𝗶𝗰𝗲 𝗮𝗰𝘁𝗶𝗼𝗻, 𝗻𝗼𝘁 𝘁𝗵𝗲 𝘀𝘁𝗼𝗿𝘆
UBUSDT appeared on the RR Trader scanner with a LONG direction, a confidence score of 100, and a TOP_GAINER ranking of 12. That makes it notable from a short-term market perspective, but the chart is more complicated than a simple straight-line rally. Unibase, the project associated with the UB token, is categorized in the artificial intelligence and infrastructure sectors, while the token has recently experienced a sharp increase in price and a volatile recovery.
The exchange ticker shows UBUSDT at 0.134160, up 13.522 percent over 24 hours, with a high of 0.140390 and a low of 0.117830. CoinGecko’s separate snapshot lists UB at 0.134621 and a 13.86073 percent daily gain. Those figures were collected from different sources and at different times, so the difference is expected. It also shows that the exact quoted price depends on the venue and timestamp.
The central question is not simply whether the move can continue. It is whether buyers can defend the higher trading range after the first wave of momentum fades. The recent chart includes a strong advance, a sharp rejection, and a partial recovery toward the current market area.
𝗪𝗵𝗮𝘁 𝗨𝗻𝗶𝗯𝗮𝘀𝗲 𝘀𝗮𝘆𝘀 𝗶𝘁 𝗶𝘀 𝗯𝘂𝗶𝗹𝗱𝗶𝗻𝗴
According to the project description in the research data, Unibase describes itself as a decentralized AI memory layer. It is designed to provide AI agents with long-term memory and cross-platform interoperability, enabling them to retain information, learn, evolve, and collaborate more autonomously. The broader ambition is an Open Agent Internet: a modular, verifiable, and composable ecosystem of on-chain AI agents.
That description places Unibase at the intersection of AI agents, memory, data availability, and blockchain infrastructure. The project’s stated objective is to provide a foundation that allows agents to preserve useful context and interact across platforms. Its categories include Artificial Intelligence, Infrastructure, Ethereum Ecosystem, Data Availability, AI Framework, the x402 Ecosystem, and Binance Alpha Spotlight.
Those statements describe the project’s intended role rather than confirming that the complete vision has already been delivered. The supplied research does not verify Unibase’s active user base, number of deployed agents, production usage, revenue, or network performance. It also does not provide a verified founding history, team background, funding record, or detailed launch timeline. Those omissions matter when separating the underlying idea from measurable adoption.
𝗨𝗕 𝘂𝘁𝗶𝗹𝗶𝘁𝘆 𝗮𝗻𝗱 𝘁𝗵𝗲 𝗲𝗰𝗼𝘀𝘆𝘀𝘁𝗲𝗺 𝗮𝗿𝗼𝘂𝗻𝗱 𝗶𝘁
The practical utility of UB is not fully detailed in the supplied research. No verified breakdown explains whether the token is used for storage payments, agent execution, data access, staking, governance, network security, or transaction fees. It is therefore more accurate to describe UB as the token associated with Unibase’s AI memory and agent-infrastructure concept, while leaving its exact live economic functions open for further confirmation.
The research includes token contract references on Ethereum and BNB Chain, indicating that UB has a multichain presence. However, the existence of contracts does not independently establish deep cross-chain usage, a functioning bridge, or broad ecosystem adoption. The research also identifies a project website, documentation, an official social account, and a GitHub organization, but it does not provide developer activity metrics or independently verified application usage.
For an infrastructure project, those missing details are important. The narrative explains what Unibase aims to build, while usage data would show how much of that system is already operating. The available research supports the existence of the project’s stated direction, but it does not establish the scale of its current ecosystem.
𝗦𝘂𝗽𝗽𝗹𝘆, 𝗺𝗮𝗿𝗸𝗲𝘁 𝗰𝗮𝗽𝗶𝘁𝗮𝗹𝗶𝘇𝗮𝘁𝗶𝗼𝗻, 𝗮𝗻𝗱 𝗱𝗶𝗹𝘂𝘁𝗶𝗼𝗻
The tokenomics data lists a maximum supply of 10 billion UB and a circulating supply of 2.5 billion. The reported circulating portion is therefore 25 percent of the maximum supply. CoinGecko lists a market capitalization of approximately 336.55 million dollars, a market-cap rank of 127, and a fully diluted valuation of approximately 1.346 billion dollars. The reported market-cap-to-FDV ratio is 0.25, matching the circulating-supply figure.
This distinction is important when assessing UBUSDT. Market capitalization reflects the tokens reported as circulating, while fully diluted valuation applies the current price to the entire maximum supply. If additional tokens enter circulation, the supply available in the market may increase. The research does not include an unlock calendar, allocation breakdown, vesting schedule, or information about treasury and investor holdings, so the timing and size of future supply changes are unavailable.
CoinGecko reports approximately 15.26 million dollars in total 24-hour volume. The exchange ticker reports quote volume of approximately 12.79 million dollars and volume of 97.17 million UB. These figures indicate active trading, but they do not show how concentrated the activity is across venues or whether it is mostly spot or derivatives trading.
The market also reports open interest of 29,999,333 for UBUSDT. Because the unit and venue context are not specified, that figure is best treated as an indication of active leveraged-market participation rather than a precise measure of bullish conviction.
𝗧𝗵𝗲 𝗿𝗲𝗰𝗲𝗻𝘁 𝗰𝗵𝗮𝗿𝘁 𝘀𝘁𝗿𝘂𝗰𝘁𝘂𝗿𝗲
The hourly data shows an advance from the 0.11808 to 0.11835 area toward 0.14039. Early candles climbed through 0.12172, 0.12447, 0.12731, and 0.13060, with trading activity increasing during the move. Price then reached 0.13370 and later extended to 0.13856 and 0.14039 on the hourly record.
The market did not hold the first peak. A high-volume hourly candle traded between 0.12555 and 0.13678 and closed around 0.12724. That was a large rejection and showed that sellers became active above the mid-0.13 region. Price then stabilized through several hours between roughly 0.128 and 0.134 before recovering toward the current market area.
On the four-hour view, the sequence appears as an impulse rally followed by a volatile retracement and a partial recovery. The four-hour low of 0.11682 is a broader reference, while 0.12555 marks the deepest low of the sharp pullback in the recent sequence. The current move is constructive in the narrow sense that price reclaimed 0.13000 and returned toward 0.13400, but it is not a low-volatility advance. The wide candle ranges show that both buyers and sellers remain active.
The scanner records a 15-minute move of 0.6396 percent and a volume ratio of 0.6179. The positive short-term move supports the scanner’s bullish setup, while the sub-one volume ratio indicates that immediate momentum was not accompanied by unusually high volume against its comparison baseline. That does not invalidate the setup, but it means a sustained move would require additional participation.
𝗪𝗵𝗮𝘁 𝘁𝗵𝗲 𝘀𝗰𝗮𝗻𝗻𝗲𝗿 𝗶𝘀 𝗵𝗶𝗴𝗵𝗹𝗶𝗴𝗵𝘁𝗶𝗻𝗴
The RR Trader setup places support at 0.13177 and resistance at 0.13370. Its proposed entry zone is 0.131971745 to 0.132103915, with a stop level at 0.1311774286. The scanner lists upside reference points at 0.1338905436, 0.1347838579, and 0.1356771721, and calculates a risk-reward figure of approximately 1.93. These are scanner outputs rather than independently confirmed forecasts.
The setup is notable because its proposed entry area sits just above the scanner’s support. The model is therefore focused on buyers defending the recent base instead of relying on a continuation after the token’s move toward 0.14039. The first upside reference is close to the listed resistance, while the second and third references would require price to recover more of the rejected range.
At the time of the exchange ticker snapshot, price was 0.134160, already above the scanner’s resistance at 0.13370. There are two straightforward interpretations. Price may be beginning to break through resistance, or it may have moved beyond the preferred zone and be vulnerable to a pullback toward support. The scanner was created at 10:00 UTC, while the broader market data was updated later, so timing may explain part of the difference.
The key technical test is whether 0.13370 changes from overhead resistance into support. Holding above that level would strengthen the bullish reading. A move below 0.13177 would weaken it, while a break below 0.1311774286 would invalidate the scanner’s defined setup. These levels describe the model’s structure; they do not determine how the market must behave.
𝗕𝗶𝘁𝗰𝗼𝗶𝗻 𝗮𝗻𝗱 𝘁𝗵𝗲 𝗯𝗿𝗼𝗮𝗱𝗲𝗿 𝗺𝗮𝗿𝗸𝗲𝘁
The supplied BTCUSDT ticker shows Bitcoin at 77,764.40, up 1.469 percent over 24 hours, with a range from 76,350.10 to 78,343.80 and quote volume of more than 8.22 billion dollars. Bitcoin’s daily move is considerably smaller than UB’s, so the two assets are showing different levels of short-term performance.
UB is down 2.6792 percent over seven days, up 10.6762 percent over 14 days, and up 66.53428 percent over 60 days. This combination places the current rally inside a mixed short-term structure and a stronger medium-term performance record. It also confirms that the advance has not been uniform across each measurement period.
The supplied research does not identify a market-wide catalyst specifically explaining the UBUSDT move. The two recent news items concern a proposed United States crypto market-structure bill and a reported Revolut data breach. Neither is presented as a Unibase announcement or a direct UB catalyst, so connecting either item to the rally would be speculative.
𝗪𝗵𝗮𝘁 𝗰𝗼𝘂𝗹𝗱 𝗰𝗵𝗮𝗻𝗴𝗲 𝘁𝗵𝗲 𝗻𝗲𝘅𝘁 𝗺𝗼𝘃𝗲
The technical case would become stronger if buyers defended the 0.13177 to 0.13210 area during a retest, if price held above 0.13370, and if advancing candles attracted greater volume. A sustained move above 0.13370 could bring the scanner’s 0.13389, 0.13478, and 0.13568 references into focus. A return toward 0.13856 to 0.14039 would test the recent rejection area rather than automatically confirming continuation.
From a fundamental perspective, evidence of working AI memory products, agent deployments, developer activity, user growth, or clear token utility would make the project’s stated concept more measurable. None of those developments is confirmed in the supplied data, so they remain areas for observation rather than explanations of the current price.
The main market risks are visible in the available figures. The recent chart has shown a wide range, including a rapid move from the 0.14000 area toward 0.12555. Only 25 percent of the maximum token supply is reported as circulating, and no unlock schedule is provided. The future supply profile is therefore not fully defined in the research.
The supplied data also does not provide an audit status, security history, token-holder concentration, or details of administrative controls. Those are unresolved due-diligence questions. The presence of contracts on more than one chain also does not independently establish the extent of cross-chain usage or the security of any related infrastructure.
𝗟𝗲𝘃𝗲𝗹𝘀 𝗮𝗻𝗱 𝗲𝘃𝗶𝗱𝗲𝗻𝗰𝗲 𝘁𝗼 𝘄𝗮𝘁𝗰𝗵
In the immediate structure, 0.13370 is the first pivotal level because it is the scanner’s resistance and sits close to the current price. Above it, 0.13389, 0.13478, and 0.13568 are the scanner’s successive upside references. The recent hourly high at 0.14039 is a larger resistance reference and the clearest test of whether the market is continuing or only recovering.
On the downside, 0.13177 is the first scanner support, followed by the 0.13118 invalidation level. The broader chart provides additional references around 0.12800, 0.12555, and 0.11682. Losing the first two levels would weaken the short-term structure. A deeper move toward 0.12555 would place the recent recovery under greater pressure, while 0.11682 is the wider four-hour low.
Beyond price, useful evidence would include volume behavior during advances and sell-offs, changes in open interest alongside volatility, supply changes, contract activity, developer updates, and measurable network usage. Token unlock information and evidence of actual AI-agent activity would help clarify whether the project’s stated infrastructure thesis is translating into ecosystem demand.
Bitcoin’s recent high of 78,343.80 and low of 76,350.10 are also relevant market references. A decisive move outside that range could alter the broader backdrop for UBUSDT, although the supplied research does not establish a specific relationship between the two assets.
𝗕𝗮𝗹𝗮𝗻𝗰𝗲𝗱 𝗰𝗼𝗻𝗰𝗹𝘂𝘀𝗶𝗼𝗻
UBUSDT is notable because the market has combined a strong 24-hour rally with a recognizable recovery pattern after a heavy rejection. The RR Trader scanner favors a setup around 0.13200, with 0.13177 as support and 0.13370 as the first resistance. Its reported risk-reward ratio is approximately 1.93, but the live price has already moved above the scanner’s preferred zone. That difference makes the distinction between a controlled retest and an extended move important.
Unibase’s concept is ambitious and clearly defined in the project description: a decentralized AI memory layer designed to support long-term memory, cross-platform interoperability, and on-chain AI agents. However, the available research confirms the vision more clearly than it confirms adoption, revenue, production scale, technical milestones, or the token’s exact utility.
The supply profile also deserves attention. The maximum supply is 10 billion UB, while the reported circulating supply is 2.5 billion. With no verified unlock schedule included, the future timing of additional supply remains uncertain.
The cleanest reading is balanced. Technically, UBUSDT has short-term momentum while it remains above the scanner’s support area, but the recent rejection and relatively subdued scanner volume ratio show that continuation is not established. Fundamentally, Unibase remains a developing AI infrastructure project whose valuation depends on execution and measurable ecosystem demand. The next move will be shaped by the interaction between 0.13370 resistance, the 0.13177 support area, Bitcoin’s direction, trading activity, and evidence that Unibase is turning its AI memory thesis into observable network use.
UBUSDT appeared on the RR Trader scanner with a LONG direction, a confidence score of 100, and a TOP_GAINER ranking of 12. That makes it notable from a short-term market perspective, but the chart is more complicated than a simple straight-line rally. Unibase, the project associated with the UB token, is categorized in the artificial intelligence and infrastructure sectors, while the token has recently experienced a sharp increase in price and a volatile recovery.
The exchange ticker shows UBUSDT at 0.134160, up 13.522 percent over 24 hours, with a high of 0.140390 and a low of 0.117830. CoinGecko’s separate snapshot lists UB at 0.134621 and a 13.86073 percent daily gain. Those figures were collected from different sources and at different times, so the difference is expected. It also shows that the exact quoted price depends on the venue and timestamp.
The central question is not simply whether the move can continue. It is whether buyers can defend the higher trading range after the first wave of momentum fades. The recent chart includes a strong advance, a sharp rejection, and a partial recovery toward the current market area.
𝗪𝗵𝗮𝘁 𝗨𝗻𝗶𝗯𝗮𝘀𝗲 𝘀𝗮𝘆𝘀 𝗶𝘁 𝗶𝘀 𝗯𝘂𝗶𝗹𝗱𝗶𝗻𝗴
According to the project description in the research data, Unibase describes itself as a decentralized AI memory layer. It is designed to provide AI agents with long-term memory and cross-platform interoperability, enabling them to retain information, learn, evolve, and collaborate more autonomously. The broader ambition is an Open Agent Internet: a modular, verifiable, and composable ecosystem of on-chain AI agents.
That description places Unibase at the intersection of AI agents, memory, data availability, and blockchain infrastructure. The project’s stated objective is to provide a foundation that allows agents to preserve useful context and interact across platforms. Its categories include Artificial Intelligence, Infrastructure, Ethereum Ecosystem, Data Availability, AI Framework, the x402 Ecosystem, and Binance Alpha Spotlight.
Those statements describe the project’s intended role rather than confirming that the complete vision has already been delivered. The supplied research does not verify Unibase’s active user base, number of deployed agents, production usage, revenue, or network performance. It also does not provide a verified founding history, team background, funding record, or detailed launch timeline. Those omissions matter when separating the underlying idea from measurable adoption.
𝗨𝗕 𝘂𝘁𝗶𝗹𝗶𝘁𝘆 𝗮𝗻𝗱 𝘁𝗵𝗲 𝗲𝗰𝗼𝘀𝘆𝘀𝘁𝗲𝗺 𝗮𝗿𝗼𝘂𝗻𝗱 𝗶𝘁
The practical utility of UB is not fully detailed in the supplied research. No verified breakdown explains whether the token is used for storage payments, agent execution, data access, staking, governance, network security, or transaction fees. It is therefore more accurate to describe UB as the token associated with Unibase’s AI memory and agent-infrastructure concept, while leaving its exact live economic functions open for further confirmation.
The research includes token contract references on Ethereum and BNB Chain, indicating that UB has a multichain presence. However, the existence of contracts does not independently establish deep cross-chain usage, a functioning bridge, or broad ecosystem adoption. The research also identifies a project website, documentation, an official social account, and a GitHub organization, but it does not provide developer activity metrics or independently verified application usage.
For an infrastructure project, those missing details are important. The narrative explains what Unibase aims to build, while usage data would show how much of that system is already operating. The available research supports the existence of the project’s stated direction, but it does not establish the scale of its current ecosystem.
𝗦𝘂𝗽𝗽𝗹𝘆, 𝗺𝗮𝗿𝗸𝗲𝘁 𝗰𝗮𝗽𝗶𝘁𝗮𝗹𝗶𝘇𝗮𝘁𝗶𝗼𝗻, 𝗮𝗻𝗱 𝗱𝗶𝗹𝘂𝘁𝗶𝗼𝗻
The tokenomics data lists a maximum supply of 10 billion UB and a circulating supply of 2.5 billion. The reported circulating portion is therefore 25 percent of the maximum supply. CoinGecko lists a market capitalization of approximately 336.55 million dollars, a market-cap rank of 127, and a fully diluted valuation of approximately 1.346 billion dollars. The reported market-cap-to-FDV ratio is 0.25, matching the circulating-supply figure.
This distinction is important when assessing UBUSDT. Market capitalization reflects the tokens reported as circulating, while fully diluted valuation applies the current price to the entire maximum supply. If additional tokens enter circulation, the supply available in the market may increase. The research does not include an unlock calendar, allocation breakdown, vesting schedule, or information about treasury and investor holdings, so the timing and size of future supply changes are unavailable.
CoinGecko reports approximately 15.26 million dollars in total 24-hour volume. The exchange ticker reports quote volume of approximately 12.79 million dollars and volume of 97.17 million UB. These figures indicate active trading, but they do not show how concentrated the activity is across venues or whether it is mostly spot or derivatives trading.
The market also reports open interest of 29,999,333 for UBUSDT. Because the unit and venue context are not specified, that figure is best treated as an indication of active leveraged-market participation rather than a precise measure of bullish conviction.
𝗧𝗵𝗲 𝗿𝗲𝗰𝗲𝗻𝘁 𝗰𝗵𝗮𝗿𝘁 𝘀𝘁𝗿𝘂𝗰𝘁𝘂𝗿𝗲
The hourly data shows an advance from the 0.11808 to 0.11835 area toward 0.14039. Early candles climbed through 0.12172, 0.12447, 0.12731, and 0.13060, with trading activity increasing during the move. Price then reached 0.13370 and later extended to 0.13856 and 0.14039 on the hourly record.
The market did not hold the first peak. A high-volume hourly candle traded between 0.12555 and 0.13678 and closed around 0.12724. That was a large rejection and showed that sellers became active above the mid-0.13 region. Price then stabilized through several hours between roughly 0.128 and 0.134 before recovering toward the current market area.
On the four-hour view, the sequence appears as an impulse rally followed by a volatile retracement and a partial recovery. The four-hour low of 0.11682 is a broader reference, while 0.12555 marks the deepest low of the sharp pullback in the recent sequence. The current move is constructive in the narrow sense that price reclaimed 0.13000 and returned toward 0.13400, but it is not a low-volatility advance. The wide candle ranges show that both buyers and sellers remain active.
The scanner records a 15-minute move of 0.6396 percent and a volume ratio of 0.6179. The positive short-term move supports the scanner’s bullish setup, while the sub-one volume ratio indicates that immediate momentum was not accompanied by unusually high volume against its comparison baseline. That does not invalidate the setup, but it means a sustained move would require additional participation.
𝗪𝗵𝗮𝘁 𝘁𝗵𝗲 𝘀𝗰𝗮𝗻𝗻𝗲𝗿 𝗶𝘀 𝗵𝗶𝗴𝗵𝗹𝗶𝗴𝗵𝘁𝗶𝗻𝗴
The RR Trader setup places support at 0.13177 and resistance at 0.13370. Its proposed entry zone is 0.131971745 to 0.132103915, with a stop level at 0.1311774286. The scanner lists upside reference points at 0.1338905436, 0.1347838579, and 0.1356771721, and calculates a risk-reward figure of approximately 1.93. These are scanner outputs rather than independently confirmed forecasts.
The setup is notable because its proposed entry area sits just above the scanner’s support. The model is therefore focused on buyers defending the recent base instead of relying on a continuation after the token’s move toward 0.14039. The first upside reference is close to the listed resistance, while the second and third references would require price to recover more of the rejected range.
At the time of the exchange ticker snapshot, price was 0.134160, already above the scanner’s resistance at 0.13370. There are two straightforward interpretations. Price may be beginning to break through resistance, or it may have moved beyond the preferred zone and be vulnerable to a pullback toward support. The scanner was created at 10:00 UTC, while the broader market data was updated later, so timing may explain part of the difference.
The key technical test is whether 0.13370 changes from overhead resistance into support. Holding above that level would strengthen the bullish reading. A move below 0.13177 would weaken it, while a break below 0.1311774286 would invalidate the scanner’s defined setup. These levels describe the model’s structure; they do not determine how the market must behave.
𝗕𝗶𝘁𝗰𝗼𝗶𝗻 𝗮𝗻𝗱 𝘁𝗵𝗲 𝗯𝗿𝗼𝗮𝗱𝗲𝗿 𝗺𝗮𝗿𝗸𝗲𝘁
The supplied BTCUSDT ticker shows Bitcoin at 77,764.40, up 1.469 percent over 24 hours, with a range from 76,350.10 to 78,343.80 and quote volume of more than 8.22 billion dollars. Bitcoin’s daily move is considerably smaller than UB’s, so the two assets are showing different levels of short-term performance.
UB is down 2.6792 percent over seven days, up 10.6762 percent over 14 days, and up 66.53428 percent over 60 days. This combination places the current rally inside a mixed short-term structure and a stronger medium-term performance record. It also confirms that the advance has not been uniform across each measurement period.
The supplied research does not identify a market-wide catalyst specifically explaining the UBUSDT move. The two recent news items concern a proposed United States crypto market-structure bill and a reported Revolut data breach. Neither is presented as a Unibase announcement or a direct UB catalyst, so connecting either item to the rally would be speculative.
𝗪𝗵𝗮𝘁 𝗰𝗼𝘂𝗹𝗱 𝗰𝗵𝗮𝗻𝗴𝗲 𝘁𝗵𝗲 𝗻𝗲𝘅𝘁 𝗺𝗼𝘃𝗲
The technical case would become stronger if buyers defended the 0.13177 to 0.13210 area during a retest, if price held above 0.13370, and if advancing candles attracted greater volume. A sustained move above 0.13370 could bring the scanner’s 0.13389, 0.13478, and 0.13568 references into focus. A return toward 0.13856 to 0.14039 would test the recent rejection area rather than automatically confirming continuation.
From a fundamental perspective, evidence of working AI memory products, agent deployments, developer activity, user growth, or clear token utility would make the project’s stated concept more measurable. None of those developments is confirmed in the supplied data, so they remain areas for observation rather than explanations of the current price.
The main market risks are visible in the available figures. The recent chart has shown a wide range, including a rapid move from the 0.14000 area toward 0.12555. Only 25 percent of the maximum token supply is reported as circulating, and no unlock schedule is provided. The future supply profile is therefore not fully defined in the research.
The supplied data also does not provide an audit status, security history, token-holder concentration, or details of administrative controls. Those are unresolved due-diligence questions. The presence of contracts on more than one chain also does not independently establish the extent of cross-chain usage or the security of any related infrastructure.
𝗟𝗲𝘃𝗲𝗹𝘀 𝗮𝗻𝗱 𝗲𝘃𝗶𝗱𝗲𝗻𝗰𝗲 𝘁𝗼 𝘄𝗮𝘁𝗰𝗵
In the immediate structure, 0.13370 is the first pivotal level because it is the scanner’s resistance and sits close to the current price. Above it, 0.13389, 0.13478, and 0.13568 are the scanner’s successive upside references. The recent hourly high at 0.14039 is a larger resistance reference and the clearest test of whether the market is continuing or only recovering.
On the downside, 0.13177 is the first scanner support, followed by the 0.13118 invalidation level. The broader chart provides additional references around 0.12800, 0.12555, and 0.11682. Losing the first two levels would weaken the short-term structure. A deeper move toward 0.12555 would place the recent recovery under greater pressure, while 0.11682 is the wider four-hour low.
Beyond price, useful evidence would include volume behavior during advances and sell-offs, changes in open interest alongside volatility, supply changes, contract activity, developer updates, and measurable network usage. Token unlock information and evidence of actual AI-agent activity would help clarify whether the project’s stated infrastructure thesis is translating into ecosystem demand.
Bitcoin’s recent high of 78,343.80 and low of 76,350.10 are also relevant market references. A decisive move outside that range could alter the broader backdrop for UBUSDT, although the supplied research does not establish a specific relationship between the two assets.
𝗕𝗮𝗹𝗮𝗻𝗰𝗲𝗱 𝗰𝗼𝗻𝗰𝗹𝘂𝘀𝗶𝗼𝗻
UBUSDT is notable because the market has combined a strong 24-hour rally with a recognizable recovery pattern after a heavy rejection. The RR Trader scanner favors a setup around 0.13200, with 0.13177 as support and 0.13370 as the first resistance. Its reported risk-reward ratio is approximately 1.93, but the live price has already moved above the scanner’s preferred zone. That difference makes the distinction between a controlled retest and an extended move important.
Unibase’s concept is ambitious and clearly defined in the project description: a decentralized AI memory layer designed to support long-term memory, cross-platform interoperability, and on-chain AI agents. However, the available research confirms the vision more clearly than it confirms adoption, revenue, production scale, technical milestones, or the token’s exact utility.
The supply profile also deserves attention. The maximum supply is 10 billion UB, while the reported circulating supply is 2.5 billion. With no verified unlock schedule included, the future timing of additional supply remains uncertain.
The cleanest reading is balanced. Technically, UBUSDT has short-term momentum while it remains above the scanner’s support area, but the recent rejection and relatively subdued scanner volume ratio show that continuation is not established. Fundamentally, Unibase remains a developing AI infrastructure project whose valuation depends on execution and measurable ecosystem demand. The next move will be shaped by the interaction between 0.13370 resistance, the 0.13177 support area, Bitcoin’s direction, trading activity, and evidence that Unibase is turning its AI memory thesis into observable network use.
215
·
--
Don’t miss $ZK … ‼️ UP move!
Entry: 0.00964251 - 0.00965217
SL: 0.00957974
TP1: 0.00979123 | TP2: 0.00986076 | TP3: 0.00993029
Don’t miss $ZK … ‼️ UP move!
Entry: 0.00964251 - 0.00965217
SL: 0.00957974
TP1: 0.00979123 | TP2: 0.00986076 | TP3: 0.00993029
Entry: 0.00964251 - 0.00965217
SL: 0.00957974
TP1: 0.00979123 | TP2: 0.00986076 | TP3: 0.00993029
375
·
--
Guys, watch $TRIA closely… 🔥 DOWN!
Entry: 0.00344972 - 0.00345317
SL: 0.00347926
TP1: 0.00340007 | TP2: 0.00337525 | TP3: 0.00335042
Guys, watch $TRIA closely… 🔥 DOWN!
Entry: 0.00344972 - 0.00345317
SL: 0.00347926
TP1: 0.00340007 | TP2: 0.00337525 | TP3: 0.00335042
Entry: 0.00344972 - 0.00345317
SL: 0.00347926
TP1: 0.00340007 | TP2: 0.00337525 | TP3: 0.00335042
550
·
--
Look at $MAGMA … 👀🚨 UP setup!
Entry: 0.24872 - 0.24897
SL: 0.2471
TP1: 0.25255 | TP2: 0.25435 | TP3: 0.25614
Look at $MAGMA … 👀🚨 UP setup!
Entry: 0.24872 - 0.24897
SL: 0.2471
TP1: 0.25255 | TP2: 0.25435 | TP3: 0.25614
Entry: 0.24872 - 0.24897
SL: 0.2471
TP1: 0.25255 | TP2: 0.25435 | TP3: 0.25614
692
·
--
Look at $KAVA … 👀🚨 DOWN setup!
Entry: 0.063472 - 0.063535
SL: 0.063927
TP1: 0.062658 | TP2: 0.062252 | TP3: 0.061845
Look at $KAVA … 👀🚨 DOWN setup!
Entry: 0.063472 - 0.063535
SL: 0.063927
TP1: 0.062658 | TP2: 0.062252 | TP3: 0.061845
Entry: 0.063472 - 0.063535
SL: 0.063927
TP1: 0.062658 | TP2: 0.062252 | TP3: 0.061845
1
443
Log in to explore more content
Join global crypto users on Binance Square
⚡️ Get latest and useful information about crypto.
💬 Trusted by the world’s largest crypto exchange.
👍 Discover real insights from verified creators.
Email / Phone number
Trending Topics
BitcoinHoldsAbove$77000
769 views
50 Discussing
#anthropicceocallsforaislowdown
🚨 $BTC HOLDS $77K AS MARKET FOCUSES ON BTC & ETH! 🦅
Bitcoin is respecting the 4H trendline, keeping the bullish setup active! 🎯
📍 Entry: 76,826 – 76,500
🎯 Targets: 76,900 ➔ 77,000 ➔ 77,300
🛑 Stop Loss: 76,400
⚠️ Strict Rule: The setup is only valid while key structure holds. Losing the stop area invalidates the trade.
⚡ Watchlist Assets:
🪙 $BTC — Respecting key technical support ahead of macro volatility! 📈
🌐 $ETH — Consolidating tight around key demand zones for a potential breakout move! 📊
Manage leverage carefully and wait for price to hit your predefined hunting zone! 🛡️🧠
❓ What is your move? Longing BTC here or waiting for lower entries? Drop your plan below! 👇
Disclaimer: DYOR. Not financial advice.
#BitcoinHoldsAbove$77000
#AvalancheIntegratesIntoUAEPassDigitalVault
#AnthropicCEOCallsForAISlowdown
#BrazilCentralBankRaisesVASPCapitalRequirements
Hifza Rubab
·0 Likes
·83 views
FedHikeOddsRiseTo89%
2,133 views
140 Discussing
BitcoinCrosses$78000
3,121 views
137 Discussing