BTC:
Last night, Bitcoin fluctuated continuously in two rounds.
The first round rose to around 105800 before pulling back 2000 points to the starting position.
After the second round of rising to around 107100, it pulled back down by 4000.
The box oscillation of going up and then down twice shows alternating liquidations. Notably, the long wicks up and down differ by four thousand points, and the hourly Bollinger Bands show an M pattern. If it breaks down effectively, this upward trend will end. If it can stabilize above 105000, there is still hope for bullish positions.
Currently, the bullish positions below 107000 have been mostly liquidated. If the downward trend can halt around 101500, the market may rebound again, increasing the probability of wide fluctuations. The weekly chart has already shown six consecutive bullish candles; this week is a turning point. If there is no significant movement this week, it will likely occur next week, with the latest by June 7, marking the end of this upward trend and the beginning of a pullback cycle.
Summary:
1. The rise of Bitcoin may enter a cyclical pause, showing an M pattern on the hourly chart. Currently, during the pullback after the peak, no turning point has been observed. The new highs in the morning indicate a potential trap for bulls, with excessive volatility on the long wicks, creating high instability. Watch the subsequent movements; if the bullish positions pull back again, a wide range of fluctuations is likely. Trading should focus on short-term market alignment and avoid chasing blindly.

ETH:
ETH suddenly faced negative news at midnight: Initially, it was reported that the US credit rating was downgraded (questioning borrowing capacity), followed by uncertainties in US-China trade policies, triggering a spread of panic in the market.
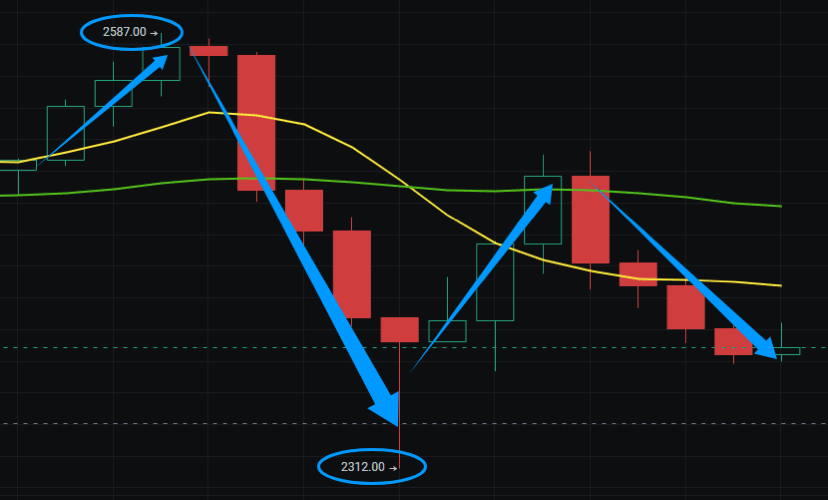
The market began to plunge from around 2570, continuously falling within four hours, with the long wick pulling down to 2300, a decline of 3.4%.
Liquidation chain reaction: Due to the recent market hovering at high levels, investor bullish sentiment warmed up last week, with many taking high leverage positions. After breaking critical support levels while asleep, the system automatically liquidated positions, triggering a chain reaction of liquidations and accelerating the downturn.
Macroeconomic negatives: The US economy is viewed pessimistically, global risk aversion is rising, and large funds are fleeing first.
Technical meltdown: ETH was originally consolidating at high levels, but indicators like moving averages and MACD have turned negative, leading to a collective sell-off by technical traders.
Panic selling: After falling to a certain extent, panic spreads, retail investors follow suit and sell at a loss, causing exchanges to lag.
Short-term: Oversold conditions may lead to a rebound, but if macroeconomic news continues to be negative (e.g., poor US economic data), further declines are possible.
Medium to long-term: High global uncertainty (debt crisis, policy changes) will lead to significant volatility in ETH, and leveraged players are prone to repeated liquidations.
Summary: The ETH market currently lacks substantial positive support, showing a clear weak pattern overall. Based on this, the trading strategy suggests prioritizing shorting during rebounds, with a focus on high short operations.