📈 Is the Bitcoin bull market indicator back? Will the market trend of 2024 repeat?
Recently, a key indicator for Bitcoin has once again sent out a familiar signal! 👀
Do you remember Bitcoin soaring to $73,000 in March this year, setting a new all-time high? Now, a derivative data point in the market—the 30-day open contract Delta—has returned to the level it was back then! Is this a coincidence, or is the bull market about to gain momentum again? 😏
🔄 Two-phase market cycle, let's take a look
Professional traders usually divide the changes in the market’s open contracts (OI) into two phases:
1️⃣ Phase One: Funds rapidly enter the market, Delta is positive (indicating strong market confidence, with more buyers than sellers)
2️⃣ Phase Two: Market reversal, positions collapse, Delta turns negative (liquidation begins, market starts to wash out participants)
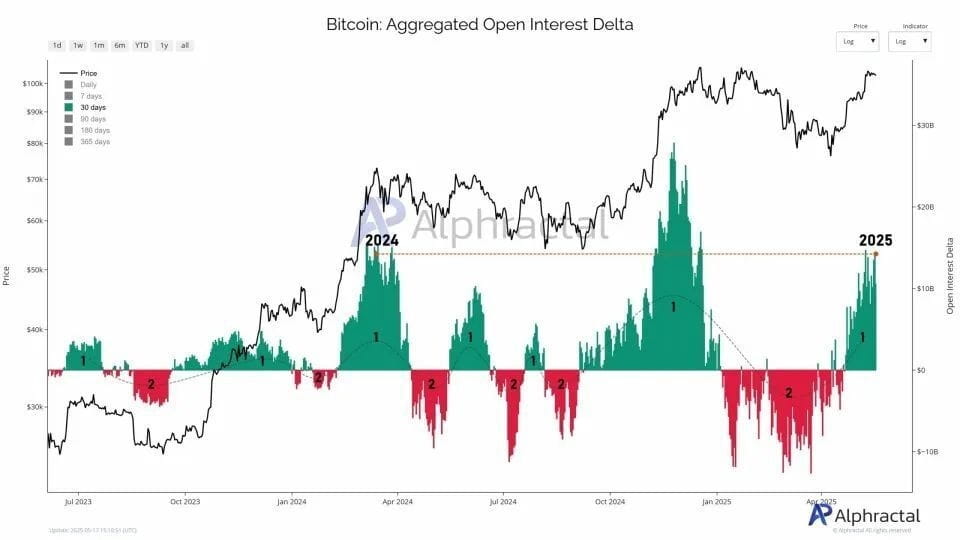
This cycle repeats itself over and over again, and now… it seems to be happening again!
📊 What does the 180-day Delta data reveal?
Let's look at a longer time frame—the 180-day Delta data. Historically, when this value suddenly drops, it usually accompanies a market liquidation, and then… it's when Bitcoin rebounds from the bottom! ⚡️
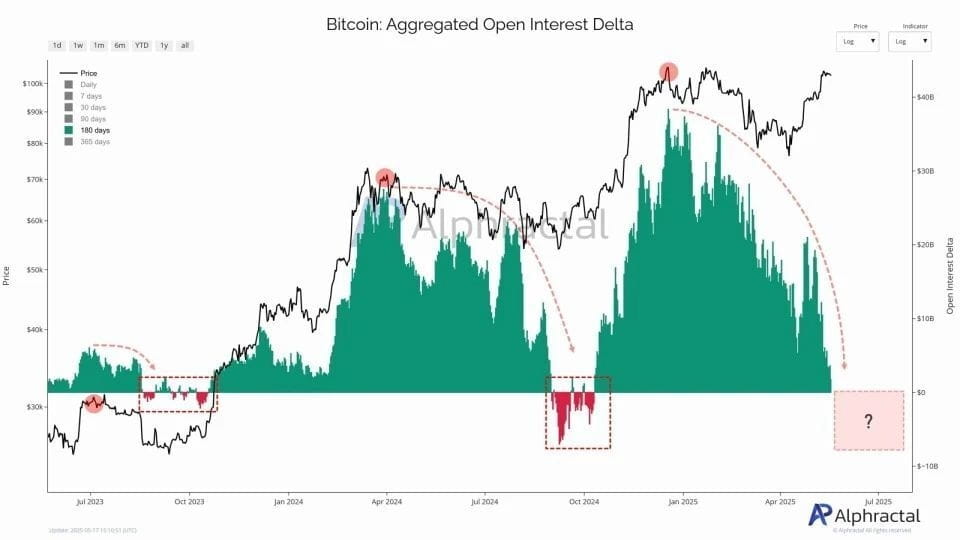
The current situation is that the 180-day Delta is still slightly above zero; once it turns negative, it may indicate that the main players are about to start building positions quietly again 🤫
🐋 Bitcoin whales: Quiet actions are the norm
You might ask: "What are the whales doing?"
They're still playing familiar tactics, but with more low-key moves than before.
In the past, each major surge (like in October 2023 and early 2024) was preceded by a spike in OI. But this time, while it's also rising, the OI isn't as exaggerated.
👉 This indicates that large holders are more cautious but have not exited the market; they may be quietly preparing for the next wave.
💸 Latest Bitcoin trend: Aiming straight for $110,000?
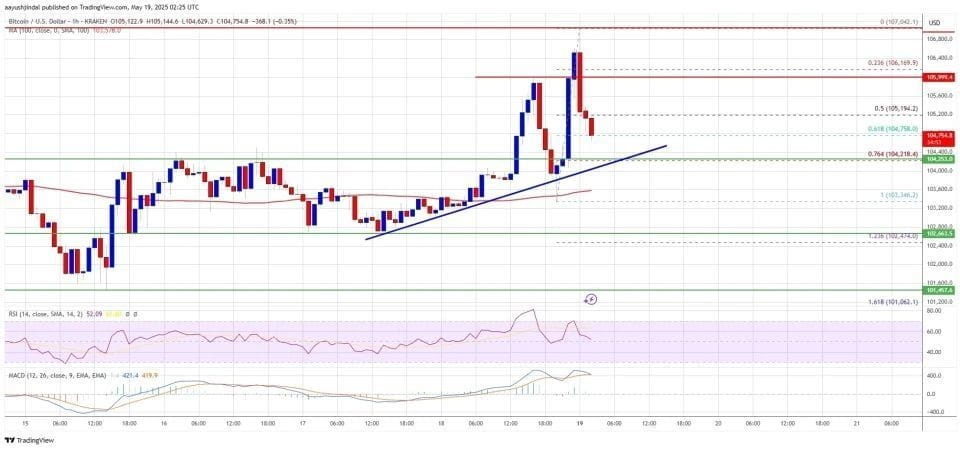
Currently, the BTC price has risen from $102,500 to $107,000, and while there has been a slight pullback, the overall trend remains strong!
✅ Key support level: $104,200 (supported by a trend line)
✅ Major resistance levels: $105,500 → $106,000 → $107,500
If it successfully breaks through $107,500, the next target could be $108,800, or even $110,000! 🚀
📉 Is the pullback risk still present?
Of course, we also need to pay attention to short-term risks. If it can't break through $105,500, Bitcoin may pull back:
🛑 Support is seen at these levels: $104,500 → $103,500 → $102,200
If it falls below $100,500, it may lead to a larger drop.
🔍 In simple terms, the technical indicators say:
MACD: Although still in the bullish zone, momentum has weakened a bit
RSI: Still above 50, indicating a bullish market
📌 To summarize:
The current market rhythm is very similar to the pre-bull market phase earlier this year! Whale activity is low-key, key indicators are active again, and Bitcoin's price is steadily rising.
🌊 Is the bull market set to make another appearance? It all depends on whether it can break through $107,500!
Remember, the main players always lay out their strategies when you can't see them, and retail investors only see the results. So the current calmness may just be the calm before the storm 🌪️ public
📢 If you find it useful, please like and share it with your friends in the crypto circle! Let's explore the next breakout point together! Account: Crypto Xiaoyun Diary