1. Short-term Trend Core Assessment
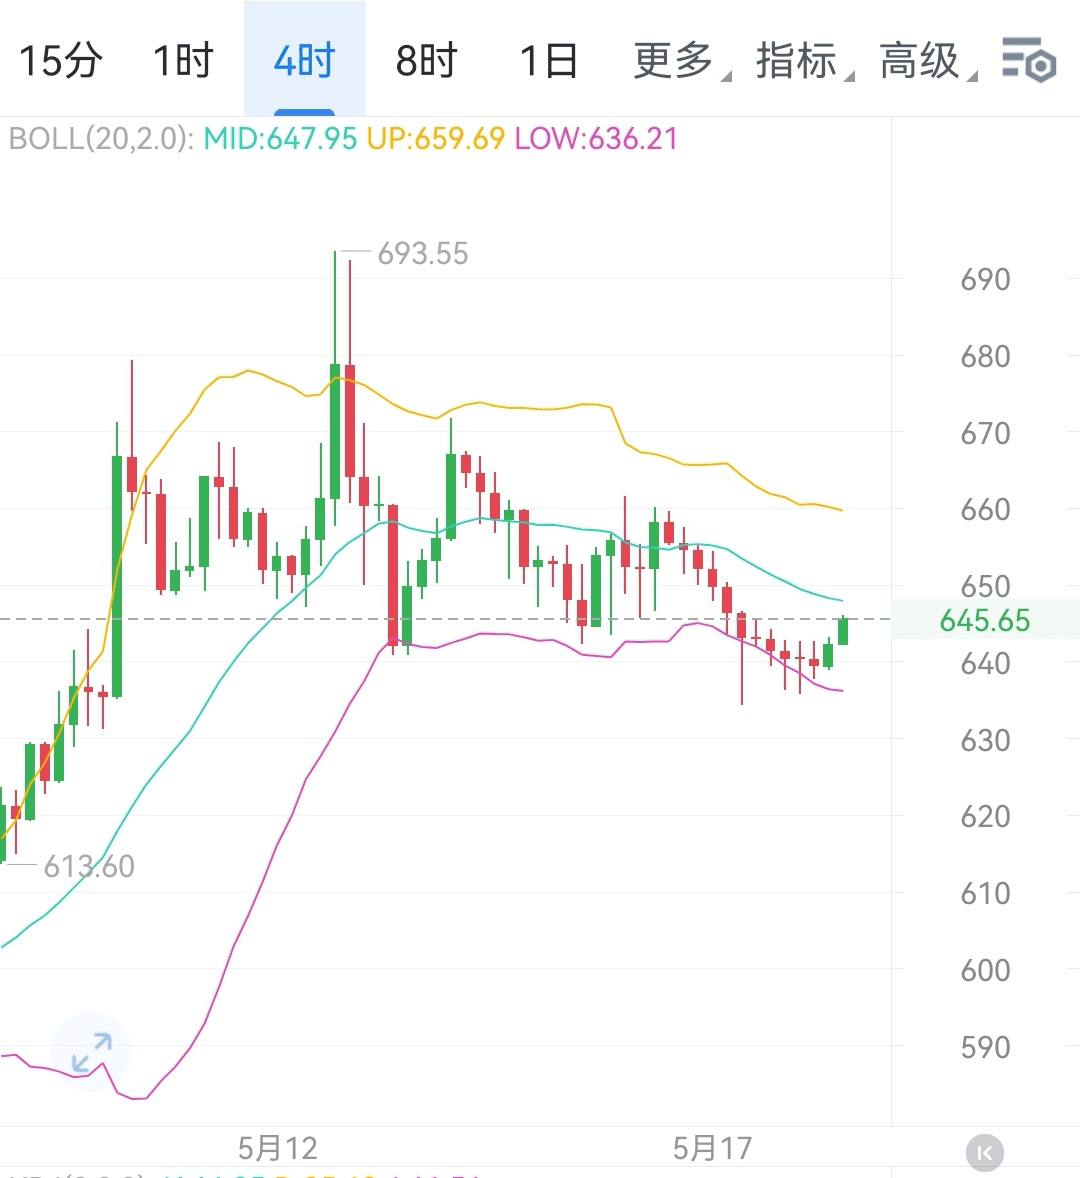
Tonight, the key focus of the BNB market trend is on the core price level of 643.5. The performance of the 4-hour candlestick at this position will become an important basis for determining whether the subsequent market can initiate a rebound. Currently, BNB has quickly rebounded after precisely touching the first support level, showing a rebound trend at the 1 - 2 hour level, but the overall trend still depends on the 4-hour level movement.
- Bullish Confirmation Signal: If the 4-hour candlestick effectively stabilizes above 643.5, and the next two periods continue to close above this price level, it indicates that the 4-hour level rebound has officially started. Bullish strength will gradually control market rhythm, and the market may enter a new rising channel, with further upward space potentially opening up.
- Bearish Warning Signal: Conversely, if the BNB price cannot stay above 643.5 on the 4-hour chart, it means that the current small level rebound momentum is insufficient, and the bears still dominate, making it highly likely that the market will continue to pull back, remaining in an adjustment state.
2. Key Level Distribution and Strategy Reference
(1) Upward Resistance Level
1. First Resistance Level: 650
- Technical Characteristics: This position is a dense trading area from previous price consolidation, where a large number of trapped positions and profit-taking positions are concentrated. When the BNB price rises to this point, selling pressure will directly hinder short-term increases, making it a primary barrier for the bulls to overcome.
2. Mid-term Resistance Level: 654.7
- Technical Characteristics: This area overlaps with key moving average resistance and significant Fibonacci resistance levels, creating strong technical resistance to price increases. To achieve an effective breakthrough, continuous inflow of bullish funds into the market is necessary, along with a shift in market sentiment to optimism.
3. Trend Breakthrough Level: 660.4
- Technical Characteristics: If the BNB price successfully stabilizes at this point, it will confirm the breakout from the current consolidation pattern, entering a new upward trend channel, indicating that a strong bullish rally is about to begin, with potential for significant upward movement.
(2) Downward Support Level
If the 4-hour level fails to stabilize above 643.5, it is expected to trigger a new round of pullback, with the lower support levels being:
1. Initial Support Level: 636.2
- Technical Characteristics: Formed by the intertwining of short-term moving averages, this area also serves as an important support level that the price has tested multiple times recently, which can buffer the impact of bearish downward pressure.
2. Secondary Support Level: 631.4
- Technical Characteristics: As a strong support area formed by previous price lows, if this point is lost, it may trigger a panic sentiment in the market, leading to more selling pressure and exacerbating the downward price trend.
3. Strong Support Level: 627.5
- Technical Characteristics: This point is located in a multi-period moving average convergence support area, which is a strategic location contested by both bulls and bears. Its gain or loss directly affects the medium to long-term trend of BNB. Once it breaks down, it may trigger a deep correction.
3. Summary
The core of BNB's short-term trend lies in the bull-bear contest at the key point of 643.5. If the price can effectively stabilize above this position, the bulls are likely to challenge the 650 - 660.4 range resistance; if unable to stabilize, one must be wary of the risk of price pulling back to the 636.2 - 627.5 area, with volatility being intense and full of uncertainty. It is recommended to closely monitor the changes in the 4-hour candlestick pattern, strictly implement stop-loss and take-profit strategies, and reasonably control positions.$BNB #BNB走势