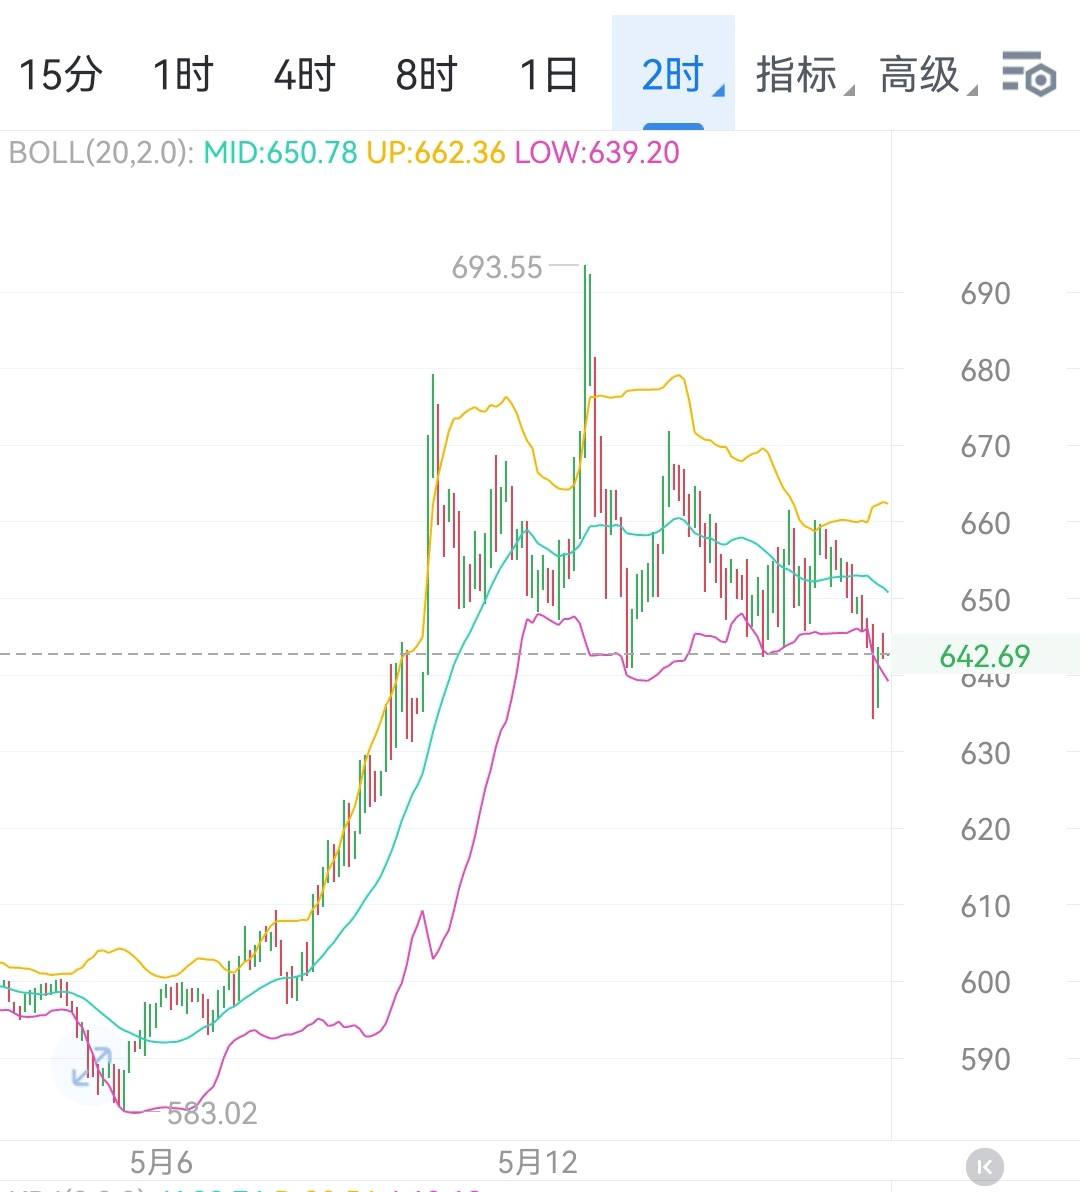
I. Core Assessment of Short-term Trends
Today's key turning point in the BNB market focuses on the price level of 647. After accurately touching the third support level in the morning, BNB rebounded. Whether the K-line can effectively hold above 647 in the subsequent 1-2 hour period will be a key indicator for judging whether the short-term rebound can continue:
- Bullish Confirmation Signal: If the 1-2 hour K-line continues to close above 647, it indicates strong momentum for a small-scale rebound, and the market is expected to start a new round of upward trends, with bullish forces gradually taking the lead.
- Bearish Warning Signal: Conversely, if it cannot stabilize at this price level, it indicates weak rebound momentum, and the market is likely to continue a pullback trend, with bearish forces possibly dominating the market again.
II. Key Level Distribution and Strategy Reference
(I) Upward Pressure Level
1. First Resistance Level: 654
- Technical Characteristics: This position is the upper edge of the previous price consolidation range, where a large amount of trapped positions are gathered. When the price rises to this level, it is likely to trigger dual selling pressure from profit-taking and trapped positions, constituting the primary obstacle to short-term upward movement.
2. Medium-term Pressure Level: 660
- Technical Characteristics: It is in the overlapping area of critical moving average resistance and Fibonacci key resistance levels, requiring strong buying power to push through, along with highly optimistic market sentiment, to achieve an effective breakthrough.
3. Trend Breakthrough Level: 667
- Technical Characteristics: Once the BNB price successfully stabilizes at this point, it will confirm its entry into a new upward channel, and the subsequent upside potential is expected to be significantly opened, initiating a new round of strong upward momentum.
(II) Downward Support Level
If the 1-2 hour period cannot hold above 647, a new round of pullback may be triggered, with subsequent support levels as follows:
1. Primary Support Level: 640
- Technical Characteristics: The short-term moving averages converge to form support, and it is also an important psychological defense line tested multiple times in the past, providing a certain buffer against bearish probing.
2. Secondary Support Level: 634
- Technical Characteristics: A strong support level formed by previous price lows. If this level is lost, bearish sentiment in the market may further intensify, leading to larger scale sell-offs.
3. Strong Support Level: 628
- Technical Characteristics: The multi-cycle moving average convergence support area is a key battleground for both bulls and bears, directly affecting the subsequent medium to long-term trend of BNB. Once it breaks down, it may trigger a deep pullback.
III. Summary
The core of BNB's short-term trend lies in the tug-of-war over the 647 level. If the price can effectively stabilize above this position, the bulls are expected to challenge the pressure range of 654-667; if it cannot stabilize, it is necessary to be alert to the risk of the price pulling back to the 640-628 area. It is recommended to closely monitor the 1-2 hour K-line pattern changes, strictly implement stop-loss and take-profit strategies, and reasonably control positions.$BNB #BNB走势