
Bitcoin’s "Supply in Loss (%)" has dropped below 2%, marking one of the lowest levels seen in its entire price history. Historically, such conditions align with market euphoria, where the vast majority of holders are in profit. But what does it mean this time?
BTC Price Action
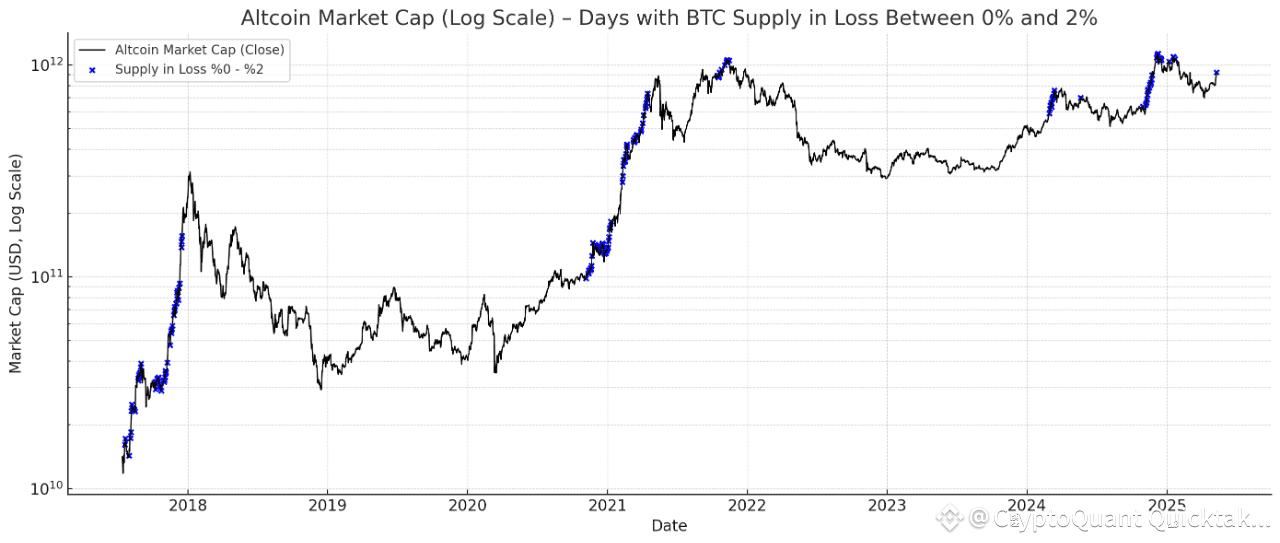
When BTC's supply in loss drops to between 0–2%, it typically coincides with late-stage bull runs. As shown in the chart, these moments cluster near macro tops — a zone often characterized by overconfidence .
Altcoin Market Cap Reaction
A look at TOTAL3 (altcoin market cap excluding BTC and ETH) shows similar timing: surges in valuation tend to align with these rare BTC supply-in-loss zones. While altcoins remain strong during such periods.
Behavioral Insight
With nearly all BTC holders in profit, distribution risk increases. Long-term holders may see these conditions as a signal to derisk, especially with BTC near all-time highs. Meanwhile, newer entrants could interpret this strength as confirmation to chase, creating a potential sentiment mismatch.
Historical Echoes
- 2017: Supply in Loss fell below 2% just weeks before the final top.
- 2021: Similar drop occurred ahead of the mid-cycle peak and the final November ATH.
- 2025 (now): We are again in this zone. Will history rhyme?
This setup doesn't guarantee an immediate top — but it demands attention. The extremely low percentage of supply in loss is a sign of a mature market phase. Whether this leads to continued melt-up or a sharp rotation will depend on macro catalysts and liquidity conditions.
Watch closely:
- On-chain profit-taking activity (e.g., SOPR, spent output age).
- Exchange inflows from long-dormant wallets.
- Altcoin strength divergence vs BTC.
We’re likely in the distribution or early blow-off zone. If this isn’t the top — it’s close.


Written by Kripto Mevsimi

