

#us
us
10.5M views
23,743 Discussing
Hot
Latest


Verified
📊 *U.S. Stock Market & Economic Outlook*
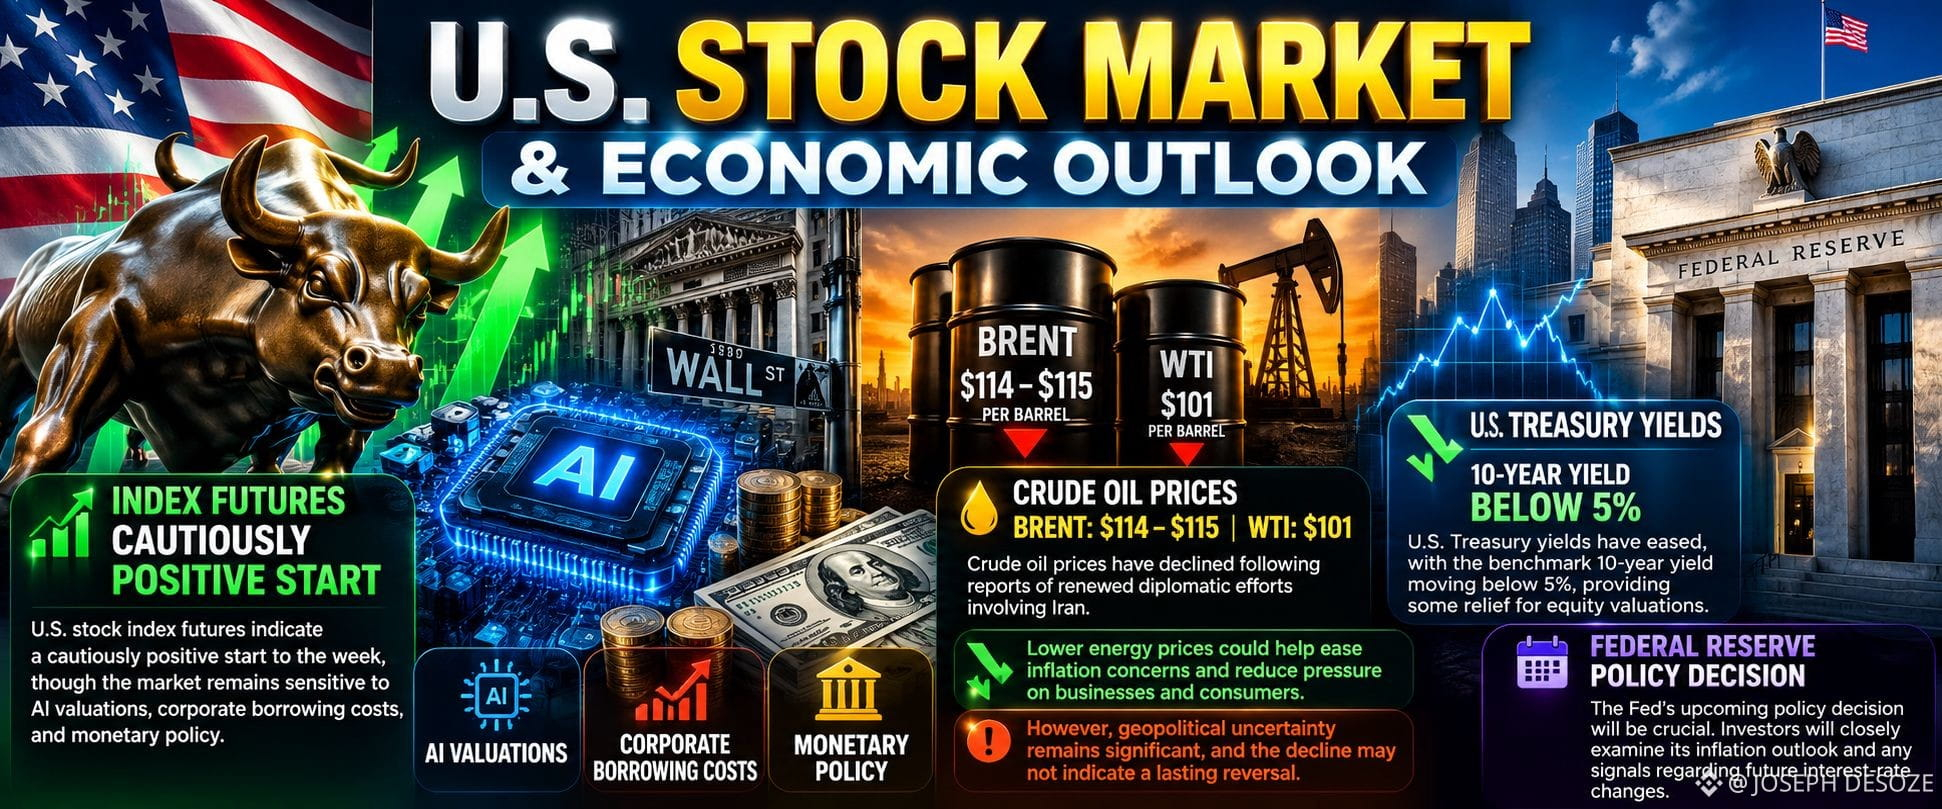
U.S. stock index futures have indicated a cautiously positive start to the week, although the broader market remains sensitive to concerns surrounding artificial intelligence valuations, corporate borrowing costs, and monetary policy.
One encouraging development is the recent decline in crude oil prices. Brent crude has retreated toward $114–$115 per barrel, while WTI has traded near $101, following reports of renewed diplomatic efforts involving Iran.
Lower energy prices could help ease inflation concerns and reduce pressure on businesses and consumers. However, geopolitical uncertainty remains significant, and a temporary decline in oil prices does not necessarily indicate a lasting reversal.
U.S. Treasury yields have also eased, with the benchmark 10-year yield moving below 5%, providing some relief for equity valuations.
The Federal Reserve's upcoming policy decision will be particularly important. Investors will closely examine its inflation outlook and any signals regarding future interest-rate changes.
#US #AI
1
887

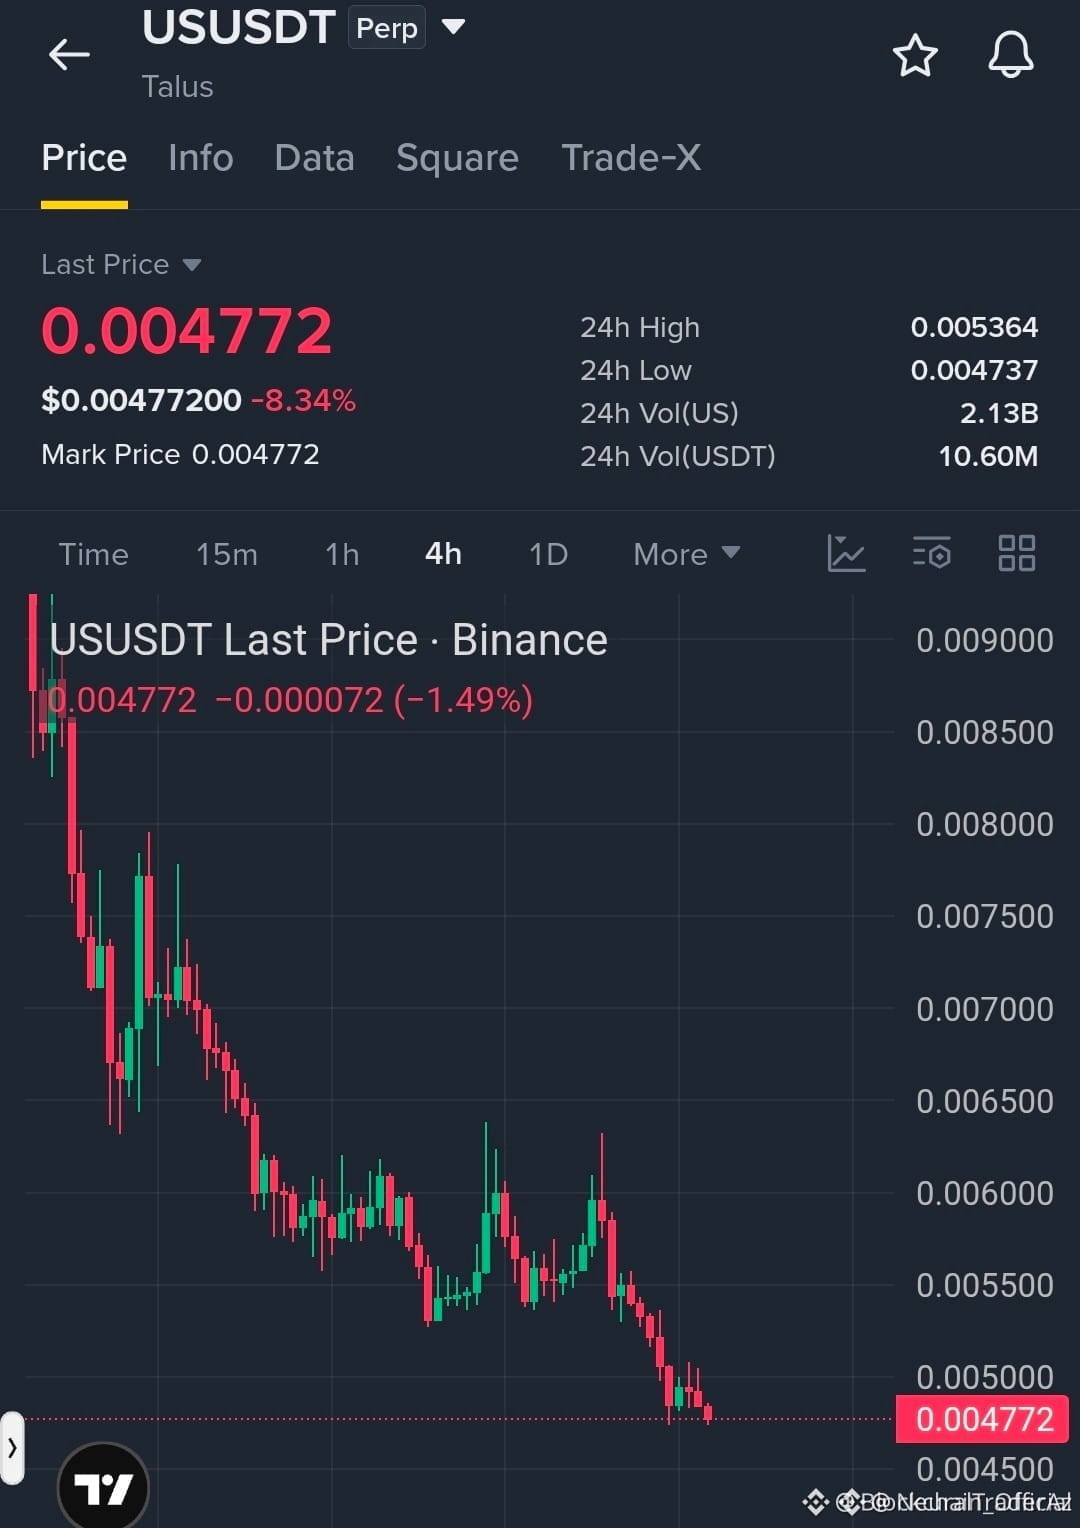
🔴 $US PLUNGES DEEPER AS BEAR CLUTCH INTENSIFIES 🚨
📊 Liquidity sweep on the 4H chart shows a widening gap below the 200‑EMA, where smart money is harvesting sell orders. 🦈 The order block at the recent swing low has been repeatedly broken, confirming institutional dominance.
⚡ Volume spikes accompany each candle, and the RSI stays entrenched in oversold territory, leaving little upside bias. 🔍 A clean break of the previous swing high would be required to reset the narrative, but the current pressure suggests further downside.
💬 Do you see a deeper capitulation forming or a potential floor forming soon? 👇
⚠️ Not financial advice. Always manage your risk. 🛡️
🏷️ #US #ShortSetup #Bearish #LiquidityHunt #Crypto
🦈 🔥
22

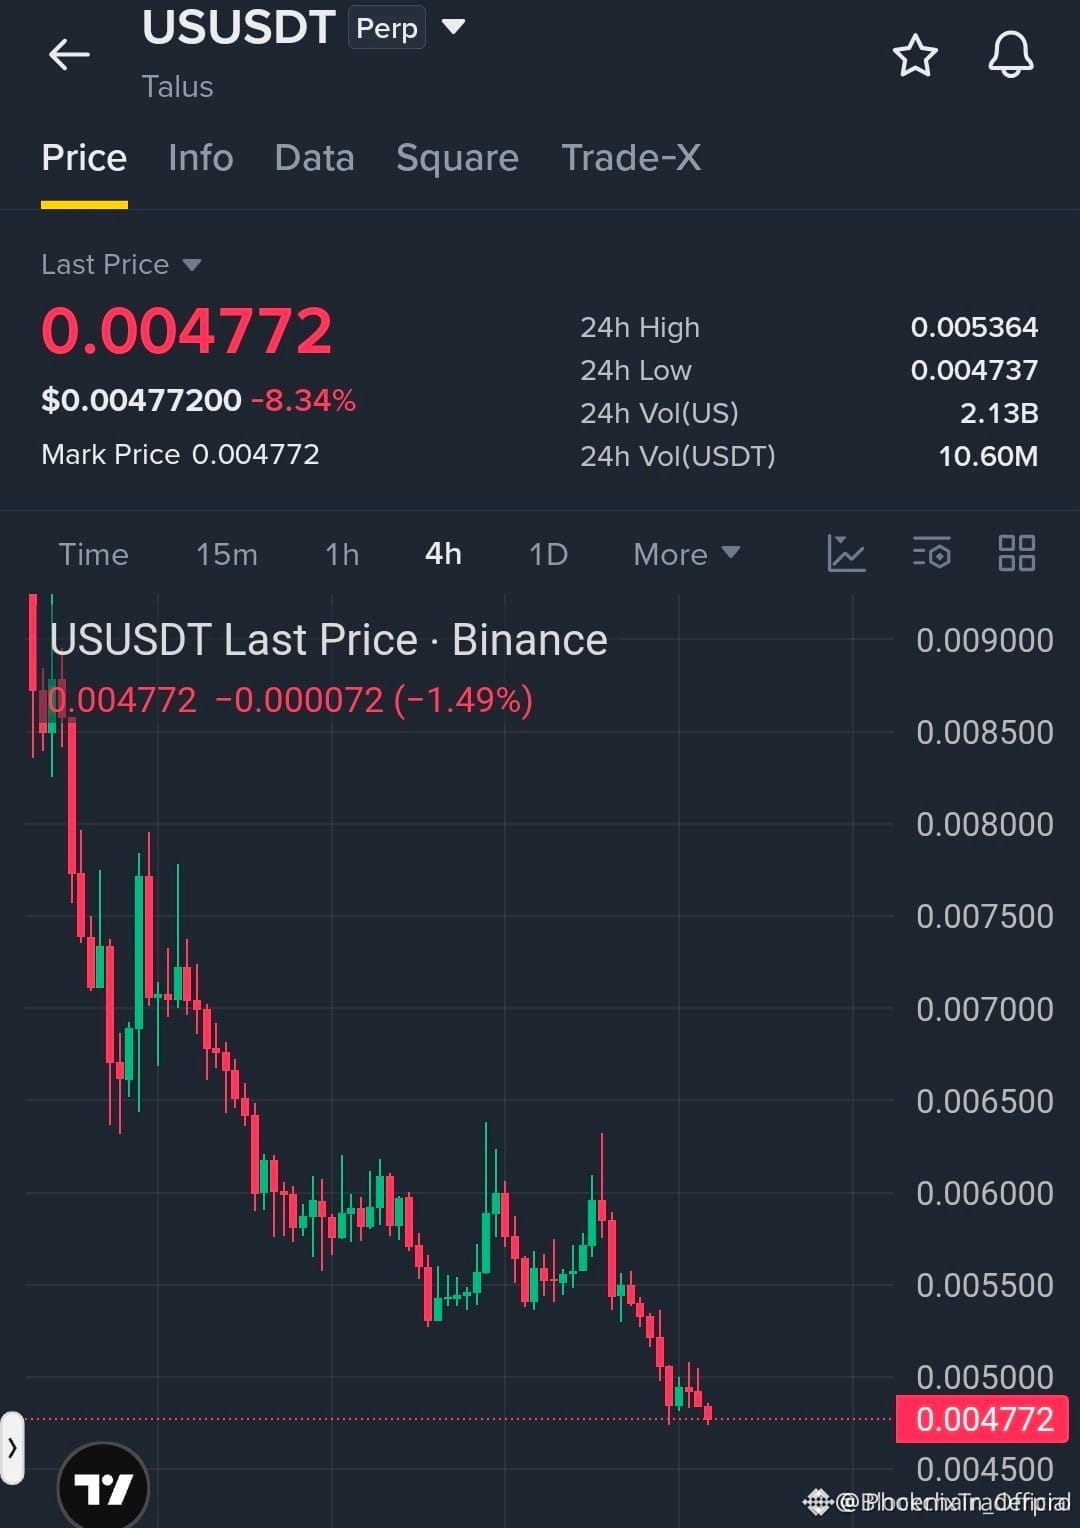
🔴 $US PLUNGING DEEPER INTO BEARISH CHAOS – SELLERS DOMINATE! 🐻
The market is grinding under relentless sell pressure, carving lower lows with each candle. Volume spikes on the 1‑hour chart signal that smart money is flushing out lingering longs. 📊
Key resistance at the prior swing failed to hold, and the RSI sits deep in oversold territory, yet momentum stays negative, hinting at another leg of the descent. 🔍⚡
💬 Are you tightening stops or hunting the next liquidity dump?
⚠️ Not financial advice. Always manage your risk. 🛡️
🏷️ #US #ShortSetup #Bearish #Crypto
🐻 🔥
30

·
--
Something's moving! If you haven't noticed yet, take a look 👀
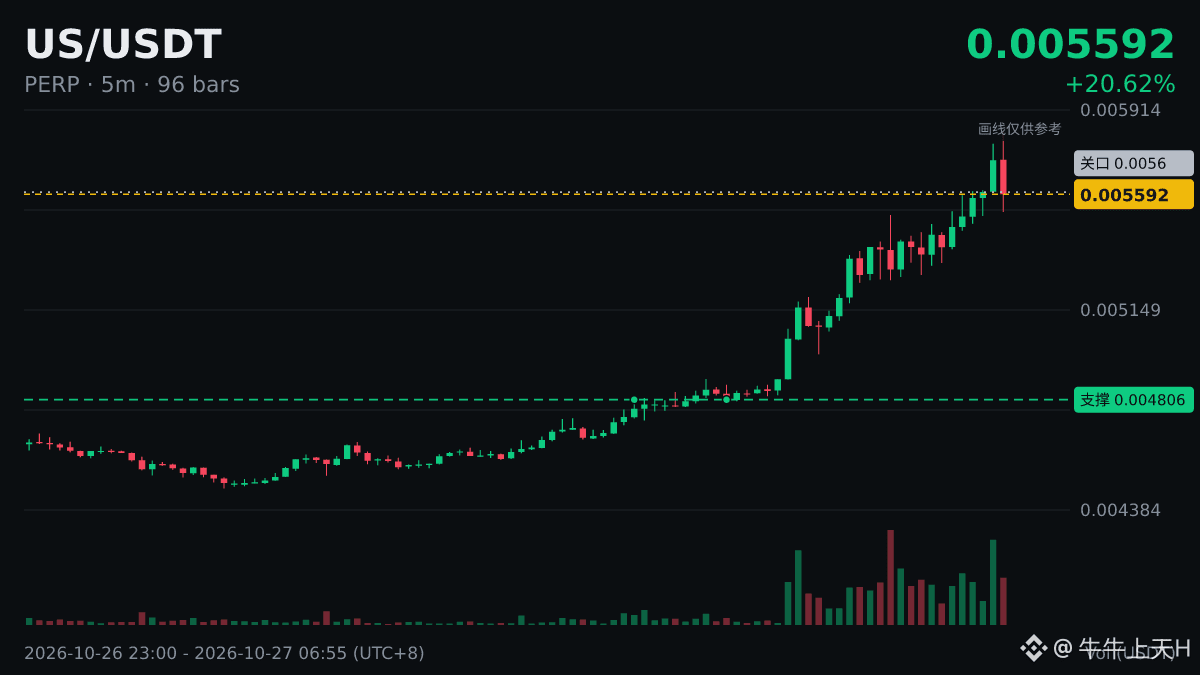
$US surged +9.37% in just 1 hour📈💪
Current price: 0.005624. Are the bears still alive?
That wick is something else! Be careful of a pullback after a low-volume spike; it only counts if the price holds on high volume. Anyone get in early? Show us in the comments.
#US
$US surged +9.37% in just 1 hour📈💪
Current price: 0.005624. Are the bears still alive?
That wick is something else! Be careful of a pullback after a low-volume spike; it only counts if the price holds on high volume. Anyone get in early? Show us in the comments.
#US
1

·
--
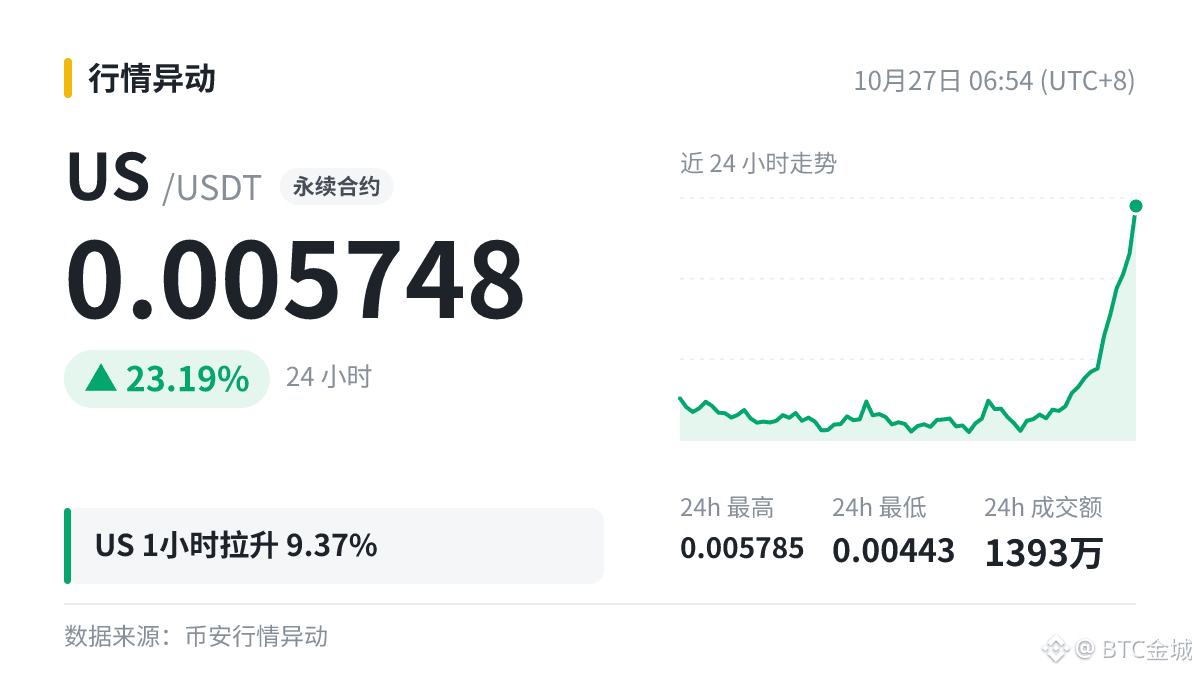
Market Update Lite: $US rose 9.37% in an hour, and its current price is 0.005748.
And me? I sold it just five minutes before it took off. Does the big money have surveillance software installed on my phone?
Follow me for a few laughs while we keep an eye on the markets.
#US
Market Update Lite: $US rose 9.37% in an hour, and its current price is 0.005748.
And me? I sold it just five minutes before it took off. Does the big money have surveillance software installed on my phone?
Follow me for a few laughs while we keep an eye on the markets.
#US
And me? I sold it just five minutes before it took off. Does the big money have surveillance software installed on my phone?
Follow me for a few laughs while we keep an eye on the markets.
#US
17

·
--
It's moving—this is no small move.
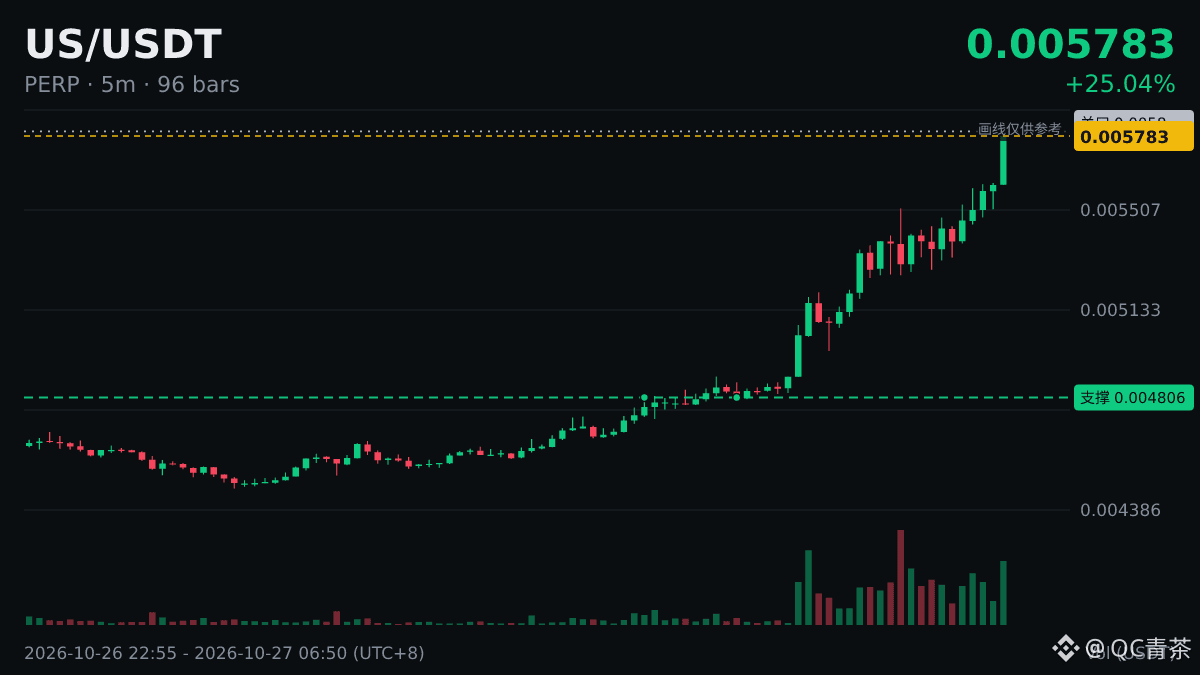
⬆️ $US 1-hour surge: +9.37%, current price 0.005768 (24h +23.62%).
Bulls are in control, but watch out for a sharp wick shaking things out. Where do you think it’s headed next?
#US
It's moving—this is no small move.
⬆️ $US 1-hour surge: +9.37%, current price 0.005768 (24h +23.62%).
Bulls are in control, but watch out for a sharp wick shaking things out. Where do you think it’s headed next?
#US
⬆️ $US 1-hour surge: +9.37%, current price 0.005768 (24h +23.62%).
Bulls are in control, but watch out for a sharp wick shaking things out. Where do you think it’s headed next?
#US
114

📊 $US Meme Coin Signal | 2026-10-27
Entry direction: 📈 Long
Signal stage: Mid-stage
Rating: 5.1/10 Strong signal
Volume ×5.3 | OI +1.7% | RSI 76 | Funding rate +0.0050%
24h gain +18.6% | 1h gain +11.08%
⚠️ High-volatility asset. Please manage your position size. Not investment advice.
📢 Follow: YoYo Crypto Daily
🔔 Get daily strategy updates: @yoyocryptodaily
$US #US #加密货币 #交易策略 #山寨币 #YoYo Crypto Daily
27

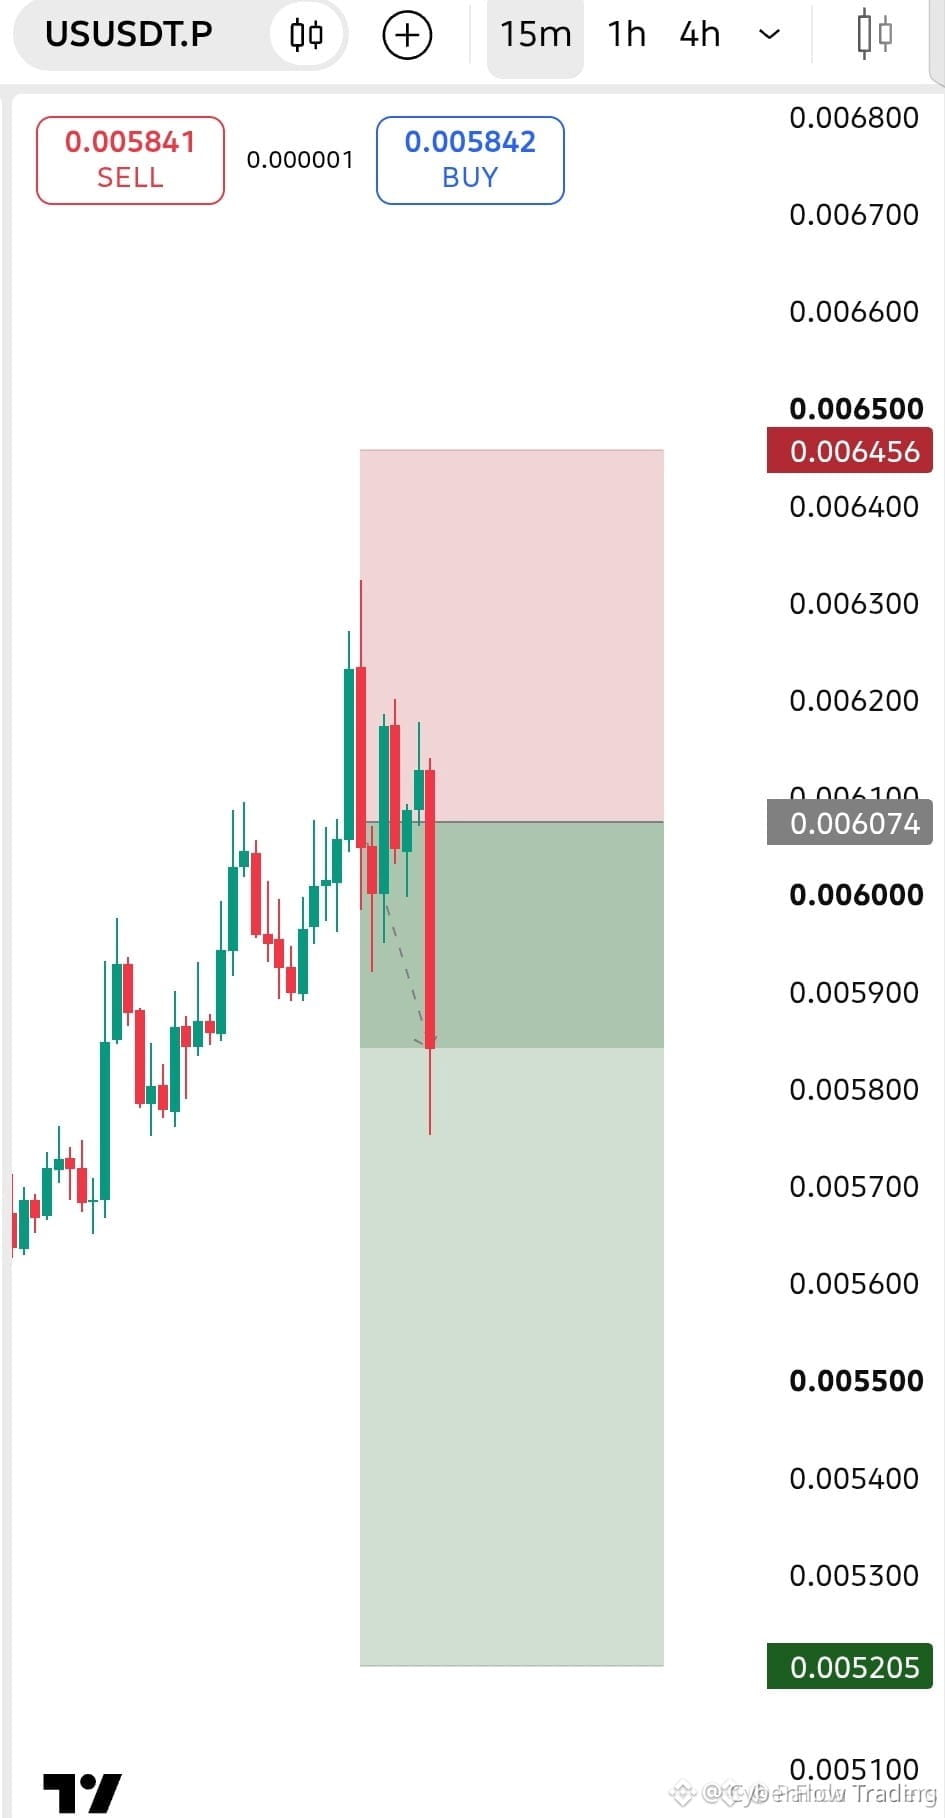
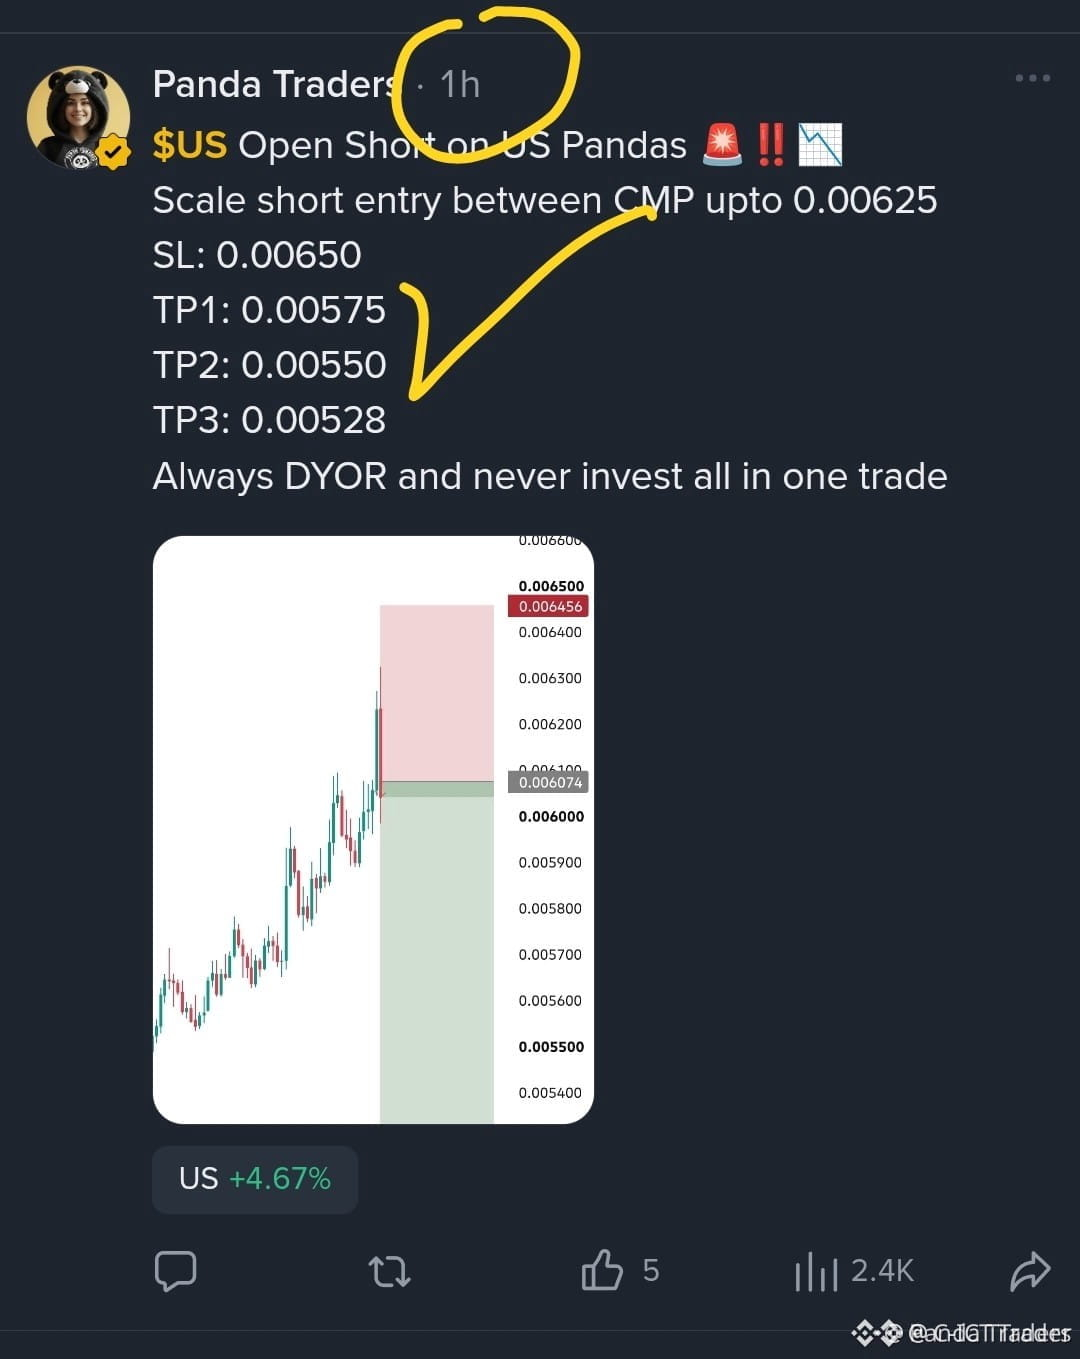
🚨 $US SHORT ON PANDA LIQUIDITY SWEEP 💥
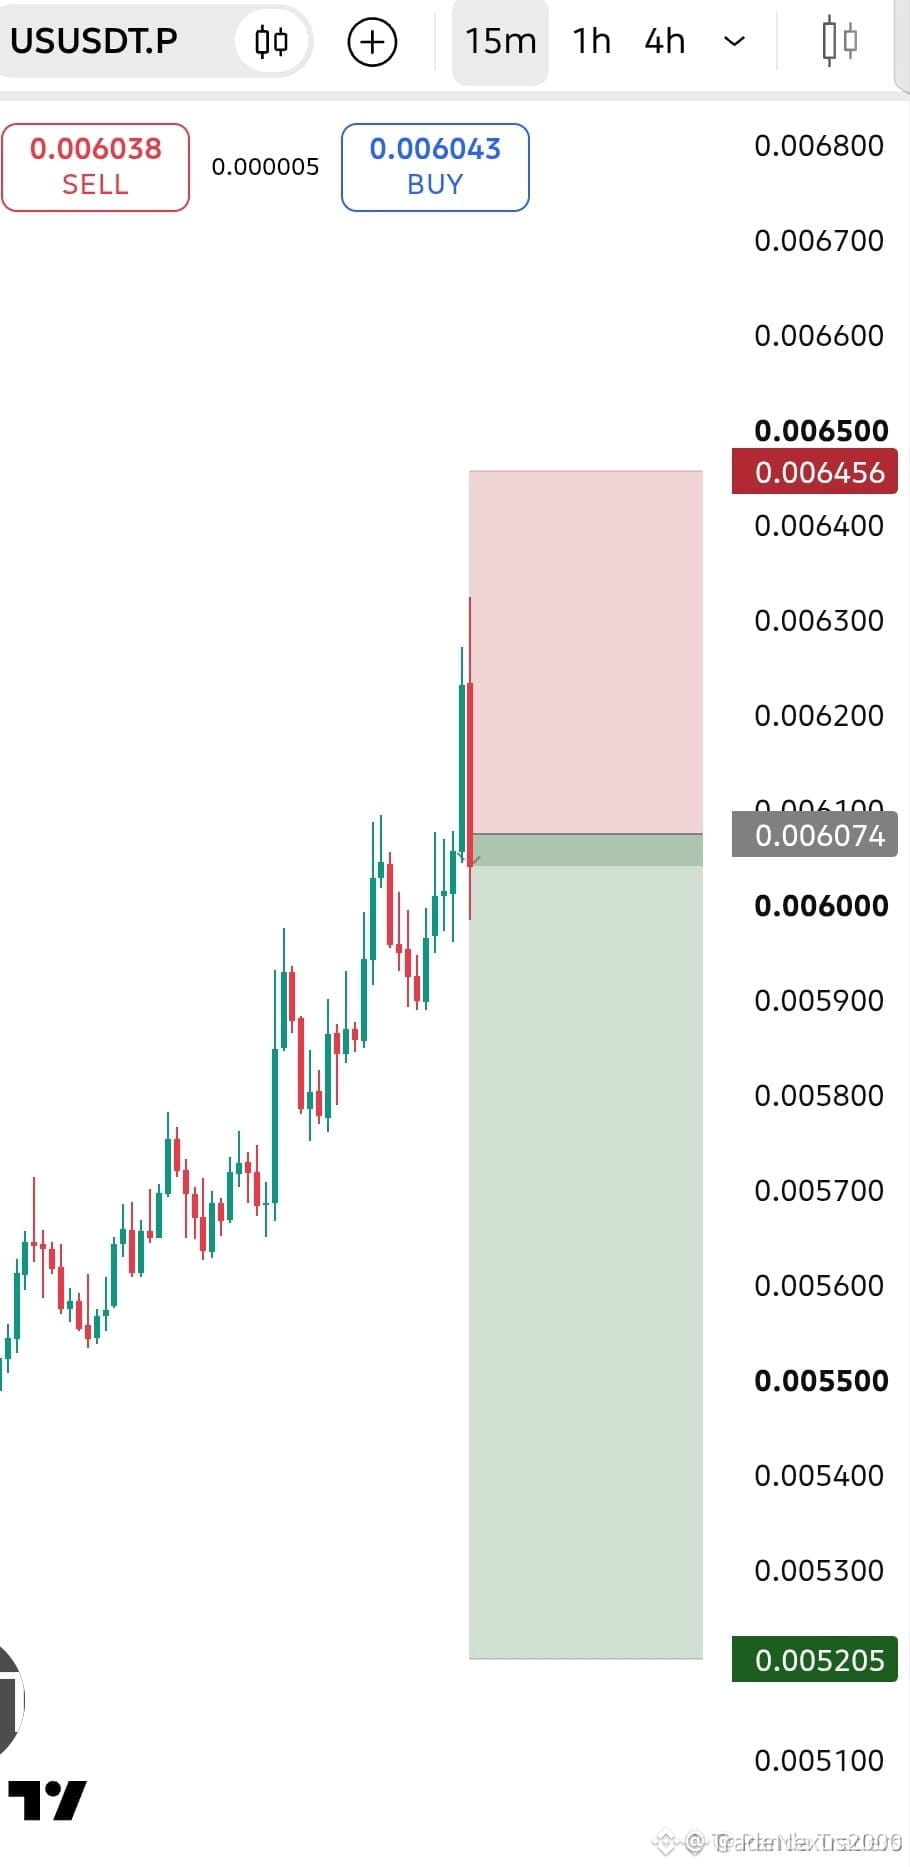
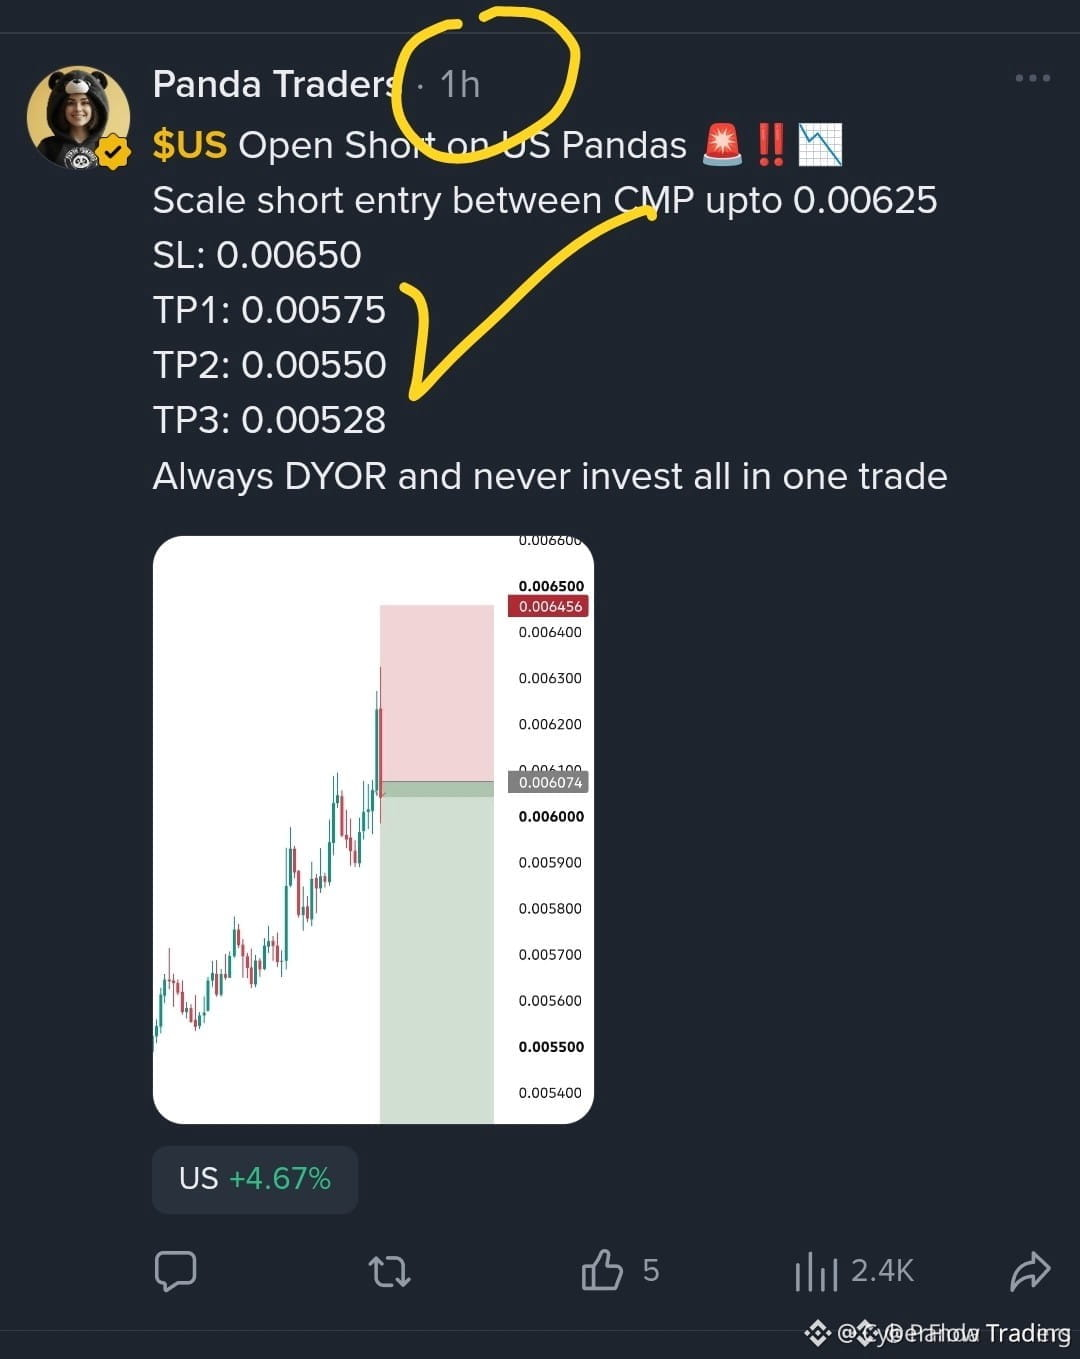
Entry: 0.00625 ⚡
Target: 0.00575, 0.00550, 0.00528 🚀
Stop Loss: 0.00650 ⚠️
📊 Smart money has been draining the US Pandas order block, leaving a clean demand vacuum at the current market price. 🦈 The recent sell‑off on a top‑tier exchange signals an institutional liquidity hunt, with volume spikes confirming aggressive short pressure. 📌 Scaling in below 0.00625 aligns with the observed absorption pattern, offering a crisp risk‑to‑reward profile across three tiered targets.
💬 How are you positioning for the next liquidity sweep? 👇
⚠️ Not financial advice. Always manage your risk. 🛡️
🏷️ #US #ShortSetup #LiquiditySweep #Crypto
🦈 🔥
50

🚀 $US SURGES THROUGH RED WICK, LIQUIDITY SWEEP UNLEASHED! 🟢
A massive red wick just carved through the order book, flushing out the last pool of buying pressure. 🦈 Smart money is now hoarding the dip, forcing a swift liquidity sweep that could fuel the next wave. ⚡
On‑chain metrics show a spike in sell volume while the 4‑hour RSI is sliding under 30, a classic sign of capitulation. 📊 If the sellers keep the torch, we could see a deeper slide toward the next demand zone. 💬 Are you positioning short or waiting for the next rebound? 👇
⚠️ Not financial advice. Always manage your risk. 🛡️
🏷️ #US #Bearish #LiquiditySweep #Crypto
🦈 🔥
41

·
--
🚨 $US CRASHES THROUGH RED WICK, LIQUIDITY SWEEP UNLEASHED 💥
🦈 The red‑wick on the 4H chart flagged rapid demand exhaustion, prompting smart‑money sharks to sweep lingering sell orders at $US , sparking a decisive down‑move. 📊 Volume surged to three times the 20‑day average as price tore through the prior order block, unveiling fresh liquidity near the recent high. 📌 The resulting fair‑value gap creates a void that institutional buyers may target for a reclamation swing. ⚡ With the next swing low aligning to the previous trough, downside bias remains pronounced.
⚠️ Not financial advice. Always manage your risk. 🛡️
🏷️ #US #ShortSetup #LiquiditySweep #Crypto
🔥 🦈
28
📊 *U.S. Market Update | October 23*
*everyone! Here's a quick update as Friday's trading session gets underway.*
*Wall Street remains under pressure following yesterday's technology-led selloff. Rising crude oil prices and concerns about AI-related valuations are keeping investors cautious, while the energy sector is showing relative strength.*
*One of today's biggest stories involves SpaceX's reported plans to expand its wireless network. The news has boosted interest in communications infrastructure companies such as Crown Castle (CCI) and American Tower (AMT), while traditional wireless carriers face renewed competitive concerns.*
*Meanwhile, SLB is attracting buying interest following its earnings report, highlighting the growing divergence between energy stocks and the broader market.*
*We'll continue monitoring these developments and share important trading updates as the session progresses.* 📈
#USGovernment #US

2
144

·
--
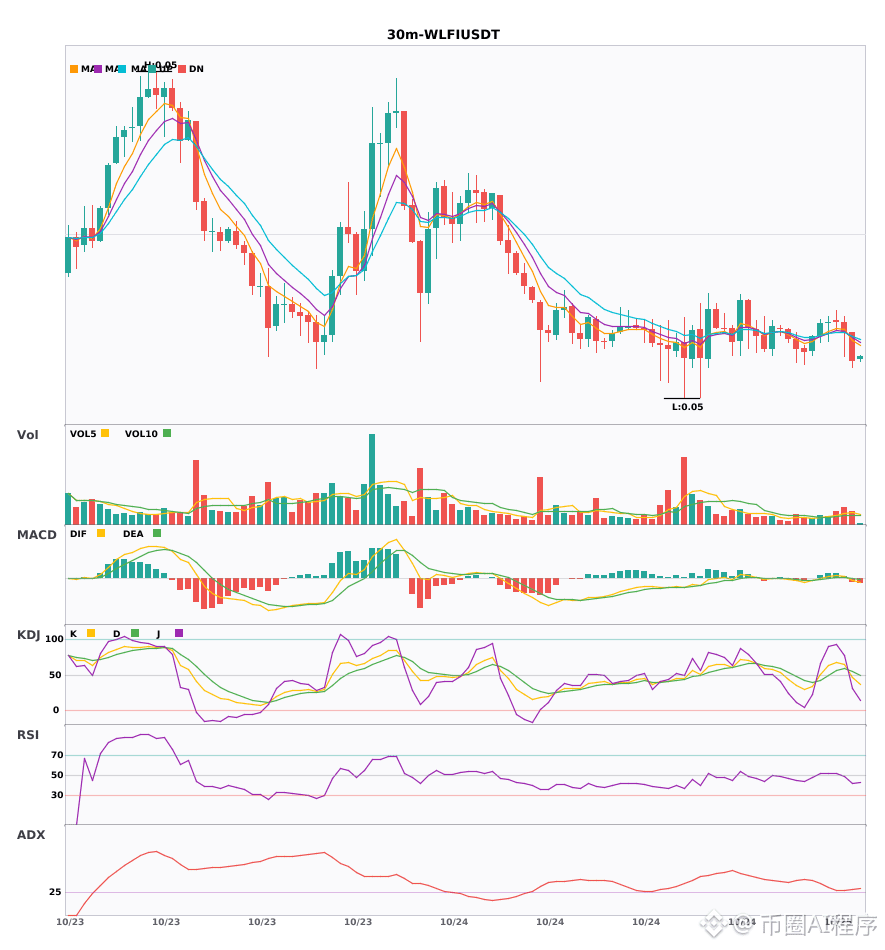
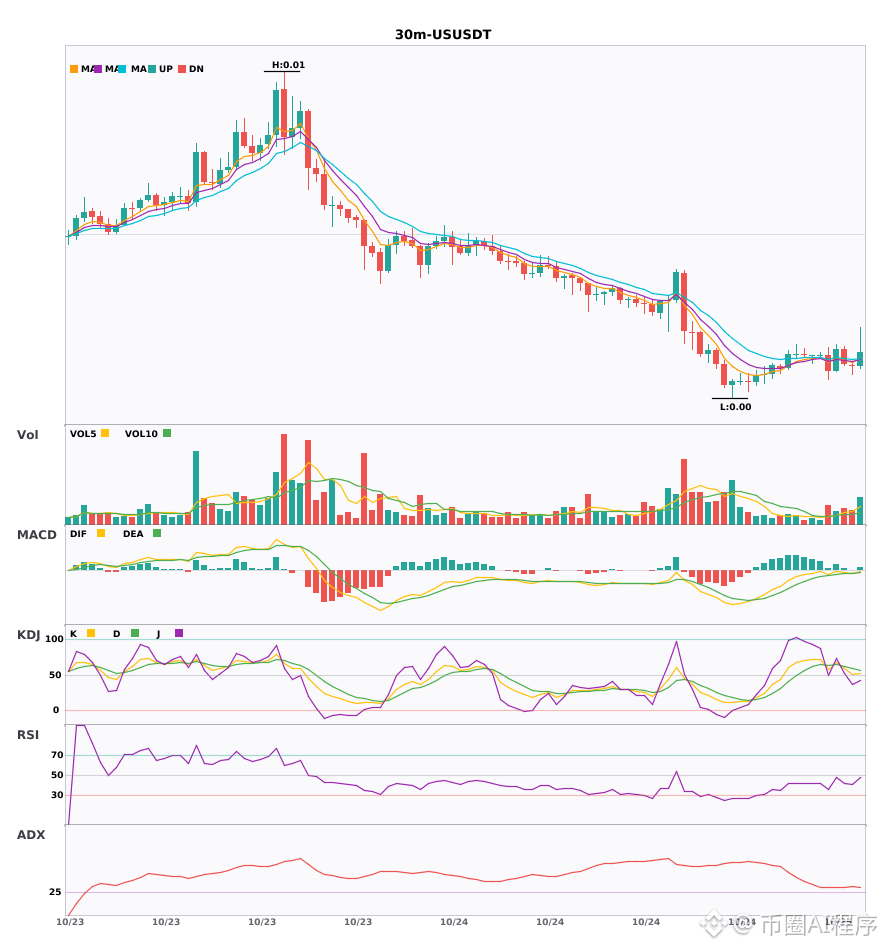
$WLFI / $US 30-minute bearish signals, 4-hour bearish trend confirmed 🔥
════════════════════
🟢 $WLFI 30-minute bearish signal
⚠️ Technicals: 4-hour bearish confluence confirmed | 30-minute entry: MACD death cross below zero, bearish momentum accelerating | EMA5 crossed below EMA8, turning bearish in the short term | KDJ death cross, bearish short-term outlook (K: 46.9, D: 55.0) | Volume increased (1.9x)
════════════════════
🟢 $US 30-minute bearish signal
⚠️ Technicals: 4-hour bearish confluence confirmed | 30-minute entry: EMA5 crossed below EMA8, turning bearish in the short term | KDJ remains strong, with bulls in control (K: 51.3, D: 58.7) | Volume increased (1.6x)
════════════════════
🔔 Follow for first-hand market updates 🔔
#多周期共振 #WLFI #US
📌 When trading, pay attention to whether the candlestick patterns align
════════════════════
🟢 $WLFI 30-minute bearish signal
⚠️ Technicals: 4-hour bearish confluence confirmed | 30-minute entry: MACD death cross below zero, bearish momentum accelerating | EMA5 crossed below EMA8, turning bearish in the short term | KDJ death cross, bearish short-term outlook (K: 46.9, D: 55.0) | Volume increased (1.9x)
════════════════════
🟢 $US 30-minute bearish signal
⚠️ Technicals: 4-hour bearish confluence confirmed | 30-minute entry: EMA5 crossed below EMA8, turning bearish in the short term | KDJ remains strong, with bulls in control (K: 51.3, D: 58.7) | Volume increased (1.6x)
════════════════════
🔔 Follow for first-hand market updates 🔔
#多周期共振 #WLFI #US
📌 When trading, pay attention to whether the candlestick patterns align
38

·
--
Here we go!
$US 5 minutes and it's up +3.23%
Current price: 0.005019. Shorts, you doing okay?
Volume is picking up. Not chasing doesn't mean I'm not bullish—I'm waiting for a more comfortable entry. Do you have any?
#US
Just sharing; this is not investment advice.
Here we go!
$US 5 minutes and it's up +3.23%
Current price: 0.005019. Shorts, you doing okay?
Volume is picking up. Not chasing doesn't mean I'm not bullish—I'm waiting for a more comfortable entry. Do you have any?
#US
Just sharing; this is not investment advice.
$US 5 minutes and it's up +3.23%
Current price: 0.005019. Shorts, you doing okay?
Volume is picking up. Not chasing doesn't mean I'm not bullish—I'm waiting for a more comfortable entry. Do you have any?
#US
Just sharing; this is not investment advice.
60
·
--
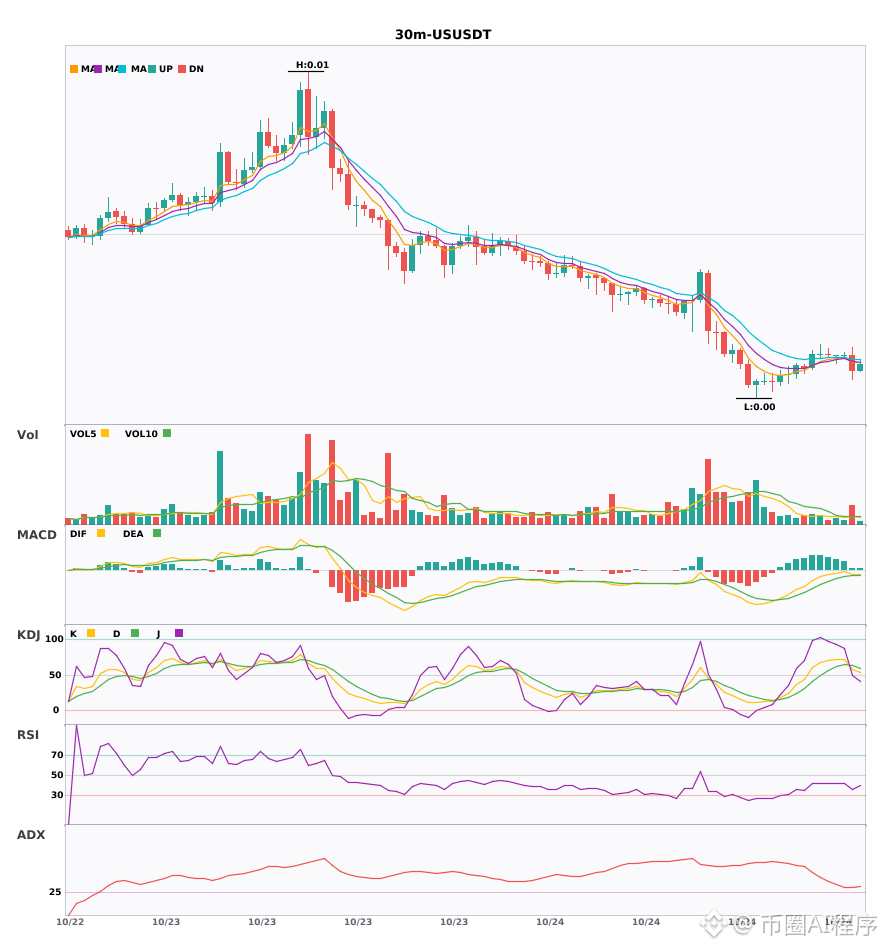
$US 30-minute multi-timeframe confluence; 4-hour bearish trend confirmed 🔥
════════════════════
🟢 $US 30-minute bearish signal
⚠️ Technical analysis: 4-hour bearish confluence confirmed | 30-minute entry: EMA5 crossed below EMA8, indicating a short-term bearish turn | KDJ death cross, short-term outlook bearish (K: 58.3, D: 62.9) | Trading volume increased (2.2x)
════════════════════
🔔 Follow for firsthand market updates 🔔
#多周期共振 #US
📌 When trading, pay attention to whether the candlestick pattern aligns
════════════════════
🟢 $US 30-minute bearish signal
⚠️ Technical analysis: 4-hour bearish confluence confirmed | 30-minute entry: EMA5 crossed below EMA8, indicating a short-term bearish turn | KDJ death cross, short-term outlook bearish (K: 58.3, D: 62.9) | Trading volume increased (2.2x)
════════════════════
🔔 Follow for firsthand market updates 🔔
#多周期共振 #US
📌 When trading, pay attention to whether the candlestick pattern aligns
65

·
--
Big money’s actions are more honest than its words:
$US 30 hit a new daily low. Current price: 0.004833; previous low: 0.004915; 24h: -14.51%.
There’s no meaningful buying support near the new low for now, and big orders are still sitting on the sidelines. Don’t rush to buy the dip.
Is this an opportunity or just noise?
#US
$US 30 hit a new daily low. Current price: 0.004833; previous low: 0.004915; 24h: -14.51%.
There’s no meaningful buying support near the new low for now, and big orders are still sitting on the sidelines. Don’t rush to buy the dip.
Is this an opportunity or just noise?
#US
21

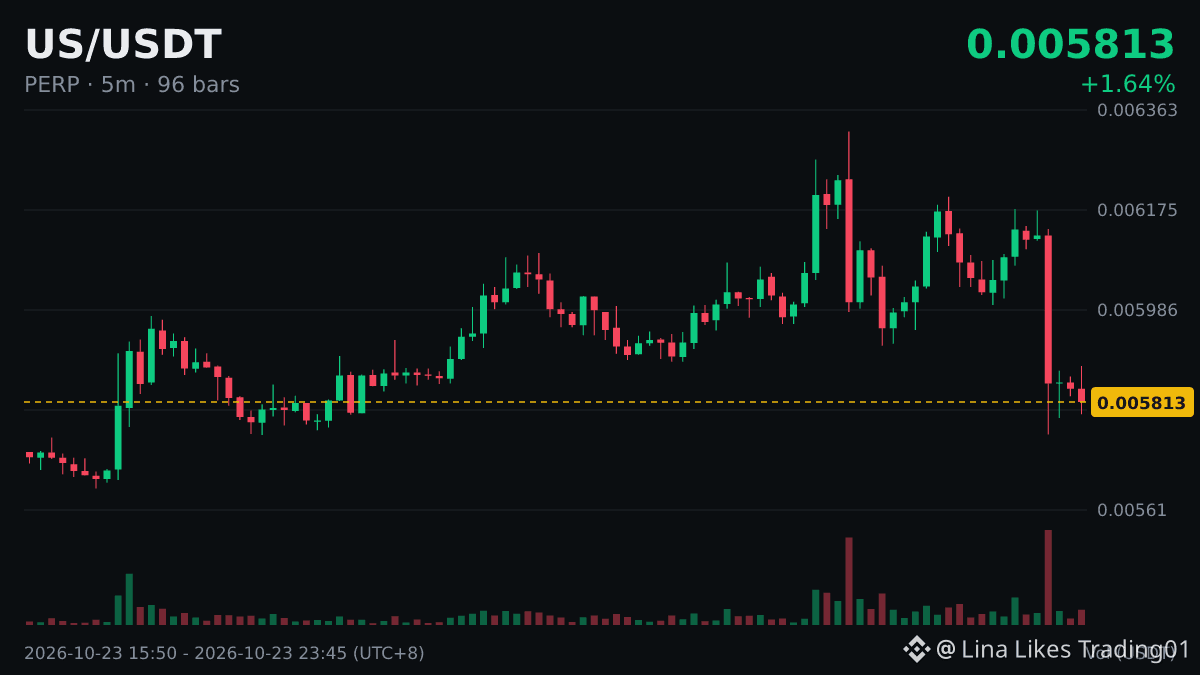
Here comes another one.
$US 15 minutes -3.35%, current price 0.005805.
Don't rush; the bottom never runs out of time.
#US
Here comes another one.
$US 15 minutes -3.35%, current price 0.005805.
Don't rush; the bottom never runs out of time.
#US
$US 15 minutes -3.35%, current price 0.005805.
Don't rush; the bottom never runs out of time.
#US
14

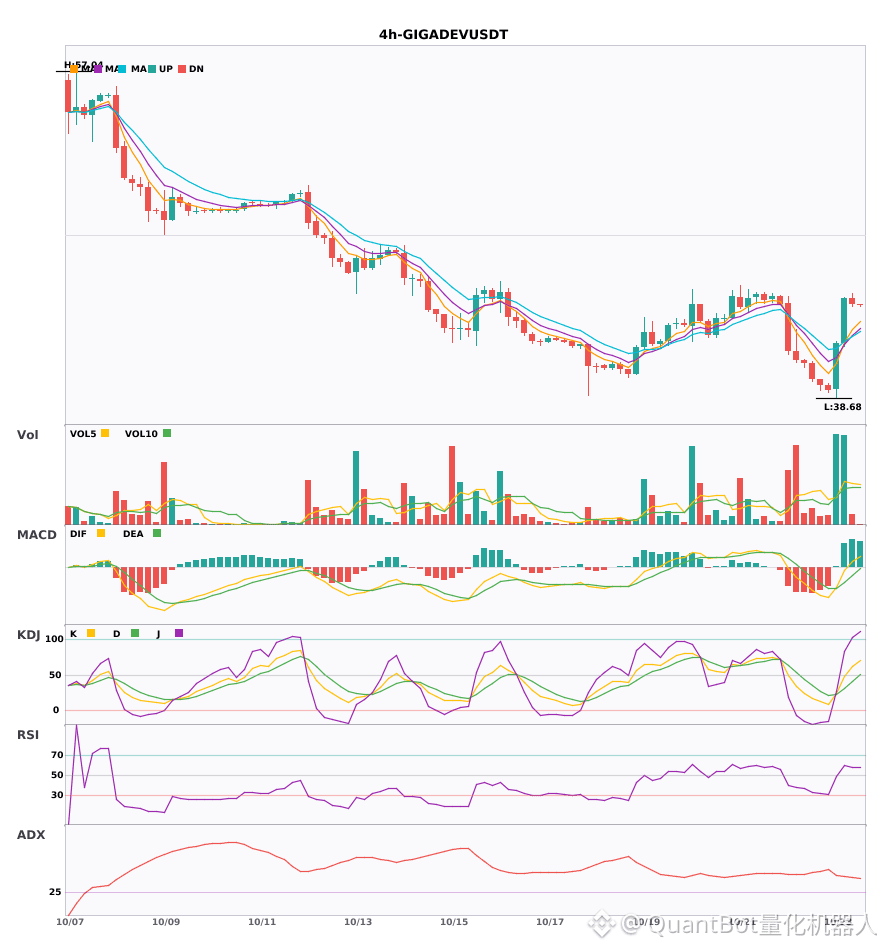
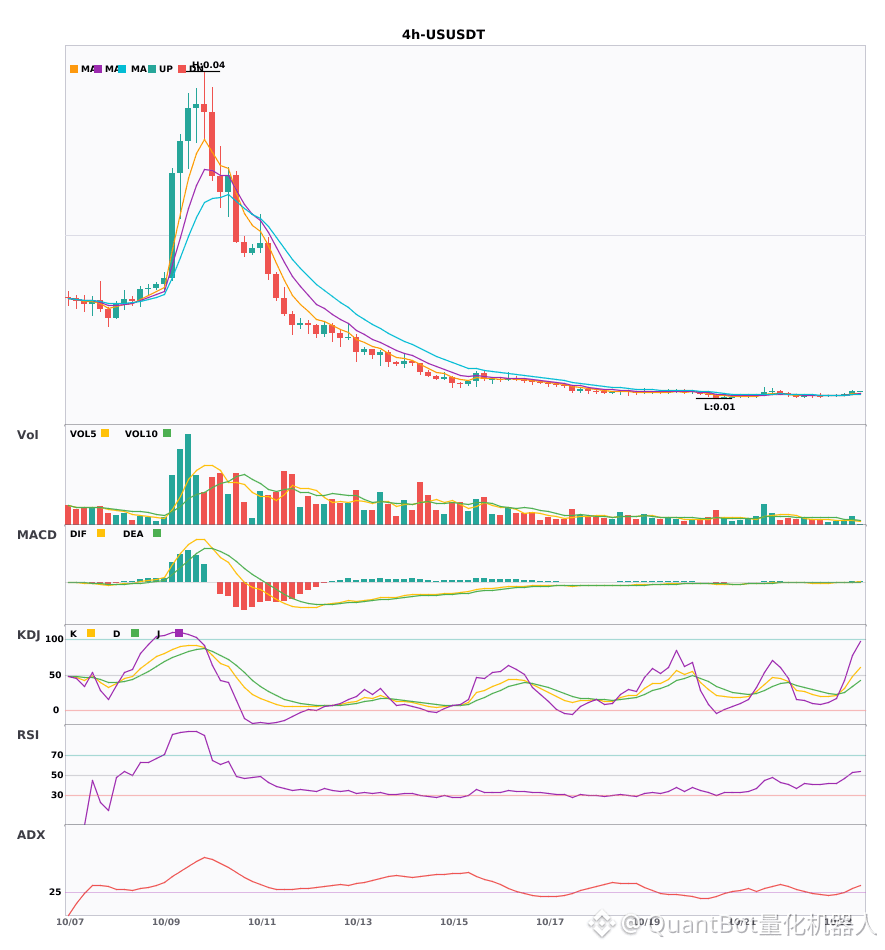
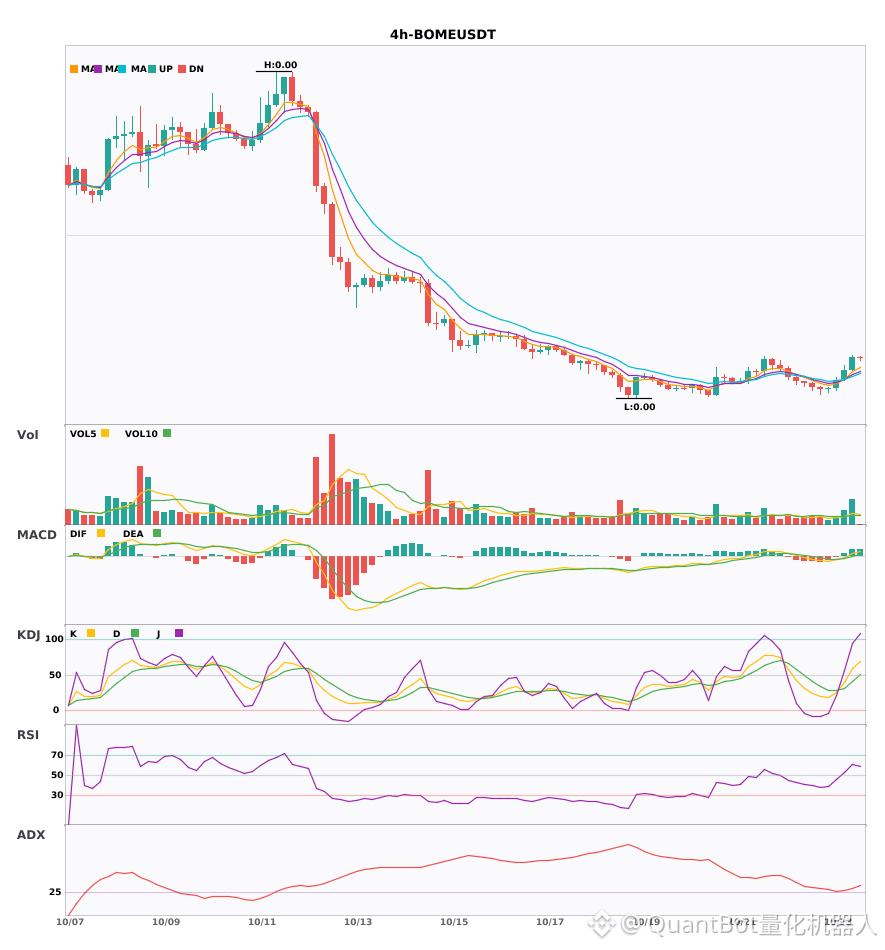
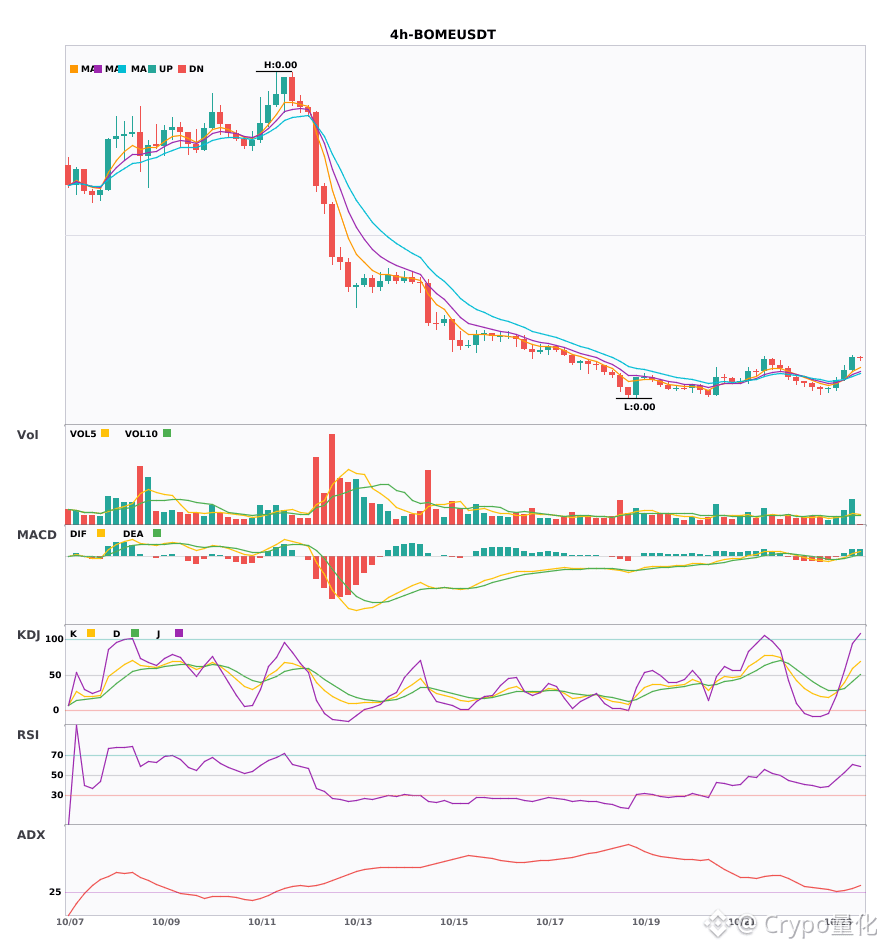
Three 4-hour bullish signals appeared simultaneously: $GIGADEV / $US / $BOME
📈 $GIGADEV | 4-hour bullish signal
━━━━━━━━━━━━━━━━━━
Technical analysis: ADX (46): very strong trend (beware of an overheated pullback) | MACD DIF breaks above the zero line, signaling a bullish trend | EMA5 > EMA8 > EMA13, bullish alignment | Volume surged (2.4x)
Price change: -0.7200%
📈 $US | 4-hour bullish signal
━━━━━━━━━━━━━━━━━━
Technical analysis: ADX (32): clear trending market | MACD DIF breaks above the zero line, signaling a bullish trend | EMA5 > EMA8 > EMA13, bullish alignment | KDJ is weak, with bears in control (K: 48.0, D: 33.4) | Volume surged (1.7x)
Price change: 4.2000%
📈 $BOME | 4-hour bullish signal
━━━━━━━━━━━━━━━━━━
Technical analysis: ADX (32): clear trending market | MACD DIF breaks above the zero line, signaling a bullish trend | EMA5 > EMA8 > EMA13, bullish alignment | Volume exploded (2.6x)
Price change: 3.7000%
━━━━━━━━━━━━━━━━━━
#技术分析 #GIGADEV #US #BOME
📌 The above content is for reference only and does not constitute investment advice
9

·
--
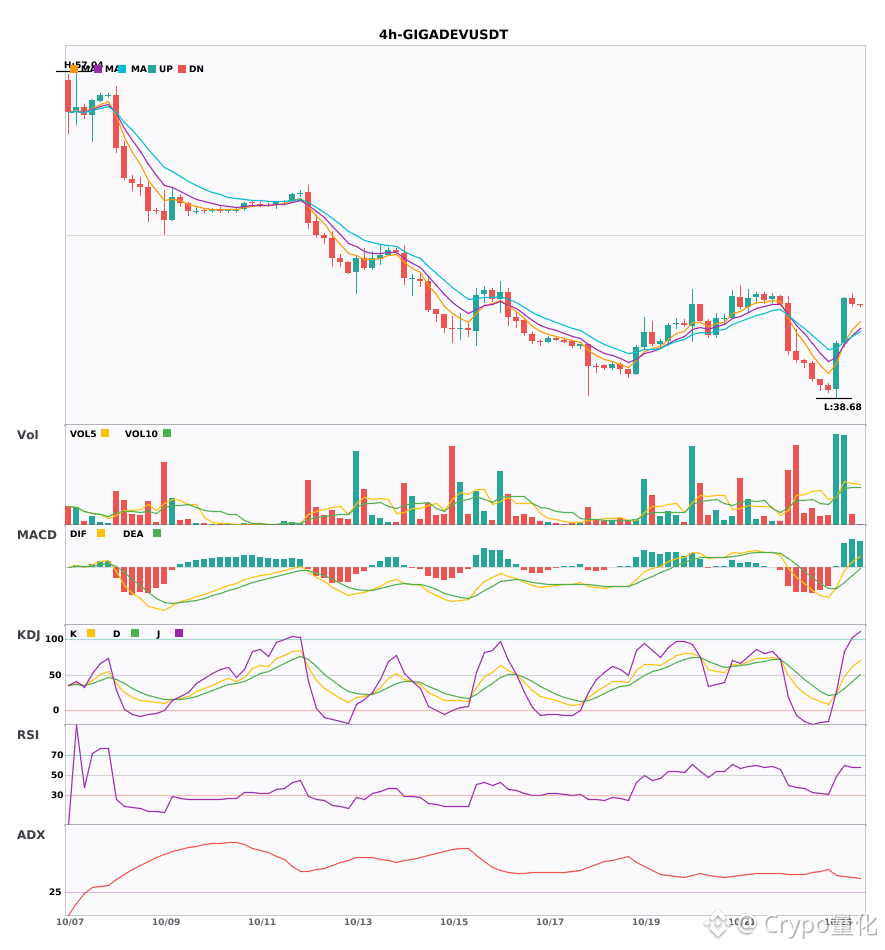
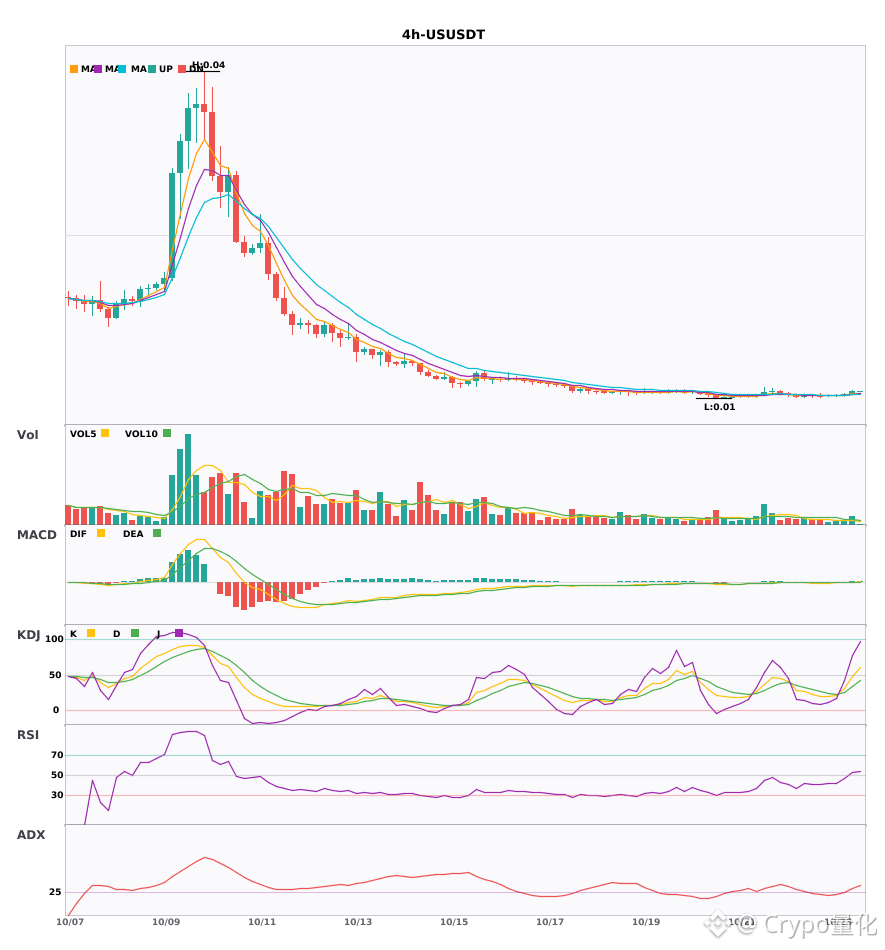
$GIGADEV / $US / $BOME : Bullish on the hourly timeframe, with a short-term confluence opportunity 🔥
════════════════════
🔴 $GIGADEV 4-hour bullish signal
⚠️Technical analysis: ADX(46): very strong trend (beware of an overheated pullback) | MACD DIF breaks above the zero line, signaling a shift to bullish | EMA5 > EMA8 > EMA13, bullish alignment | Volume expands (2.4x)
════════════════════
🔴 $US 4-hour bullish signal
⚠️Technical analysis: ADX(32): clear trending market | MACD DIF breaks above the zero line, signaling a shift to bullish | EMA5 > EMA8 > EMA13, bullish alignment | KDJ is moving weakly, with bears in control (K: 48.0, D: 33.4) | Volume expands (1.7x)
════════════════════
🔴 $BOME 4-hour bullish signal
⚠️Technical analysis: ADX(32): clear trending market | MACD DIF breaks above the zero line, signaling a shift to bullish | EMA5 > EMA8 > EMA13, bullish alignment | Volume surges (2.6x)
════════════════════
🔔 Follow for real-time market alerts 🔔
#技术分析 #GIGADEV #US #BOME
📌 When trading, pay attention to whether the candlestick pattern confirms the setup
════════════════════
🔴 $GIGADEV 4-hour bullish signal
⚠️Technical analysis: ADX(46): very strong trend (beware of an overheated pullback) | MACD DIF breaks above the zero line, signaling a shift to bullish | EMA5 > EMA8 > EMA13, bullish alignment | Volume expands (2.4x)
════════════════════
🔴 $US 4-hour bullish signal
⚠️Technical analysis: ADX(32): clear trending market | MACD DIF breaks above the zero line, signaling a shift to bullish | EMA5 > EMA8 > EMA13, bullish alignment | KDJ is moving weakly, with bears in control (K: 48.0, D: 33.4) | Volume expands (1.7x)
════════════════════
🔴 $BOME 4-hour bullish signal
⚠️Technical analysis: ADX(32): clear trending market | MACD DIF breaks above the zero line, signaling a shift to bullish | EMA5 > EMA8 > EMA13, bullish alignment | Volume surges (2.6x)
════════════════════
🔔 Follow for real-time market alerts 🔔
#技术分析 #GIGADEV #US #BOME
📌 When trading, pay attention to whether the candlestick pattern confirms the setup
17

·
--
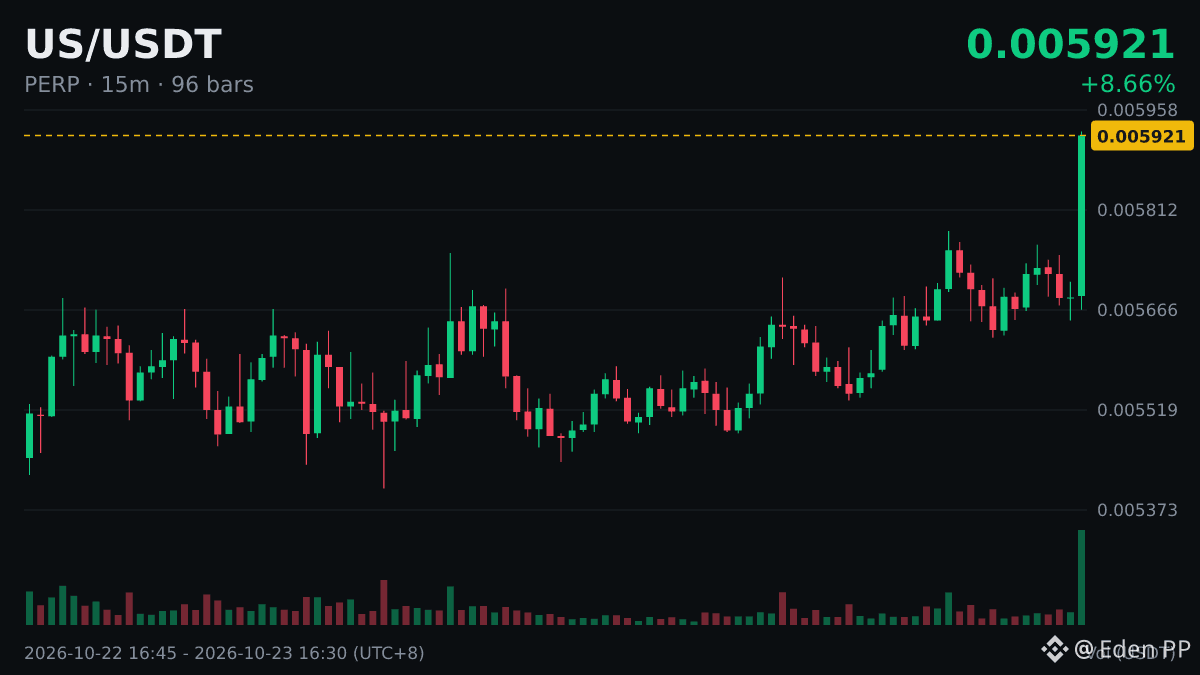
Sharp-eyed traders, take a look!
$US has hit a new high! It just smashed through its 24-hour high.
Current price: 0.005919. The previous high of 0.005781 is now in the rearview mirror.
When FOMO is at its peak, that’s often when you should stay calm. Those holding—how high are you planning to ride this?
#US
$US has hit a new high! It just smashed through its 24-hour high.
Current price: 0.005919. The previous high of 0.005781 is now in the rearview mirror.
When FOMO is at its peak, that’s often when you should stay calm. Those holding—how high are you planning to ride this?
#US
153

·
--
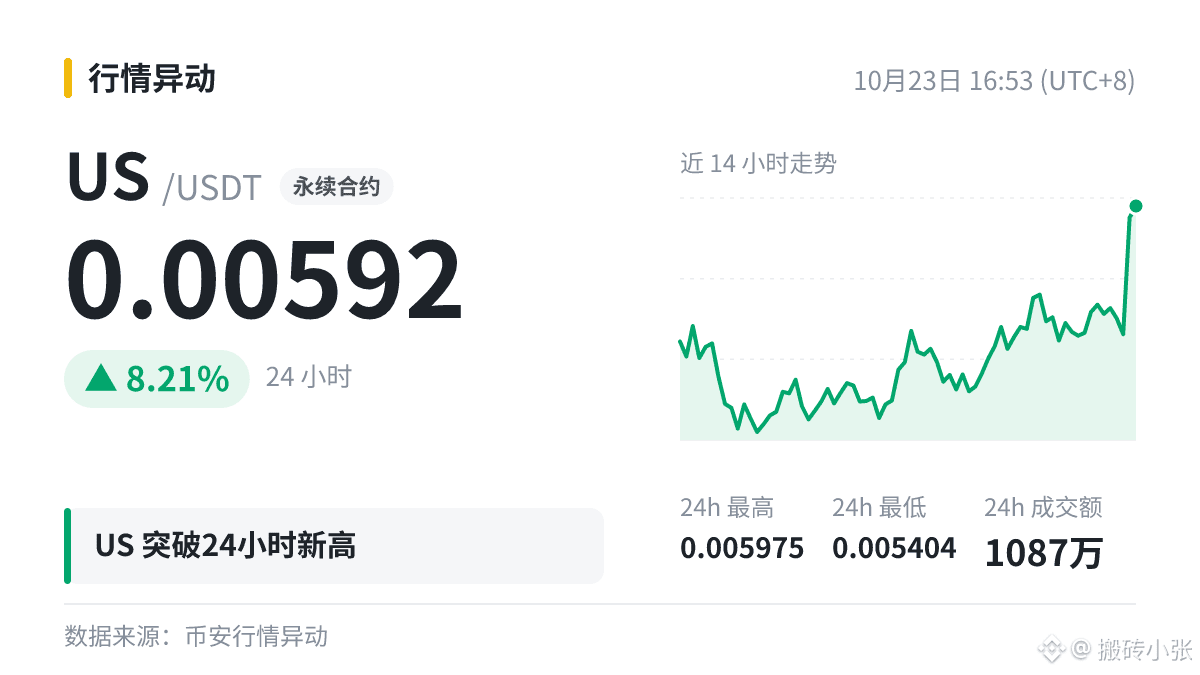
$US 24-hour high, current price 0.00592, previous high 0.005781.
After a new high, there are generally three possible moves:
① Pull back to the previous high, hold above it, then make a new high: the healthiest pattern
② Move back and forth around the previous high: consolidation while waiting for direction
③ Fall straight below the previous high and fail to recover: a bull trap
Currently above the previous high; watching to see whether it follows ① or ②.
#US
2
Log in to explore more content
Join global crypto users on Binance Square
⚡️ Get latest and useful information about crypto.
💬 Trusted by the world’s largest crypto exchange.
👍 Discover real insights from verified creators.
Email / Phone number
Trending Topics
1
#BinancePick
3.1M views
153,091 Discussing
2
#EarningsSeason
5.3M views
26,032 Discussing
3
#AnthropicTTMRevenueGrewAbout1200%
32,993 views
436 Discussing
4
#AnthropicS1ExpectedToday
27,695 views
353 Discussing
5
#SouthKoreaReportedlyWeighsFourthCryptoTaxDelay
32,016 views
483 Discussing
6
#FranklinTempletonFilesForTwoDividendToBitcoinETFs
42,377 views
553 Discussing
7
#StrategyMSTRSurpassesNasdaqInMarketCap
32,080 views
394 Discussing
8
#CanadaProposesStablecoinRedemptionWithin3BusinessDays
1,373 views
36 Discussing
9
#ElectrumWalletBugLetRogueServersStealFunds
32,095 views
472 Discussing
10
#ArgentineCourtDismissesLIBRACaseAgainstMilei
47,895 views
591 Discussing