

MOOPLY
327 Posts

MOOPLY
Report
Block User
🚀 Crypto News & AI-Powered Insights | 📊 BTC, Altcoins & Market Trends | 🐋 Whale Alerts | 🔥 Trending Tokens | 💡 Research, Not Hype | NFA
Open Trade
Frequent Trader
3.7 Years
32 Following
78 Followers
180 Liked
Posts
Portfolio
All
Quotes
Videos
·
--
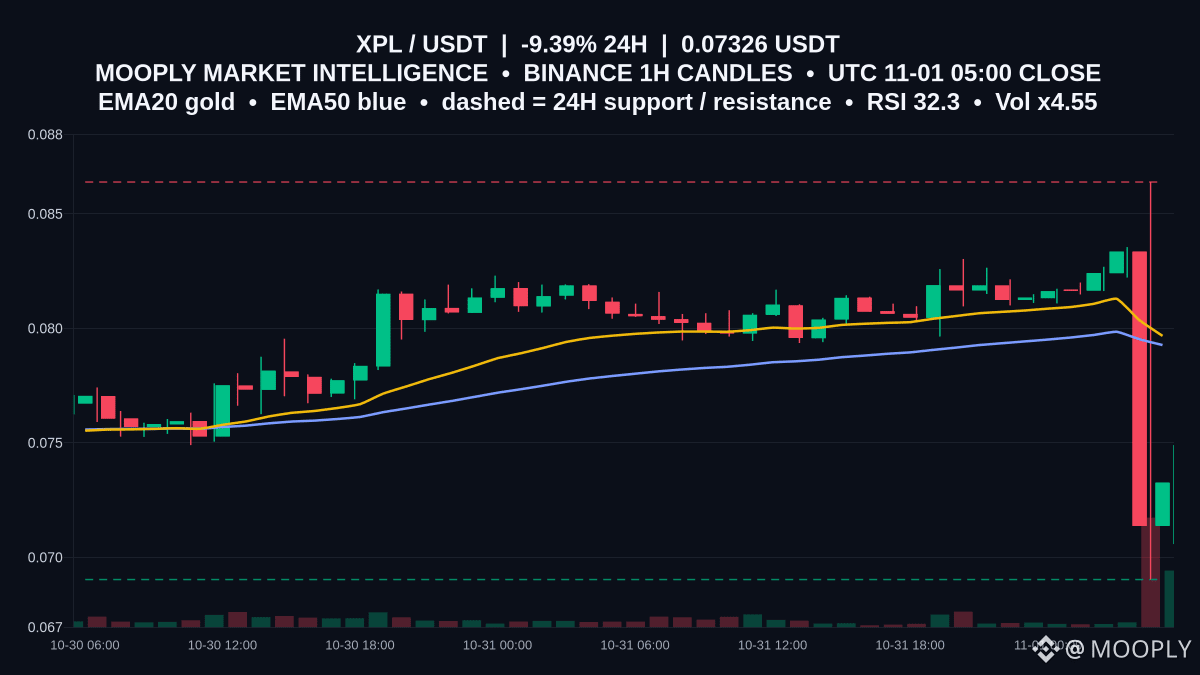
$XPL slid to 0.07326 (-9.394% 24h) as 1h volume spiked 4.55x.
Price sits well below EMA20 0.07967 and EMA50 0.07927 while RSI is 32.28, so sellers are stretched into nearby levels. This is a range: 0.06903 support versus 0.08639 resistance. Holding 0.06903 keeps the case for mean reversion toward the EMA cluster; a firm close back above 0.07927–0.07967 would reopen 0.08639. A clean break beneath 0.06903 would hand momentum back to bears. ATR14 is 0.00248, so tests at the edges can accelerate.
Are you watching for a base at 0.06903 or a reclaim of 0.07927–0.07967 first?
Not financial advice.
#XPL #ChartStructure #RangeStructure
$XPL slid to 0.07326 (-9.394% 24h) as 1h volume spiked 4.55x.
Price sits well below EMA20 0.07967 and EMA50 0.07927 while RSI is 32.28, so sellers are stretched into nearby levels. This is a range: 0.06903 support versus 0.08639 resistance. Holding 0.06903 keeps the case for mean reversion toward the EMA cluster; a firm close back above 0.07927–0.07967 would reopen 0.08639. A clean break beneath 0.06903 would hand momentum back to bears. ATR14 is 0.00248, so tests at the edges can accelerate.
Are you watching for a base at 0.06903 or a reclaim of 0.07927–0.07967 first?
Not financial advice.
#XPL #ChartStructure #RangeStructure
Price sits well below EMA20 0.07967 and EMA50 0.07927 while RSI is 32.28, so sellers are stretched into nearby levels. This is a range: 0.06903 support versus 0.08639 resistance. Holding 0.06903 keeps the case for mean reversion toward the EMA cluster; a firm close back above 0.07927–0.07967 would reopen 0.08639. A clean break beneath 0.06903 would hand momentum back to bears. ATR14 is 0.00248, so tests at the edges can accelerate.
Are you watching for a base at 0.06903 or a reclaim of 0.07927–0.07967 first?
Not financial advice.
#XPL #ChartStructure #RangeStructure
13
·
--
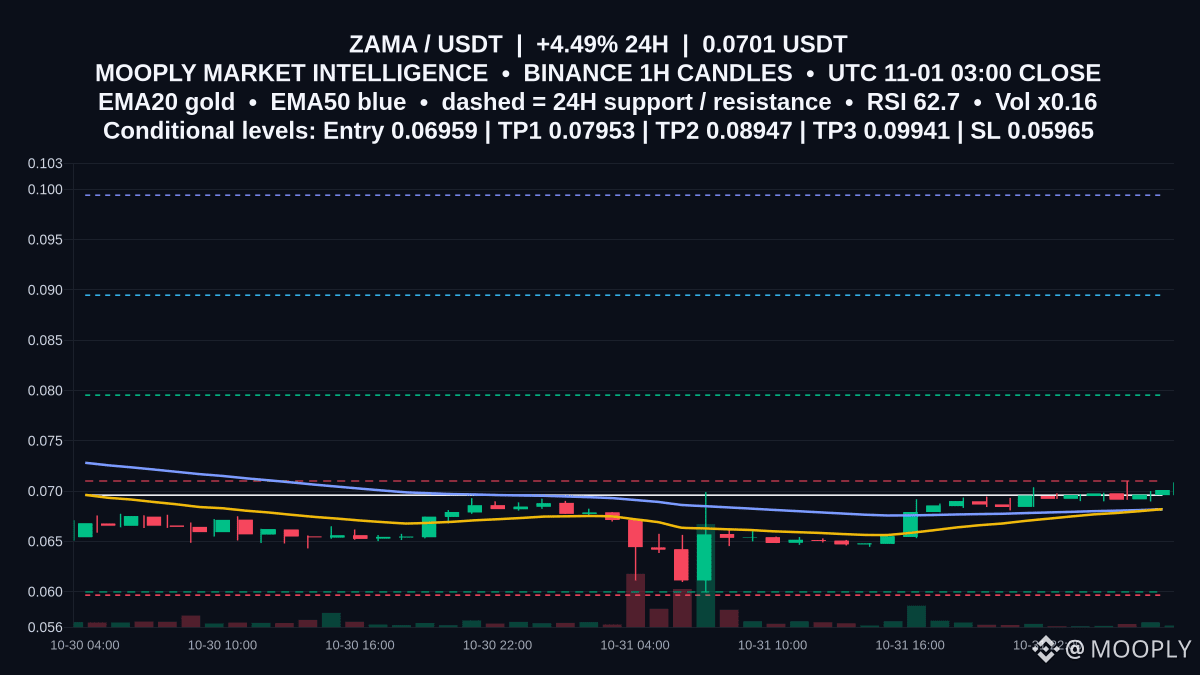
$ZAMA is pressing the 0.071 cap with price at 0.0701 after a +4.485% day.
EMA20 has nudged above EMA50 (0.0682 vs 0.06819) and RSI 62.68 supports a bullish tilt. With activity light (Vol x0.16), a decisive 1h close above 0.071 matters to unlock upside.
📍 Potential entry: 0.06959
🎯 Target 1: 0.07953
🎯 Target 2: 0.08947
🛑 Stop / invalidation: 0.05965
Confirmation improves on a clean break and hold above 0.071; slipping back under 0.06959 leaves the scenario unproven. A move toward 0.05997 support—and especially below 0.05965—would invalidate the setup.
Would you like an alert if the next 1h candle closes above 0.071?
Not financial advice.
#ZAMA #SetupWatch #BullishStructure
$ZAMA is pressing the 0.071 cap with price at 0.0701 after a +4.485% day.
EMA20 has nudged above EMA50 (0.0682 vs 0.06819) and RSI 62.68 supports a bullish tilt. With activity light (Vol x0.16), a decisive 1h close above 0.071 matters to unlock upside.
📍 Potential entry: 0.06959
🎯 Target 1: 0.07953
🎯 Target 2: 0.08947
🛑 Stop / invalidation: 0.05965
Confirmation improves on a clean break and hold above 0.071; slipping back under 0.06959 leaves the scenario unproven. A move toward 0.05997 support—and especially below 0.05965—would invalidate the setup.
Would you like an alert if the next 1h candle closes above 0.071?
Not financial advice.
#ZAMA #SetupWatch #BullishStructure
EMA20 has nudged above EMA50 (0.0682 vs 0.06819) and RSI 62.68 supports a bullish tilt. With activity light (Vol x0.16), a decisive 1h close above 0.071 matters to unlock upside.
📍 Potential entry: 0.06959
🎯 Target 1: 0.07953
🎯 Target 2: 0.08947
🛑 Stop / invalidation: 0.05965
Confirmation improves on a clean break and hold above 0.071; slipping back under 0.06959 leaves the scenario unproven. A move toward 0.05997 support—and especially below 0.05965—would invalidate the setup.
Would you like an alert if the next 1h candle closes above 0.071?
Not financial advice.
#ZAMA #SetupWatch #BullishStructure
40
·
--
Binance co‑CEO says withdrawals could resume within 42 hours after reported hot‑wallet security incident
Binance’s leadership has communicated a targeted 42‑hour timeline for restoring withdrawals, stressing that any restart will follow security verification. The company also says deposits and unaffected services remain operational.
Key points
- Management reports a hot‑wallet breach and says law‑enforcement cooperation has frozen some affected assets.
- The firm states it will cover user losses from company funds and that token holdings have been allocated for compensation.
- Any restart of withdrawals is described as conditional on further security checks and verification.
Counterpoint
- Several details — including exact frozen amounts and the final timeline — are reported by the firm and remain subject to outside verification and potential change.
Takeaway
Expect updates; the stated timeline is tentative and hinges on security clearance before normal withdrawal flows resume.
#CryptoSecurity #ExchangeOutage #Withdrawals #HotWallet
Binance co‑CEO says withdrawals could resume within 42 hours after reported hot‑wallet security incident
Binance’s leadership has communicated a targeted 42‑hour timeline for restoring withdrawals, stressing that any restart will follow security verification. The company also says deposits and unaffected services remain operational.
Key points
- Management reports a hot‑wallet breach and says law‑enforcement cooperation has frozen some affected assets.
- The firm states it will cover user losses from company funds and that token holdings have been allocated for compensation.
- Any restart of withdrawals is described as conditional on further security checks and verification.
Counterpoint
- Several details — including exact frozen amounts and the final timeline — are reported by the firm and remain subject to outside verification and potential change.
Takeaway
Expect updates; the stated timeline is tentative and hinges on security clearance before normal withdrawal flows resume.
#CryptoSecurity #ExchangeOutage #Withdrawals #HotWallet
Binance’s leadership has communicated a targeted 42‑hour timeline for restoring withdrawals, stressing that any restart will follow security verification. The company also says deposits and unaffected services remain operational.
Key points
- Management reports a hot‑wallet breach and says law‑enforcement cooperation has frozen some affected assets.
- The firm states it will cover user losses from company funds and that token holdings have been allocated for compensation.
- Any restart of withdrawals is described as conditional on further security checks and verification.
Counterpoint
- Several details — including exact frozen amounts and the final timeline — are reported by the firm and remain subject to outside verification and potential change.
Takeaway
Expect updates; the stated timeline is tentative and hinges on security clearance before normal withdrawal flows resume.
#CryptoSecurity #ExchangeOutage #Withdrawals #HotWallet

43
·
--
How "SAFU" was deployed in a major exchange breach — what we know
A large exchange reported a hot‑wallet breach and said it has replenished most affected assets using corporate treasury, a dedicated user‑protection fund (SAFU) and insurance reserves. The company claims roughly 90% recovery and says law enforcement and partners have frozen a portion of stolen funds.
Key points:
- SAFU functions as a backstop: a reserve meant to cover user losses when hot‑wallets are compromised.
- Coverage reported to come from three sources: corporate funds, the SAFU pool, and futures insurance—illustrating scale can matter when exchanges self‑insure.
- Operational impact: deposits remained operational per the company; withdrawals were subject to security checks.
Counterpoint:
- Company figures and timelines are company statements; some asset recoveries and the fate of less‑liquid tokens remain unverified.
Takeaway:
SAFU‑style reserves can mitigate consumer losses but don’t replace independent transparency, third‑party audits, and clearer industry standards for custody and insurance.
#SAFU #ExchangeSecurity #CryptoCustody #CryptoInsurance
How "SAFU" was deployed in a major exchange breach — what we know
A large exchange reported a hot‑wallet breach and said it has replenished most affected assets using corporate treasury, a dedicated user‑protection fund (SAFU) and insurance reserves. The company claims roughly 90% recovery and says law enforcement and partners have frozen a portion of stolen funds.
Key points:
- SAFU functions as a backstop: a reserve meant to cover user losses when hot‑wallets are compromised.
- Coverage reported to come from three sources: corporate funds, the SAFU pool, and futures insurance—illustrating scale can matter when exchanges self‑insure.
- Operational impact: deposits remained operational per the company; withdrawals were subject to security checks.
Counterpoint:
- Company figures and timelines are company statements; some asset recoveries and the fate of less‑liquid tokens remain unverified.
Takeaway:
SAFU‑style reserves can mitigate consumer losses but don’t replace independent transparency, third‑party audits, and clearer industry standards for custody and insurance.
#SAFU #ExchangeSecurity #CryptoCustody #CryptoInsurance
A large exchange reported a hot‑wallet breach and said it has replenished most affected assets using corporate treasury, a dedicated user‑protection fund (SAFU) and insurance reserves. The company claims roughly 90% recovery and says law enforcement and partners have frozen a portion of stolen funds.
Key points:
- SAFU functions as a backstop: a reserve meant to cover user losses when hot‑wallets are compromised.
- Coverage reported to come from three sources: corporate funds, the SAFU pool, and futures insurance—illustrating scale can matter when exchanges self‑insure.
- Operational impact: deposits remained operational per the company; withdrawals were subject to security checks.
Counterpoint:
- Company figures and timelines are company statements; some asset recoveries and the fate of less‑liquid tokens remain unverified.
Takeaway:
SAFU‑style reserves can mitigate consumer losses but don’t replace independent transparency, third‑party audits, and clearer industry standards for custody and insurance.
#SAFU #ExchangeSecurity #CryptoCustody #CryptoInsurance

80
·
--
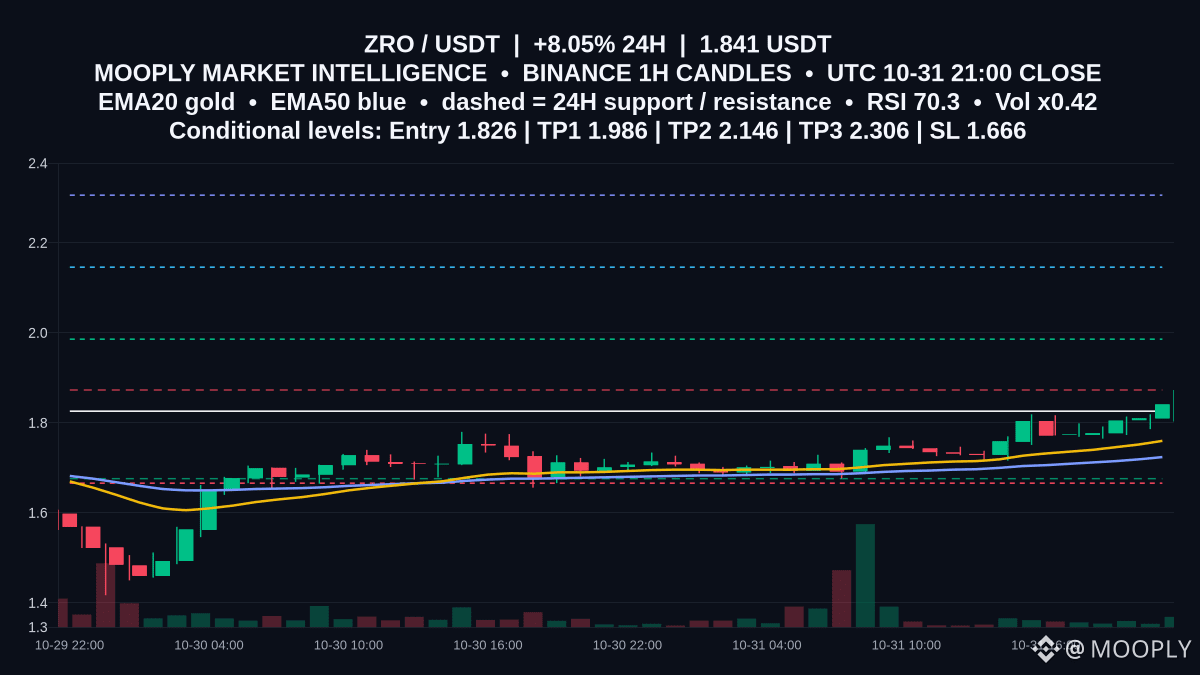
Fresh momentum leaves $ZRO pressing just below a defined ceiling.
Price sits at 1.841 (+8.05% 24H). EMA20 (1.76) is above EMA50 (1.724) and MACD > signal, but 1.873 resistance is the key pivot—reclaiming it would reinforce the uptrend, while 1.676 marks nearby support as RSI 70.3 signals a heated test.
📍 Potential entry: 1.826
🎯 Target 1: 1.986
🎯 Target 2: 2.146
🛑 Stop / invalidation: 1.666
A pullback that reacts from 1.826 while holding above 1.676 keeps the setup intact; a 1h close above 1.873 would be the cleaner confirmation. Invalidation if price closes below 1.666 or loses 1.676 with follow‑through.
Which scenario appeals to you here: breakout through 1.873 or a dip toward 1.826?
Not financial advice.
#ZRO #MarketContext #UpsideScenario
Fresh momentum leaves $ZRO pressing just below a defined ceiling.
Price sits at 1.841 (+8.05% 24H). EMA20 (1.76) is above EMA50 (1.724) and MACD > signal, but 1.873 resistance is the key pivot—reclaiming it would reinforce the uptrend, while 1.676 marks nearby support as RSI 70.3 signals a heated test.
📍 Potential entry: 1.826
🎯 Target 1: 1.986
🎯 Target 2: 2.146
🛑 Stop / invalidation: 1.666
A pullback that reacts from 1.826 while holding above 1.676 keeps the setup intact; a 1h close above 1.873 would be the cleaner confirmation. Invalidation if price closes below 1.666 or loses 1.676 with follow‑through.
Which scenario appeals to you here: breakout through 1.873 or a dip toward 1.826?
Not financial advice.
#ZRO #MarketContext #UpsideScenario
Price sits at 1.841 (+8.05% 24H). EMA20 (1.76) is above EMA50 (1.724) and MACD > signal, but 1.873 resistance is the key pivot—reclaiming it would reinforce the uptrend, while 1.676 marks nearby support as RSI 70.3 signals a heated test.
📍 Potential entry: 1.826
🎯 Target 1: 1.986
🎯 Target 2: 2.146
🛑 Stop / invalidation: 1.666
A pullback that reacts from 1.826 while holding above 1.676 keeps the setup intact; a 1h close above 1.873 would be the cleaner confirmation. Invalidation if price closes below 1.666 or loses 1.676 with follow‑through.
Which scenario appeals to you here: breakout through 1.873 or a dip toward 1.826?
Not financial advice.
#ZRO #MarketContext #UpsideScenario
5
·
--
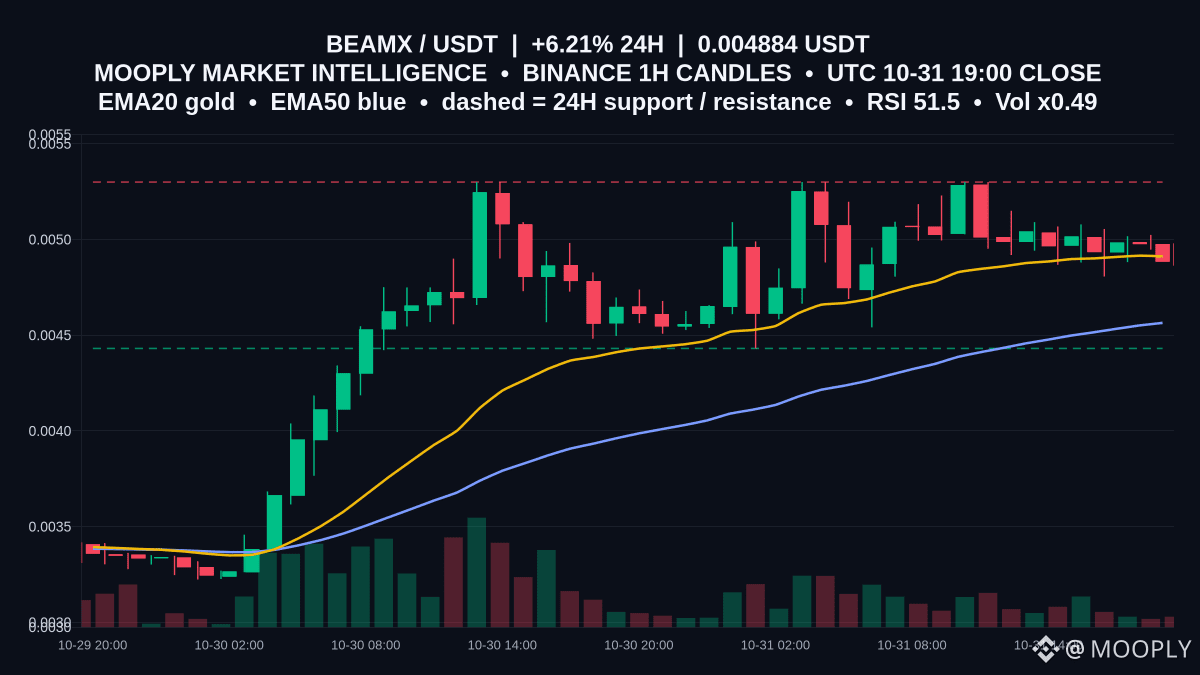
$BEAMX is pausing at 0.004884 after a +6.208% day, boxed between nearby moving averages.
Price sits just under EMA20 0.0049125 while holding above EMA50 0.0045645—this squeeze often decides the next push. With RSI 51.51 and MACD below its signal, momentum is muted and participation is light (vol x0.49).
Range setup: support at 0.004431 and resistance at 0.0053. The range holds while 0.004431 attracts bids and 0.0053 caps bounces. A firm 1h close above 0.0053 would confirm expansion; a close below 0.004431 would tilt bias lower.
Are you watching a reclaim of 0.0049125 first, or a liquidity sweep toward 0.004431?
Not financial advice.
#BEAMX #MarketContext #RangeWatch
$BEAMX is pausing at 0.004884 after a +6.208% day, boxed between nearby moving averages.
Price sits just under EMA20 0.0049125 while holding above EMA50 0.0045645—this squeeze often decides the next push. With RSI 51.51 and MACD below its signal, momentum is muted and participation is light (vol x0.49).
Range setup: support at 0.004431 and resistance at 0.0053. The range holds while 0.004431 attracts bids and 0.0053 caps bounces. A firm 1h close above 0.0053 would confirm expansion; a close below 0.004431 would tilt bias lower.
Are you watching a reclaim of 0.0049125 first, or a liquidity sweep toward 0.004431?
Not financial advice.
#BEAMX #MarketContext #RangeWatch
Price sits just under EMA20 0.0049125 while holding above EMA50 0.0045645—this squeeze often decides the next push. With RSI 51.51 and MACD below its signal, momentum is muted and participation is light (vol x0.49).
Range setup: support at 0.004431 and resistance at 0.0053. The range holds while 0.004431 attracts bids and 0.0053 caps bounces. A firm 1h close above 0.0053 would confirm expansion; a close below 0.004431 would tilt bias lower.
Are you watching a reclaim of 0.0049125 first, or a liquidity sweep toward 0.004431?
Not financial advice.
#BEAMX #MarketContext #RangeWatch
5
·
--
SAFU's Moment: What an Exchange Emergency Fund Really Means
A major exchange says it used its emergency reserve (the SAFU pool) alongside treasury assets and insurance to cover a large hot‑wallet breach, reporting rapid replenishment of most affected tokens. What that implies:
- Purpose proven: SAFU exists to protect users in extreme losses; its deployment can blunt immediate contagion and restore withdrawals faster.
- Operational limits: Relying on corporate funds and insurance concentrates risk on counterparties and balance‑sheet strength — not a replacement for decentralised custody or stronger offline security.
- Market signal: Quick coverage can stabilise prices and confidence, but transparency on asset sourcing, frozen funds, and recovery status is essential.
Counterpoint: Rapid fund deployment may reassure users short term, yet it can mask structural security weaknesses that need fixing.
Takeaway: SAFU is useful crisis tooling, not a cure for custody risk. #SAFU #ExchangeSecurity #CryptoCustody #CryptoRisk
SAFU's Moment: What an Exchange Emergency Fund Really Means
A major exchange says it used its emergency reserve (the SAFU pool) alongside treasury assets and insurance to cover a large hot‑wallet breach, reporting rapid replenishment of most affected tokens. What that implies:
- Purpose proven: SAFU exists to protect users in extreme losses; its deployment can blunt immediate contagion and restore withdrawals faster.
- Operational limits: Relying on corporate funds and insurance concentrates risk on counterparties and balance‑sheet strength — not a replacement for decentralised custody or stronger offline security.
- Market signal: Quick coverage can stabilise prices and confidence, but transparency on asset sourcing, frozen funds, and recovery status is essential.
Counterpoint: Rapid fund deployment may reassure users short term, yet it can mask structural security weaknesses that need fixing.
Takeaway: SAFU is useful crisis tooling, not a cure for custody risk. #SAFU #ExchangeSecurity #CryptoCustody #CryptoRisk
A major exchange says it used its emergency reserve (the SAFU pool) alongside treasury assets and insurance to cover a large hot‑wallet breach, reporting rapid replenishment of most affected tokens. What that implies:
- Purpose proven: SAFU exists to protect users in extreme losses; its deployment can blunt immediate contagion and restore withdrawals faster.
- Operational limits: Relying on corporate funds and insurance concentrates risk on counterparties and balance‑sheet strength — not a replacement for decentralised custody or stronger offline security.
- Market signal: Quick coverage can stabilise prices and confidence, but transparency on asset sourcing, frozen funds, and recovery status is essential.
Counterpoint: Rapid fund deployment may reassure users short term, yet it can mask structural security weaknesses that need fixing.
Takeaway: SAFU is useful crisis tooling, not a cure for custody risk. #SAFU #ExchangeSecurity #CryptoCustody #CryptoRisk

·
--
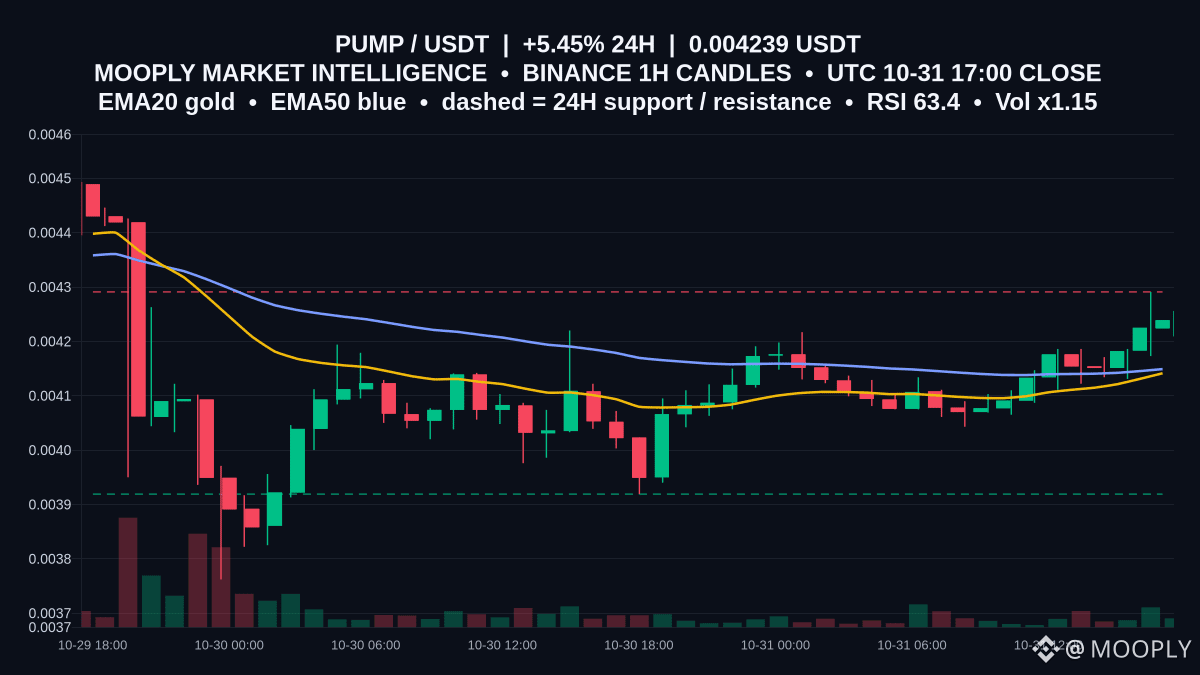
Pressing the top of its recent band, $PUMP is up 5.45% on the day.
Price sits at 0.004239, above EMA20 0.0041413 and EMA50 0.004149, with RSI 63.4 and a positive MACD over its signal—constructive but not stretched. The key level is 0.004291 resistance, which capped prior advances; it frames the range with 0.003919 as support.
In this RANGE setup, sellers have leaned on 0.004291 while buyers stepped in above 0.003919. The EMA cluster at 0.0041413–0.004149 is a useful intraband pivot; holding above it favors repeated retests of the ceiling.
A 1h close and acceptance above 0.004291 would confirm a break; rejection there or a loss of 0.003919 keeps the range intact. With volume slightly elevated (1.15x), follow-through is key.
Are you watching for a clean hourly close over 0.004291, or a rotation back toward the EMA zone first?
Not financial advice.
#PUMP #MarketContext #RangeWatch
Pressing the top of its recent band, $PUMP is up 5.45% on the day.
Price sits at 0.004239, above EMA20 0.0041413 and EMA50 0.004149, with RSI 63.4 and a positive MACD over its signal—constructive but not stretched. The key level is 0.004291 resistance, which capped prior advances; it frames the range with 0.003919 as support.
In this RANGE setup, sellers have leaned on 0.004291 while buyers stepped in above 0.003919. The EMA cluster at 0.0041413–0.004149 is a useful intraband pivot; holding above it favors repeated retests of the ceiling.
A 1h close and acceptance above 0.004291 would confirm a break; rejection there or a loss of 0.003919 keeps the range intact. With volume slightly elevated (1.15x), follow-through is key.
Are you watching for a clean hourly close over 0.004291, or a rotation back toward the EMA zone first?
Not financial advice.
#PUMP #MarketContext #RangeWatch
Price sits at 0.004239, above EMA20 0.0041413 and EMA50 0.004149, with RSI 63.4 and a positive MACD over its signal—constructive but not stretched. The key level is 0.004291 resistance, which capped prior advances; it frames the range with 0.003919 as support.
In this RANGE setup, sellers have leaned on 0.004291 while buyers stepped in above 0.003919. The EMA cluster at 0.0041413–0.004149 is a useful intraband pivot; holding above it favors repeated retests of the ceiling.
A 1h close and acceptance above 0.004291 would confirm a break; rejection there or a loss of 0.003919 keeps the range intact. With volume slightly elevated (1.15x), follow-through is key.
Are you watching for a clean hourly close over 0.004291, or a rotation back toward the EMA zone first?
Not financial advice.
#PUMP #MarketContext #RangeWatch
8
·
--
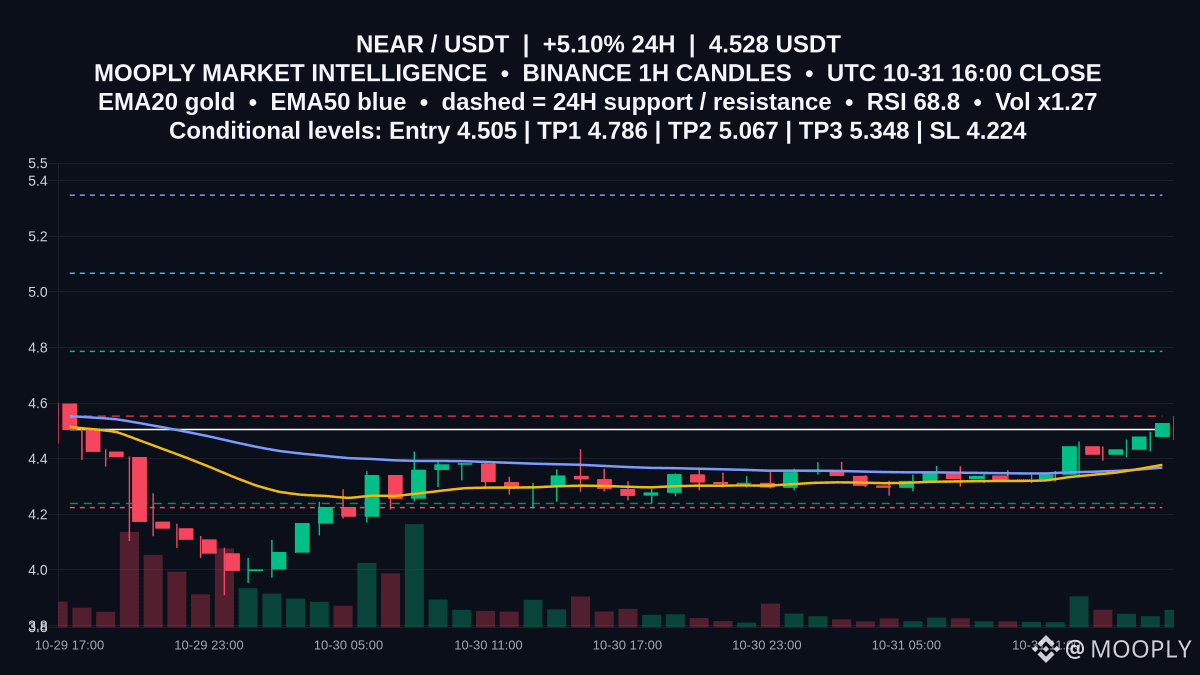
Buyers just nudged $NEAR to 4.528, approaching the nearby 4.553 ceiling.
On the 1h view, EMA20 at 4.378 sits above EMA50 at 4.368 while RSI prints 68.82—momentum is positive into resistance at 4.553. The key daily support below is 4.239, defining the risk window.
📍 Potential entry: 4.505
🎯 Target 1: 4.786
🎯 Target 2: 5.067
🛑 Stop / invalidation: 4.224
A pullback that holds near 4.505 and then a firm 1h close above 4.553 would confirm follow‑through toward 4.786 and 5.067. Losing 4.368 (EMA50) and especially the 4.239 support would weaken the setup, with the scenario invalidated at 4.224.
Would you like an update if the next hourly candle closes above 4.553?
Not financial advice.
#NEAR #MarketContext #UpsideScenario
Buyers just nudged $NEAR to 4.528, approaching the nearby 4.553 ceiling.
On the 1h view, EMA20 at 4.378 sits above EMA50 at 4.368 while RSI prints 68.82—momentum is positive into resistance at 4.553. The key daily support below is 4.239, defining the risk window.
📍 Potential entry: 4.505
🎯 Target 1: 4.786
🎯 Target 2: 5.067
🛑 Stop / invalidation: 4.224
A pullback that holds near 4.505 and then a firm 1h close above 4.553 would confirm follow‑through toward 4.786 and 5.067. Losing 4.368 (EMA50) and especially the 4.239 support would weaken the setup, with the scenario invalidated at 4.224.
Would you like an update if the next hourly candle closes above 4.553?
Not financial advice.
#NEAR #MarketContext #UpsideScenario
On the 1h view, EMA20 at 4.378 sits above EMA50 at 4.368 while RSI prints 68.82—momentum is positive into resistance at 4.553. The key daily support below is 4.239, defining the risk window.
📍 Potential entry: 4.505
🎯 Target 1: 4.786
🎯 Target 2: 5.067
🛑 Stop / invalidation: 4.224
A pullback that holds near 4.505 and then a firm 1h close above 4.553 would confirm follow‑through toward 4.786 and 5.067. Losing 4.368 (EMA50) and especially the 4.239 support would weaken the setup, with the scenario invalidated at 4.224.
Would you like an update if the next hourly candle closes above 4.553?
Not financial advice.
#NEAR #MarketContext #UpsideScenario
4
·
--
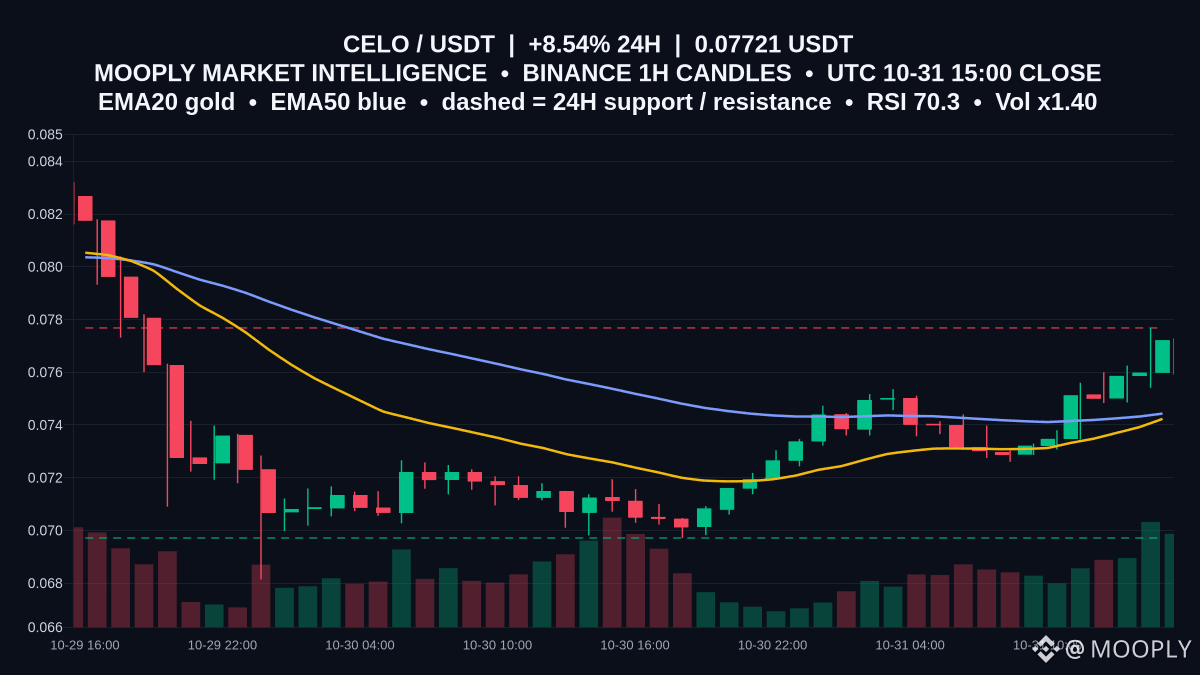
Bid pressure returns to $CELO with a 24h gain of 8.544% and price at 0.07721, sitting just beneath defined resistance at 0.07768.
Why it matters: RSI is elevated at 70.35 while price trades above EMA20 0.07423 and EMA50 0.07443, making that moving-average band the immediate test if momentum cools.
Range view: resistance 0.07768, support 0.06971. ATR14 at 0.00121 implies typical 1h swings can reject moves near the top. A firm 1h close above 0.07768 would signal range expansion; failure keeps rotation toward 0.07423–0.07443 and, if that fails, 0.06971. MACD stays positive (0.00076563 vs 0.00034641).
Will you watch for an hourly close over 0.07768, or a fade toward the 0.07423–0.07443 zone?
Not financial advice.
#CELO #MarketContext #RangeWatch
Bid pressure returns to $CELO with a 24h gain of 8.544% and price at 0.07721, sitting just beneath defined resistance at 0.07768.
Why it matters: RSI is elevated at 70.35 while price trades above EMA20 0.07423 and EMA50 0.07443, making that moving-average band the immediate test if momentum cools.
Range view: resistance 0.07768, support 0.06971. ATR14 at 0.00121 implies typical 1h swings can reject moves near the top. A firm 1h close above 0.07768 would signal range expansion; failure keeps rotation toward 0.07423–0.07443 and, if that fails, 0.06971. MACD stays positive (0.00076563 vs 0.00034641).
Will you watch for an hourly close over 0.07768, or a fade toward the 0.07423–0.07443 zone?
Not financial advice.
#CELO #MarketContext #RangeWatch
Why it matters: RSI is elevated at 70.35 while price trades above EMA20 0.07423 and EMA50 0.07443, making that moving-average band the immediate test if momentum cools.
Range view: resistance 0.07768, support 0.06971. ATR14 at 0.00121 implies typical 1h swings can reject moves near the top. A firm 1h close above 0.07768 would signal range expansion; failure keeps rotation toward 0.07423–0.07443 and, if that fails, 0.06971. MACD stays positive (0.00076563 vs 0.00034641).
Will you watch for an hourly close over 0.07768, or a fade toward the 0.07423–0.07443 zone?
Not financial advice.
#CELO #MarketContext #RangeWatch
·
--
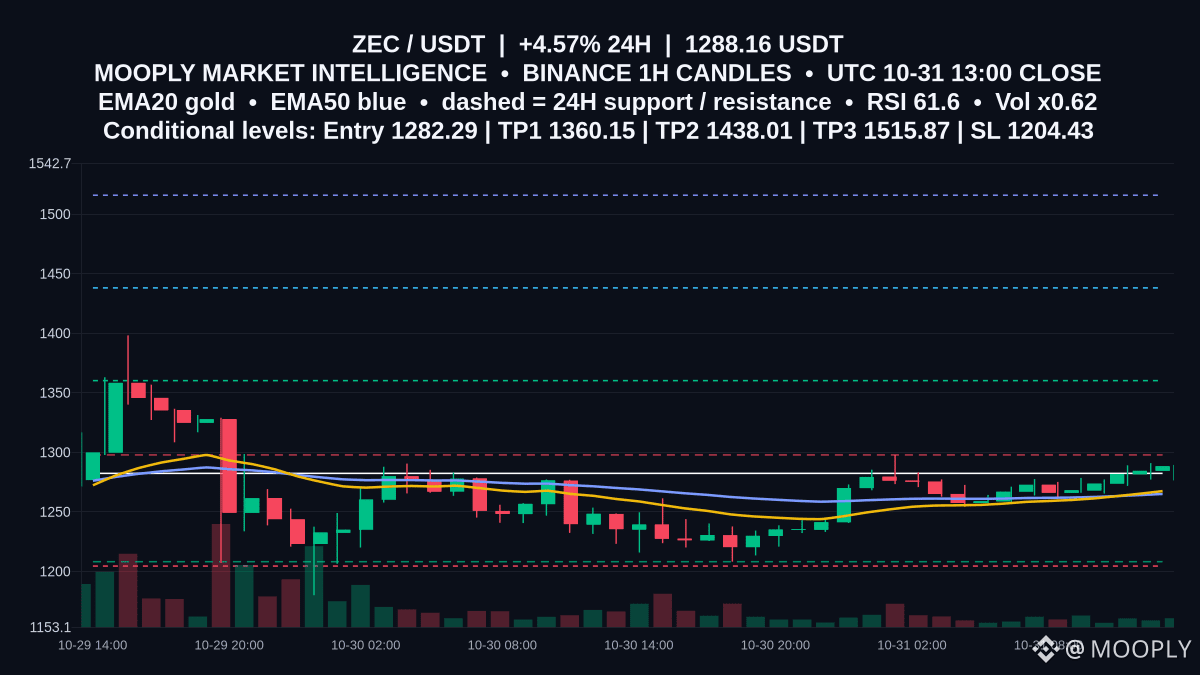
$ZEC is pressing toward nearby 1h resistance at 1297.77 after a +4.57% day.
Why this matters: EMA20 (1267.39) now sits above EMA50 (1264.98) and RSI at 61.61 suggests constructive momentum, but 1297.77 remains the lid. A clean break could unlock the mapped upside levels.
📍 Potential entry: 1282.29
🎯 Target 1: 1360.15
🎯 Target 2: 1438.01
🛑 Stop / invalidation: 1204.43
Confirmation would be a 1h close and hold above 1297.77; failure there keeps price capped inside 1208.1–1297.77. The scenario is invalidated on a loss of 1208.1 or if 1204.43 prints. Are you watching for a reclaim and retest of 1297.77 before momentum extends?
Not financial advice.
#ZEC #MarketContext #UpsideScenario
$ZEC is pressing toward nearby 1h resistance at 1297.77 after a +4.57% day.
Why this matters: EMA20 (1267.39) now sits above EMA50 (1264.98) and RSI at 61.61 suggests constructive momentum, but 1297.77 remains the lid. A clean break could unlock the mapped upside levels.
📍 Potential entry: 1282.29
🎯 Target 1: 1360.15
🎯 Target 2: 1438.01
🛑 Stop / invalidation: 1204.43
Confirmation would be a 1h close and hold above 1297.77; failure there keeps price capped inside 1208.1–1297.77. The scenario is invalidated on a loss of 1208.1 or if 1204.43 prints. Are you watching for a reclaim and retest of 1297.77 before momentum extends?
Not financial advice.
#ZEC #MarketContext #UpsideScenario
Why this matters: EMA20 (1267.39) now sits above EMA50 (1264.98) and RSI at 61.61 suggests constructive momentum, but 1297.77 remains the lid. A clean break could unlock the mapped upside levels.
📍 Potential entry: 1282.29
🎯 Target 1: 1360.15
🎯 Target 2: 1438.01
🛑 Stop / invalidation: 1204.43
Confirmation would be a 1h close and hold above 1297.77; failure there keeps price capped inside 1208.1–1297.77. The scenario is invalidated on a loss of 1208.1 or if 1204.43 prints. Are you watching for a reclaim and retest of 1297.77 before momentum extends?
Not financial advice.
#ZEC #MarketContext #UpsideScenario
6
·
--
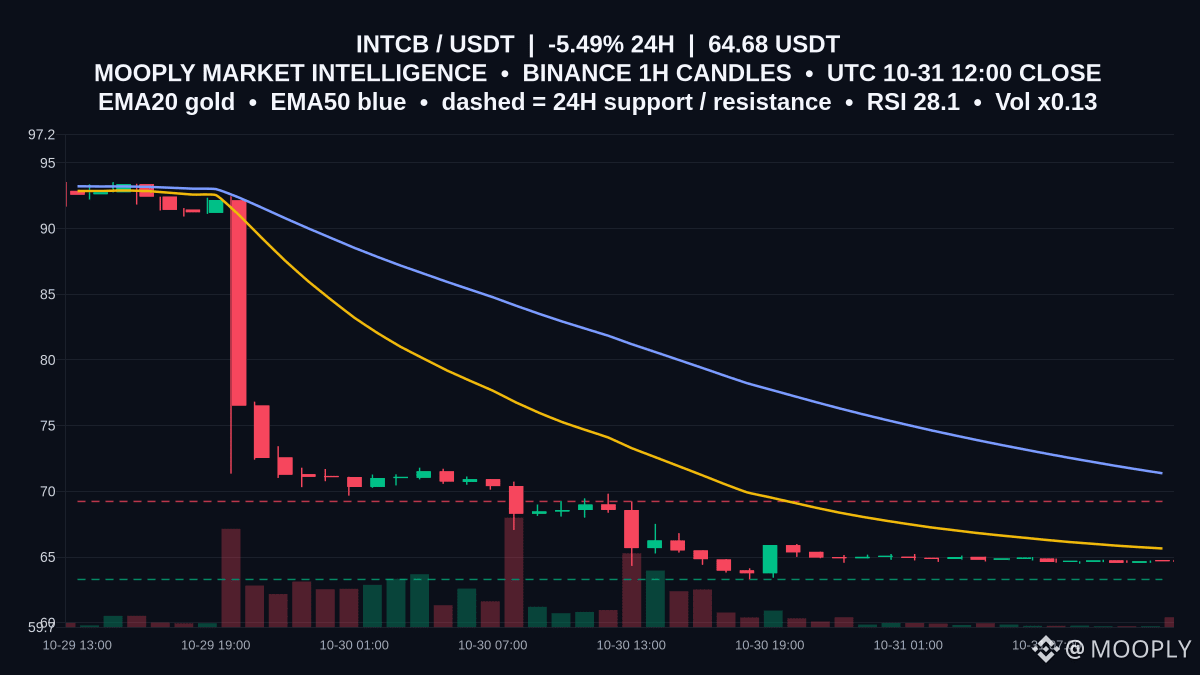
$INTCB trades at 64.68 as momentum cools; RSI is 28.07 and MACD sits beneath its signal, reflecting ongoing pressure after recent weakness.
Why it matters: price is below a falling EMA20 (65.65) and well under EMA50 (71.372), so rebounds into these averages risk fading. The tape is defined by a nearby range and lighter turnover (Vol x0.13).
Range view: 63.29 is the key support and 69.23 the ceiling. Holding above 63.29 keeps mean‑reversion attempts toward 65.65 and 69.23 in play; repeated rejection at 69.23 preserves seller control. An hourly close above 69.23 opens room toward 71.372, while a close below 63.29 exposes fresh lows.
Are you watching 63.29 for confirmation, or waiting for an hourly close back above 69.23?
Not financial advice.
#INTCB #MarketContext #RangeWatch
$INTCB trades at 64.68 as momentum cools; RSI is 28.07 and MACD sits beneath its signal, reflecting ongoing pressure after recent weakness.
Why it matters: price is below a falling EMA20 (65.65) and well under EMA50 (71.372), so rebounds into these averages risk fading. The tape is defined by a nearby range and lighter turnover (Vol x0.13).
Range view: 63.29 is the key support and 69.23 the ceiling. Holding above 63.29 keeps mean‑reversion attempts toward 65.65 and 69.23 in play; repeated rejection at 69.23 preserves seller control. An hourly close above 69.23 opens room toward 71.372, while a close below 63.29 exposes fresh lows.
Are you watching 63.29 for confirmation, or waiting for an hourly close back above 69.23?
Not financial advice.
#INTCB #MarketContext #RangeWatch
Why it matters: price is below a falling EMA20 (65.65) and well under EMA50 (71.372), so rebounds into these averages risk fading. The tape is defined by a nearby range and lighter turnover (Vol x0.13).
Range view: 63.29 is the key support and 69.23 the ceiling. Holding above 63.29 keeps mean‑reversion attempts toward 65.65 and 69.23 in play; repeated rejection at 69.23 preserves seller control. An hourly close above 69.23 opens room toward 71.372, while a close below 63.29 exposes fresh lows.
Are you watching 63.29 for confirmation, or waiting for an hourly close back above 69.23?
Not financial advice.
#INTCB #MarketContext #RangeWatch
1
·
--

Article
Futures leverage and liquidation risk: how margin amplifies gains and losses—and how to protect yourselfIntroduction
Leverage in futures trading lets you control a larger position than your available capital would normally allow. That power can magnify gains—but it equally magnifies losses and introduces the concrete possibility of liquidation, where an exchange closes your position to prevent further losses. This article explains how leverage and liquidation work, shows concrete hypothetical examples, and offers practical steps to manage the risks.
How leverage works in futures
Leverage is simply the ratio between the notional size of a position and the collateral you post. If you open a 10x leveraged position, a movement of 1% in the underlying asset produces roughly a 10% change in your equity (ignoring fees and funding). Futures platforms require an initial margin to open a position and a maintenance margin to keep it open. If your equity falls below the maintenance margin, the platform may liquidate your position automatically.
Key concepts to understand:
- Notional: the full size of the position (price × quantity).
- Initial margin: the collateral required to open the position.
- Maintenance margin: the minimum equity required to avoid liquidation.
- Mark price: an exchange-calculated price used to determine unrealized P&L and trigger liquidations (designed to reduce manipulative squeezes).
- Isolated vs cross margin: isolated limits losses to the margin allocated to that position; cross margin shares equity across positions, risking a larger portion of your account in volatile moves.
Liquidation mechanics and maintenance margin
Liquidation occurs when your position’s losses consume too much margin and your equity hits the maintenance threshold. Exchanges use several mechanisms to resolve underfunded positions:
- Margin call / margin ratio: some platforms alert you before liquidation, others proceed directly.
- Partial liquidation: some exchanges reduce the position size to restore margin requirements.
- Full liquidation: the entire position is closed at market.
- Insurance fund and auto-deleveraging (ADL): if liquidation at market does not fully cover losses, the exchange may use an insurance fund or redistribute the remaining loss to counterparties via ADL.
Hypothetical example 1 — leverage amplifies small moves
Assume you have 1000 of capital and take a 10x long position with notional value 10000. If the underlying price rises 2%, the position value increases by 200, and your account equity would roughly go from 1000 to 1200 (a 20% gain). Conversely, a 2% price drop reduces the position by 200, bringing equity to 800 (a 20% loss). A 10% adverse move would wipe out the initial 1000 and risk liquidation before reaching that full number once fees and maintenance margin are considered.
Hypothetical example 2 — maintenance margin and liquidation
Using the same initial position (1000 initial margin, 10x leverage), suppose the maintenance margin is 0.5% of notional (50). If losses bring your equity down to that 50, the platform may liquidate. That could occur with an adverse price move much smaller than 100%—in this example, a roughly 9.5% move against you would consume most of your equity and threaten liquidation. Numbers will vary by exchange; the example shows how leverage compresses the gap between small percentage moves and catastrophic outcomes.
Hypothetical example 3 — cross vs isolated margin
You have two positions: Position A (margin 500) and Position B (margin 500). In isolated mode, if Position A drops below maintenance margin, only Position A is at risk of liquidation, protecting Position B and the rest of the account. In cross margin, if Position A suffers a large loss, it can draw on the other 500 and potentially put both positions at risk. Cross margin is useful for maximizing capital efficiency but increases systemic exposure.
Common leverage-related risks
- Rapid volatility: sudden price spikes or gaps can trigger liquidation before risk mitigations (like stop orders) execute.
- Slippage and fees: liquidations happen at market, and real execution prices include slippage and taker fees, which deepen losses.
- Funding rate burden: perpetual futures often charge or pay a funding rate at intervals; high funding can erode profits or increase losses.
- Concentration risk: using high leverage on a single position makes your portfolio highly sensitive to that one market.
- Platform rules: differing maintenance margins, liquidation algorithms, and protections mean the same strategy behaves differently across venues.
Practical risk-management techniques
- Size positions by risk, not by capital: decide the percentage of your account you can afford to lose on a trade and set leverage so the worst reasonable move won’t instantly liquidate you.
- Use lower leverage: the smaller the leverage, the larger the price move required to cause a liquidation.
- Prefer isolated margin for speculative positions: it limits the fraction of your account exposed to a single trade.
- Set stop-loss orders, but recognize they can fail in extreme volatility or during fast market moves.
- Monitor funding rates for perpetual contracts so they don’t unexpectedly drain returns.
- Keep extra margin in your account to absorb temporary adverse moves or to avoid cascading liquidations in cross margin.
- Understand the exchange’s liquidation process, insurance fund status, and whether ADL is used.
Practical checklist
- Know your position notional, initial margin, and maintenance margin before opening a trade.
- Calculate the price move that would reduce your equity to the maintenance threshold.
- Choose isolated margin for high-risk trades; use cross margin only with a mature risk plan.
- Limit leverage based on personal risk tolerance—common conservative ranges are significantly below maximum allowed.
- Use stop-losses and predefine acceptable loss per trade as a percentage of account equity.
- Monitor funding rates and schedule margin deposits if funding obligations look adverse.
- Keep a buffer of unallocated collateral to reduce the chance of forced liquidation.
Three key takeaways
- Leverage magnifies both gains and losses: small price moves can produce large equity swings.
- Liquidation is an automatic, often costly process triggered when maintenance margin is breached.
- Risk control (position sizing, lower leverage, isolated margin, and margin buffers) is essential to prevent catastrophic account losses.
Conclusion
Futures leverage is a powerful tool that can increase capital efficiency, but it brings real, quantifiable liquidation risk. The math behind margin requirements makes it clear that higher leverage shortens the distance between normal market noise and account destruction. Educated traders treat leverage as an adjustable risk dial, not a shortcut to outsized returns—choosing leverage consistent with account size, volatility, and mental tolerance. Learn the exchange rules you trade on, run hypothetical scenarios before risking capital, and use conservative sizing and margin buffers to reduce the odds of liquidation.
What single change would you make to your risk-management routine the next time you trade a leveraged futures position?
Educational only — not financial advice.
Chart: BTC/USDT is a real-data educational case study, not a claim that the article is about BTC.
$BTC #CryptoEducation #MarketEducation #BTC
Futures leverage and liquidation risk: how margin amplifies gains and losses—and how to protect yourself
Introduction
Leverage in futures trading lets you control a larger position than your available capital would normally allow. That power can magnify gains—but it equally magnifies losses and introduces the concrete possibility of liquidation, where an exchange closes your position to prevent further losses. This article explains how leverage and liquidation work, shows concrete hypothetical examples, and offers practical steps to manage the risks.
How leverage works in futures
Leverage is simply the ratio between the notional size of a position and the collateral you post. If you open a 10x leveraged position, a movement of 1% in the underlying asset produces roughly a 10% change in your equity (ignoring fees and funding). Futures platforms require an initial margin to open a position and a maintenance margin to keep it open. If your equity falls below the maintenance margin, the platform may liquidate your position automatically.
Key concepts to understand:
- Notional: the full size of the position (price × quantity).
- Initial margin: the collateral required to open the position.
- Maintenance margin: the minimum equity required to avoid liquidation.
- Mark price: an exchange-calculated price used to determine unrealized P&L and trigger liquidations (designed to reduce manipulative squeezes).
- Isolated vs cross margin: isolated limits losses to the margin allocated to that position; cross margin shares equity across positions, risking a larger portion of your account in volatile moves.
Liquidation mechanics and maintenance margin
Liquidation occurs when your position’s losses consume too much margin and your equity hits the maintenance threshold. Exchanges use several mechanisms to resolve underfunded positions:
- Margin call / margin ratio: some platforms alert you before liquidation, others proceed directly.
- Partial liquidation: some exchanges reduce the position size to restore margin requirements.
- Full liquidation: the entire position is closed at market.
- Insurance fund and auto-deleveraging (ADL): if liquidation at market does not fully cover losses, the exchange may use an insurance fund or redistribute the remaining loss to counterparties via ADL.
Hypothetical example 1 — leverage amplifies small moves
Assume you have 1000 of capital and take a 10x long position with notional value 10000. If the underlying price rises 2%, the position value increases by 200, and your account equity would roughly go from 1000 to 1200 (a 20% gain). Conversely, a 2% price drop reduces the position by 200, bringing equity to 800 (a 20% loss). A 10% adverse move would wipe out the initial 1000 and risk liquidation before reaching that full number once fees and maintenance margin are considered.
Hypothetical example 2 — maintenance margin and liquidation
Using the same initial position (1000 initial margin, 10x leverage), suppose the maintenance margin is 0.5% of notional (50). If losses bring your equity down to that 50, the platform may liquidate. That could occur with an adverse price move much smaller than 100%—in this example, a roughly 9.5% move against you would consume most of your equity and threaten liquidation. Numbers will vary by exchange; the example shows how leverage compresses the gap between small percentage moves and catastrophic outcomes.
Hypothetical example 3 — cross vs isolated margin
You have two positions: Position A (margin 500) and Position B (margin 500). In isolated mode, if Position A drops below maintenance margin, only Position A is at risk of liquidation, protecting Position B and the rest of the account. In cross margin, if Position A suffers a large loss, it can draw on the other 500 and potentially put both positions at risk. Cross margin is useful for maximizing capital efficiency but increases systemic exposure.
Common leverage-related risks
- Rapid volatility: sudden price spikes or gaps can trigger liquidation before risk mitigations (like stop orders) execute.
- Slippage and fees: liquidations happen at market, and real execution prices include slippage and taker fees, which deepen losses.
- Funding rate burden: perpetual futures often charge or pay a funding rate at intervals; high funding can erode profits or increase losses.
- Concentration risk: using high leverage on a single position makes your portfolio highly sensitive to that one market.
- Platform rules: differing maintenance margins, liquidation algorithms, and protections mean the same strategy behaves differently across venues.
Practical risk-management techniques
- Size positions by risk, not by capital: decide the percentage of your account you can afford to lose on a trade and set leverage so the worst reasonable move won’t instantly liquidate you.
- Use lower leverage: the smaller the leverage, the larger the price move required to cause a liquidation.
- Prefer isolated margin for speculative positions: it limits the fraction of your account exposed to a single trade.
- Set stop-loss orders, but recognize they can fail in extreme volatility or during fast market moves.
- Monitor funding rates for perpetual contracts so they don’t unexpectedly drain returns.
- Keep extra margin in your account to absorb temporary adverse moves or to avoid cascading liquidations in cross margin.
- Understand the exchange’s liquidation process, insurance fund status, and whether ADL is used.
Practical checklist
- Know your position notional, initial margin, and maintenance margin before opening a trade.
- Calculate the price move that would reduce your equity to the maintenance threshold.
- Choose isolated margin for high-risk trades; use cross margin only with a mature risk plan.
- Limit leverage based on personal risk tolerance—common conservative ranges are significantly below maximum allowed.
- Use stop-losses and predefine acceptable loss per trade as a percentage of account equity.
- Monitor funding rates and schedule margin deposits if funding obligations look adverse.
- Keep a buffer of unallocated collateral to reduce the chance of forced liquidation.
Three key takeaways
- Leverage magnifies both gains and losses: small price moves can produce large equity swings.
- Liquidation is an automatic, often costly process triggered when maintenance margin is breached.
- Risk control (position sizing, lower leverage, isolated margin, and margin buffers) is essential to prevent catastrophic account losses.
Conclusion
Futures leverage is a powerful tool that can increase capital efficiency, but it brings real, quantifiable liquidation risk. The math behind margin requirements makes it clear that higher leverage shortens the distance between normal market noise and account destruction. Educated traders treat leverage as an adjustable risk dial, not a shortcut to outsized returns—choosing leverage consistent with account size, volatility, and mental tolerance. Learn the exchange rules you trade on, run hypothetical scenarios before risking capital, and use conservative sizing and margin buffers to reduce the odds of liquidation.
What single change would you make to your risk-management routine the next time you trade a leveraged futures position?
Educational only — not financial advice.
Chart: BTC/USDT is a real-data educational case study, not a claim that the article is about BTC.
$BTC #CryptoEducation #MarketEducation #BTC
Leverage in futures trading lets you control a larger position than your available capital would normally allow. That power can magnify gains—but it equally magnifies losses and introduces the concrete possibility of liquidation, where an exchange closes your position to prevent further losses. This article explains how leverage and liquidation work, shows concrete hypothetical examples, and offers practical steps to manage the risks.
How leverage works in futures
Leverage is simply the ratio between the notional size of a position and the collateral you post. If you open a 10x leveraged position, a movement of 1% in the underlying asset produces roughly a 10% change in your equity (ignoring fees and funding). Futures platforms require an initial margin to open a position and a maintenance margin to keep it open. If your equity falls below the maintenance margin, the platform may liquidate your position automatically.
Key concepts to understand:
- Notional: the full size of the position (price × quantity).
- Initial margin: the collateral required to open the position.
- Maintenance margin: the minimum equity required to avoid liquidation.
- Mark price: an exchange-calculated price used to determine unrealized P&L and trigger liquidations (designed to reduce manipulative squeezes).
- Isolated vs cross margin: isolated limits losses to the margin allocated to that position; cross margin shares equity across positions, risking a larger portion of your account in volatile moves.
Liquidation mechanics and maintenance margin
Liquidation occurs when your position’s losses consume too much margin and your equity hits the maintenance threshold. Exchanges use several mechanisms to resolve underfunded positions:
- Margin call / margin ratio: some platforms alert you before liquidation, others proceed directly.
- Partial liquidation: some exchanges reduce the position size to restore margin requirements.
- Full liquidation: the entire position is closed at market.
- Insurance fund and auto-deleveraging (ADL): if liquidation at market does not fully cover losses, the exchange may use an insurance fund or redistribute the remaining loss to counterparties via ADL.
Hypothetical example 1 — leverage amplifies small moves
Assume you have 1000 of capital and take a 10x long position with notional value 10000. If the underlying price rises 2%, the position value increases by 200, and your account equity would roughly go from 1000 to 1200 (a 20% gain). Conversely, a 2% price drop reduces the position by 200, bringing equity to 800 (a 20% loss). A 10% adverse move would wipe out the initial 1000 and risk liquidation before reaching that full number once fees and maintenance margin are considered.
Hypothetical example 2 — maintenance margin and liquidation
Using the same initial position (1000 initial margin, 10x leverage), suppose the maintenance margin is 0.5% of notional (50). If losses bring your equity down to that 50, the platform may liquidate. That could occur with an adverse price move much smaller than 100%—in this example, a roughly 9.5% move against you would consume most of your equity and threaten liquidation. Numbers will vary by exchange; the example shows how leverage compresses the gap between small percentage moves and catastrophic outcomes.
Hypothetical example 3 — cross vs isolated margin
You have two positions: Position A (margin 500) and Position B (margin 500). In isolated mode, if Position A drops below maintenance margin, only Position A is at risk of liquidation, protecting Position B and the rest of the account. In cross margin, if Position A suffers a large loss, it can draw on the other 500 and potentially put both positions at risk. Cross margin is useful for maximizing capital efficiency but increases systemic exposure.
Common leverage-related risks
- Rapid volatility: sudden price spikes or gaps can trigger liquidation before risk mitigations (like stop orders) execute.
- Slippage and fees: liquidations happen at market, and real execution prices include slippage and taker fees, which deepen losses.
- Funding rate burden: perpetual futures often charge or pay a funding rate at intervals; high funding can erode profits or increase losses.
- Concentration risk: using high leverage on a single position makes your portfolio highly sensitive to that one market.
- Platform rules: differing maintenance margins, liquidation algorithms, and protections mean the same strategy behaves differently across venues.
Practical risk-management techniques
- Size positions by risk, not by capital: decide the percentage of your account you can afford to lose on a trade and set leverage so the worst reasonable move won’t instantly liquidate you.
- Use lower leverage: the smaller the leverage, the larger the price move required to cause a liquidation.
- Prefer isolated margin for speculative positions: it limits the fraction of your account exposed to a single trade.
- Set stop-loss orders, but recognize they can fail in extreme volatility or during fast market moves.
- Monitor funding rates for perpetual contracts so they don’t unexpectedly drain returns.
- Keep extra margin in your account to absorb temporary adverse moves or to avoid cascading liquidations in cross margin.
- Understand the exchange’s liquidation process, insurance fund status, and whether ADL is used.
Practical checklist
- Know your position notional, initial margin, and maintenance margin before opening a trade.
- Calculate the price move that would reduce your equity to the maintenance threshold.
- Choose isolated margin for high-risk trades; use cross margin only with a mature risk plan.
- Limit leverage based on personal risk tolerance—common conservative ranges are significantly below maximum allowed.
- Use stop-losses and predefine acceptable loss per trade as a percentage of account equity.
- Monitor funding rates and schedule margin deposits if funding obligations look adverse.
- Keep a buffer of unallocated collateral to reduce the chance of forced liquidation.
Three key takeaways
- Leverage magnifies both gains and losses: small price moves can produce large equity swings.
- Liquidation is an automatic, often costly process triggered when maintenance margin is breached.
- Risk control (position sizing, lower leverage, isolated margin, and margin buffers) is essential to prevent catastrophic account losses.
Conclusion
Futures leverage is a powerful tool that can increase capital efficiency, but it brings real, quantifiable liquidation risk. The math behind margin requirements makes it clear that higher leverage shortens the distance between normal market noise and account destruction. Educated traders treat leverage as an adjustable risk dial, not a shortcut to outsized returns—choosing leverage consistent with account size, volatility, and mental tolerance. Learn the exchange rules you trade on, run hypothetical scenarios before risking capital, and use conservative sizing and margin buffers to reduce the odds of liquidation.
What single change would you make to your risk-management routine the next time you trade a leveraged futures position?
Educational only — not financial advice.
Chart: BTC/USDT is a real-data educational case study, not a claim that the article is about BTC.
$BTC #CryptoEducation #MarketEducation #BTC
3
·
--
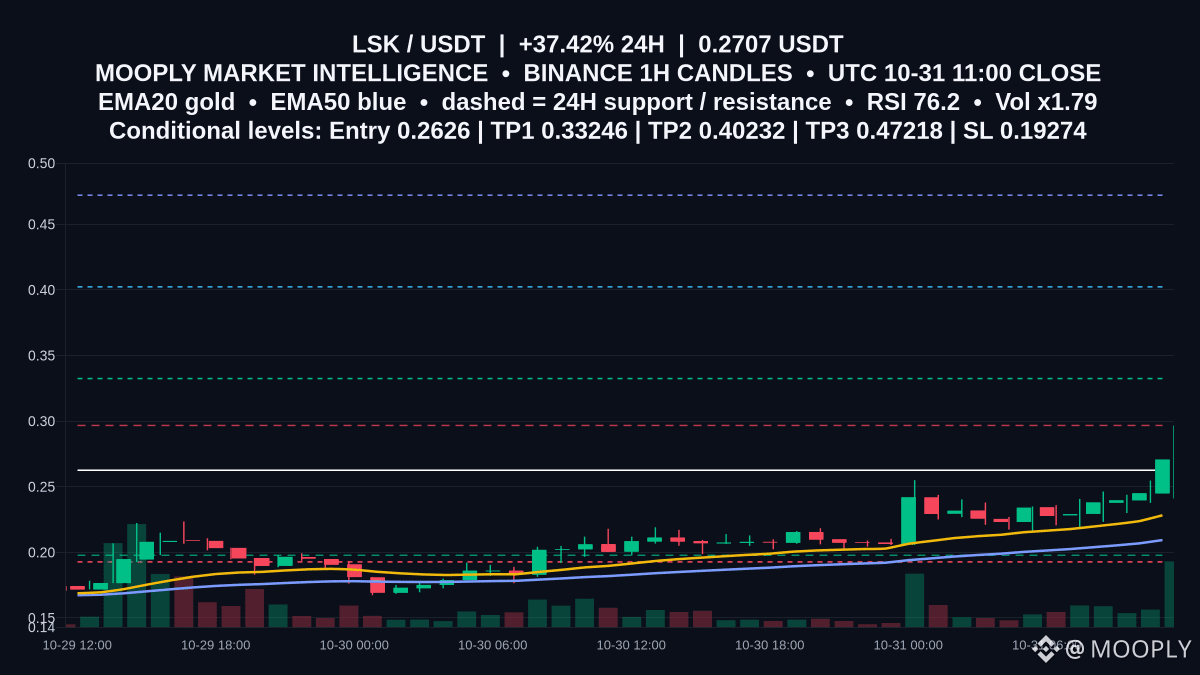
$LSK just surged +37.42% in 24h to 0.2707, with 12,971,532.50975 in volume across 271,624 trades.
EMA20 at 0.22827 above EMA50 at 0.20938 signals bullish structure, while MACD stays above its signal. But RSI 76.16 flags a stretched move as price presses toward the 0.2967 resistance; 0.1978 is the nearest proven 1h support.
📍 Potential entry: 0.2626
🎯 Target 1: 0.33246
🎯 Target 2: 0.40232
🛑 Stop / invalidation: 0.19274
Confirmation improves with an hourly close holding above 0.2626 and a push through 0.2967. Losing 0.2626 would weaken momentum; a close below 0.1978 would undermine the setup and puts 0.19274 as hard invalidation.
Want an alert if the next 1h close challenges 0.2967?
Not financial advice.
#LSK #MarketContext #UpsideScenario
$LSK just surged +37.42% in 24h to 0.2707, with 12,971,532.50975 in volume across 271,624 trades.
EMA20 at 0.22827 above EMA50 at 0.20938 signals bullish structure, while MACD stays above its signal. But RSI 76.16 flags a stretched move as price presses toward the 0.2967 resistance; 0.1978 is the nearest proven 1h support.
📍 Potential entry: 0.2626
🎯 Target 1: 0.33246
🎯 Target 2: 0.40232
🛑 Stop / invalidation: 0.19274
Confirmation improves with an hourly close holding above 0.2626 and a push through 0.2967. Losing 0.2626 would weaken momentum; a close below 0.1978 would undermine the setup and puts 0.19274 as hard invalidation.
Want an alert if the next 1h close challenges 0.2967?
Not financial advice.
#LSK #MarketContext #UpsideScenario
EMA20 at 0.22827 above EMA50 at 0.20938 signals bullish structure, while MACD stays above its signal. But RSI 76.16 flags a stretched move as price presses toward the 0.2967 resistance; 0.1978 is the nearest proven 1h support.
📍 Potential entry: 0.2626
🎯 Target 1: 0.33246
🎯 Target 2: 0.40232
🛑 Stop / invalidation: 0.19274
Confirmation improves with an hourly close holding above 0.2626 and a push through 0.2967. Losing 0.2626 would weaken momentum; a close below 0.1978 would undermine the setup and puts 0.19274 as hard invalidation.
Want an alert if the next 1h close challenges 0.2967?
Not financial advice.
#LSK #MarketContext #UpsideScenario
1
·
--
Binance under scrutiny after reported large wallet outflows, stablecoin freezes and renewed security concerns
Recent reports say sizable transfers labeled to Binance wallets coincided with a sudden bout of volatility in which $BTC briefly dropped and many long positions were liquidated. Separately, firms tied to major stablecoins were reported to have frozen linked balances. Binance has stated user funds remain safe and that it’s investigating.
Key points:
- Reported wallet outflows and sharp market moves are claims that multiple sources have flagged; full verification of amounts is outstanding.
- Reports of stablecoin freezes, if confirmed, signal how custody and compliance actions can ripple across markets.
- Some analysts point to state-linked cyber actors in related exploits; those attributions remain unverified.
Counterpoint: BTC showed signs of recovery after the initial shock, underscoring market resilience.
Takeaway: Confirm facts from official statements and infrastructure providers before drawing conclusions; security and custody transparency are the issues to watch.
#Binance #CryptoSecurity #Bitcoin #Stablecoins
Binance under scrutiny after reported large wallet outflows, stablecoin freezes and renewed security concerns
Recent reports say sizable transfers labeled to Binance wallets coincided with a sudden bout of volatility in which $BTC briefly dropped and many long positions were liquidated. Separately, firms tied to major stablecoins were reported to have frozen linked balances. Binance has stated user funds remain safe and that it’s investigating.
Key points:
- Reported wallet outflows and sharp market moves are claims that multiple sources have flagged; full verification of amounts is outstanding.
- Reports of stablecoin freezes, if confirmed, signal how custody and compliance actions can ripple across markets.
- Some analysts point to state-linked cyber actors in related exploits; those attributions remain unverified.
Counterpoint: BTC showed signs of recovery after the initial shock, underscoring market resilience.
Takeaway: Confirm facts from official statements and infrastructure providers before drawing conclusions; security and custody transparency are the issues to watch.
#Binance #CryptoSecurity #Bitcoin #Stablecoins
Recent reports say sizable transfers labeled to Binance wallets coincided with a sudden bout of volatility in which $BTC briefly dropped and many long positions were liquidated. Separately, firms tied to major stablecoins were reported to have frozen linked balances. Binance has stated user funds remain safe and that it’s investigating.
Key points:
- Reported wallet outflows and sharp market moves are claims that multiple sources have flagged; full verification of amounts is outstanding.
- Reports of stablecoin freezes, if confirmed, signal how custody and compliance actions can ripple across markets.
- Some analysts point to state-linked cyber actors in related exploits; those attributions remain unverified.
Counterpoint: BTC showed signs of recovery after the initial shock, underscoring market resilience.
Takeaway: Confirm facts from official statements and infrastructure providers before drawing conclusions; security and custody transparency are the issues to watch.
#Binance #CryptoSecurity #Bitcoin #Stablecoins

1
·
--
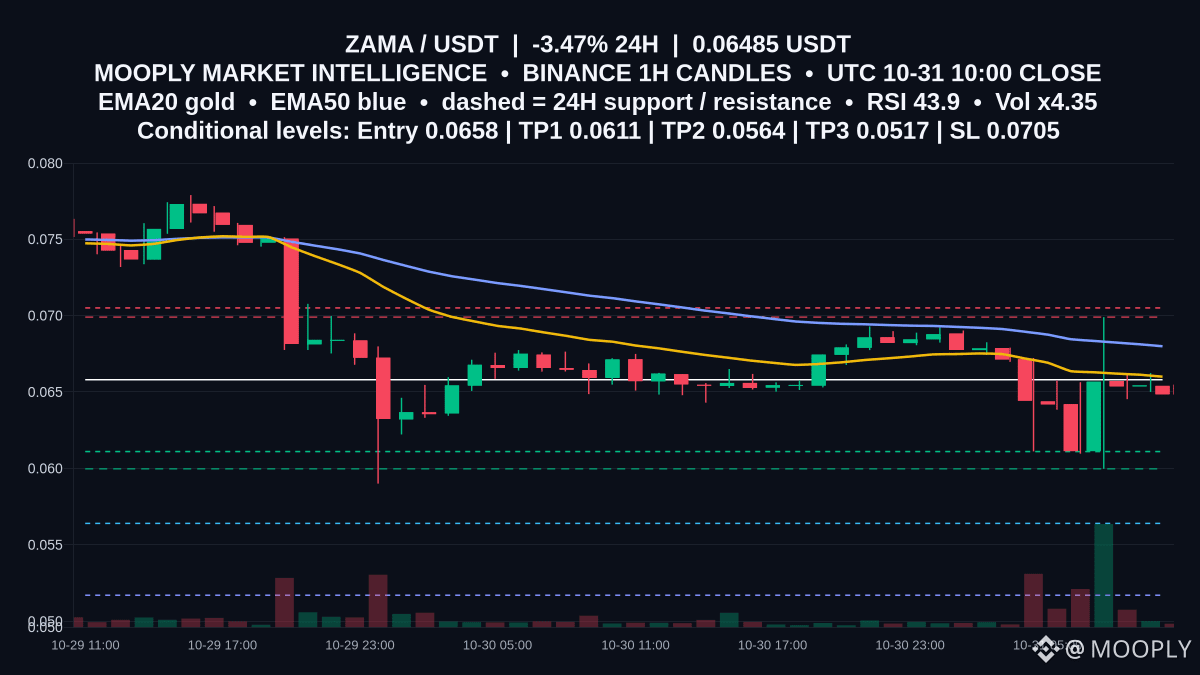
Spotlight on $ZAMA: 0.06485, down -3.472% over 24h.
Price sits below EMA20 0.066 and EMA50 0.06799, with RSI 43.92 and MACD below its signal (−0.00087763 < −0.00081243), keeping bias heavy. The 0.0699 area is the cap, while 0.05997 is the nearest firm support. ATR14 at 0.00238 suggests room for measured follow-through.
📍 Potential entry: 0.0658
🎯 Target 1: 0.0611
🎯 Target 2: 0.0564
🛑 Stop / invalidation: 0.0705
A rejection near 0.0658 beneath the 0.066/0.06799 EMA cluster would favor continuation toward 0.0611 and 0.0564, with 0.05997 a key checkpoint. A sustained close above 0.0705 would invalidate by reclaiming 0.0699 and breaking the short-term bearish structure.
Which level are you watching first, 0.0699 or 0.05997?
Not financial advice.
#ZAMA #MarketContext #DownsideScenario
Spotlight on $ZAMA : 0.06485, down -3.472% over 24h.
Price sits below EMA20 0.066 and EMA50 0.06799, with RSI 43.92 and MACD below its signal (−0.00087763 < −0.00081243), keeping bias heavy. The 0.0699 area is the cap, while 0.05997 is the nearest firm support. ATR14 at 0.00238 suggests room for measured follow-through.
📍 Potential entry: 0.0658
🎯 Target 1: 0.0611
🎯 Target 2: 0.0564
🛑 Stop / invalidation: 0.0705
A rejection near 0.0658 beneath the 0.066/0.06799 EMA cluster would favor continuation toward 0.0611 and 0.0564, with 0.05997 a key checkpoint. A sustained close above 0.0705 would invalidate by reclaiming 0.0699 and breaking the short-term bearish structure.
Which level are you watching first, 0.0699 or 0.05997?
Not financial advice.
#ZAMA #MarketContext #DownsideScenario
Price sits below EMA20 0.066 and EMA50 0.06799, with RSI 43.92 and MACD below its signal (−0.00087763 < −0.00081243), keeping bias heavy. The 0.0699 area is the cap, while 0.05997 is the nearest firm support. ATR14 at 0.00238 suggests room for measured follow-through.
📍 Potential entry: 0.0658
🎯 Target 1: 0.0611
🎯 Target 2: 0.0564
🛑 Stop / invalidation: 0.0705
A rejection near 0.0658 beneath the 0.066/0.06799 EMA cluster would favor continuation toward 0.0611 and 0.0564, with 0.05997 a key checkpoint. A sustained close above 0.0705 would invalidate by reclaiming 0.0699 and breaking the short-term bearish structure.
Which level are you watching first, 0.0699 or 0.05997?
Not financial advice.
#ZAMA #MarketContext #DownsideScenario
2
·
--
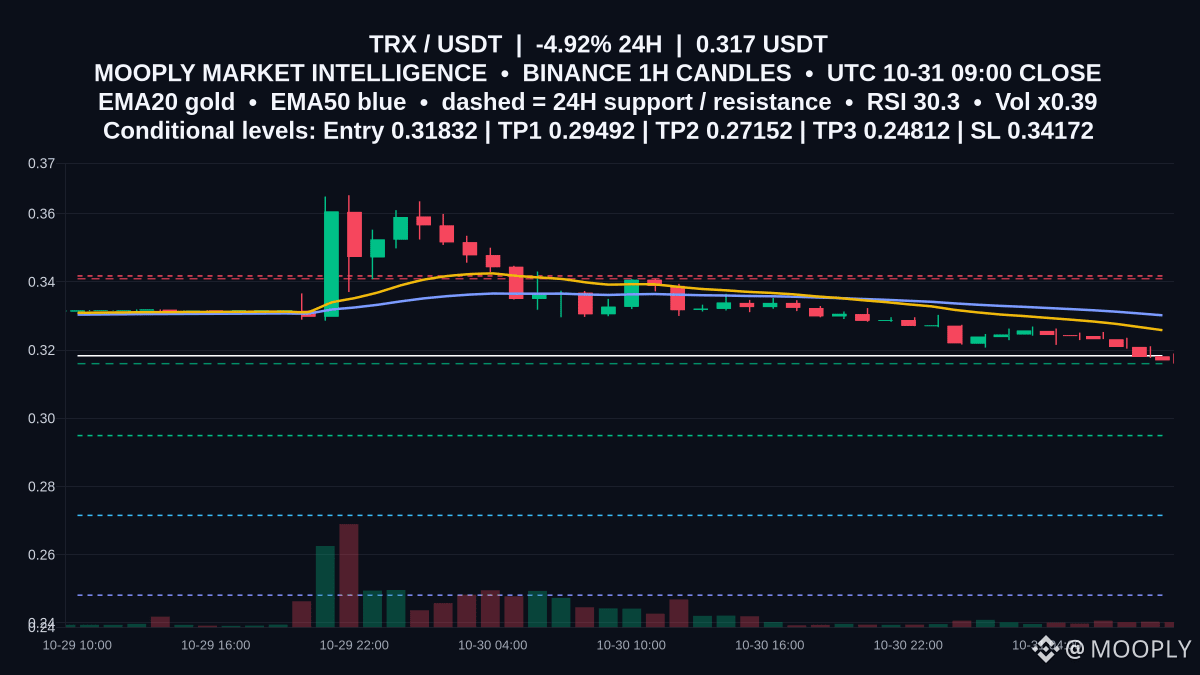
Bearish momentum grips $TRX at 0.317, down 4.919% over 24h.
Price sits beneath EMA20 0.32581 and EMA50 0.33018, with RSI at 30.28. The nearby 0.316 support is pivotal—losing it would favor continuation—while 0.3409 caps the upside. MACD below signal (-0.00420805 vs -0.00350399) adds to downside pressure.
📍 Potential entry: 0.31832
🎯 Target 1: 0.29492
🎯 Target 2: 0.27152
🛑 Stop / invalidation: 0.34172
Confirmation improves on a 1h close below 0.316 and failure to reclaim it on retests. A push back above 0.3409—and especially through 0.34172—would invalidate. Want an alert if 0.316 breaks or if price first retests 0.31832?
Not financial advice.
#TRX #MarketContext #DownsideScenario
Bearish momentum grips $TRX at 0.317, down 4.919% over 24h.
Price sits beneath EMA20 0.32581 and EMA50 0.33018, with RSI at 30.28. The nearby 0.316 support is pivotal—losing it would favor continuation—while 0.3409 caps the upside. MACD below signal (-0.00420805 vs -0.00350399) adds to downside pressure.
📍 Potential entry: 0.31832
🎯 Target 1: 0.29492
🎯 Target 2: 0.27152
🛑 Stop / invalidation: 0.34172
Confirmation improves on a 1h close below 0.316 and failure to reclaim it on retests. A push back above 0.3409—and especially through 0.34172—would invalidate. Want an alert if 0.316 breaks or if price first retests 0.31832?
Not financial advice.
#TRX #MarketContext #DownsideScenario
Price sits beneath EMA20 0.32581 and EMA50 0.33018, with RSI at 30.28. The nearby 0.316 support is pivotal—losing it would favor continuation—while 0.3409 caps the upside. MACD below signal (-0.00420805 vs -0.00350399) adds to downside pressure.
📍 Potential entry: 0.31832
🎯 Target 1: 0.29492
🎯 Target 2: 0.27152
🛑 Stop / invalidation: 0.34172
Confirmation improves on a 1h close below 0.316 and failure to reclaim it on retests. A push back above 0.3409—and especially through 0.34172—would invalidate. Want an alert if 0.316 breaks or if price first retests 0.31832?
Not financial advice.
#TRX #MarketContext #DownsideScenario
·
--
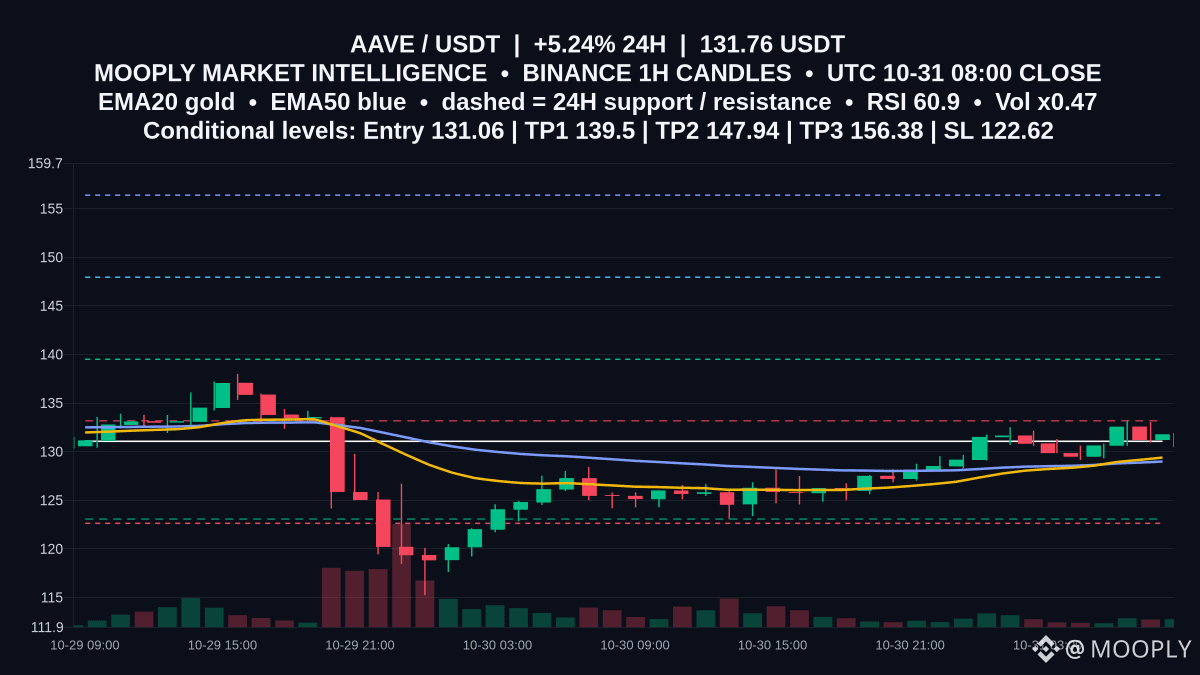
Up 5.24% in 24h, $AAVE is pressing into 133.17 resistance.
Why it matters: EMA20 at 129.39 sits above EMA50 at 128.98 with RSI 60.93, pointing to a constructive bias; a clean 1h close through 133.17 could unlock continuation, while lighter participation (0.47x) makes that breakout test critical.
📍 Potential entry: 131.06
🎯 Target 1: 139.5
🎯 Target 2: 147.94
🛑 Stop / invalidation: 122.62
Confirmation comes with a 1h close above 133.17 that holds as support. Rejection there and a slip under 129.39 would weaken the setup; sustained trade below 123.06 invalidates. Want a ping if 133.17 flips to support on the next 1h close?
Not financial advice.
#AAVE #MarketContext #UpsideScenario
Up 5.24% in 24h, $AAVE is pressing into 133.17 resistance.
Why it matters: EMA20 at 129.39 sits above EMA50 at 128.98 with RSI 60.93, pointing to a constructive bias; a clean 1h close through 133.17 could unlock continuation, while lighter participation (0.47x) makes that breakout test critical.
📍 Potential entry: 131.06
🎯 Target 1: 139.5
🎯 Target 2: 147.94
🛑 Stop / invalidation: 122.62
Confirmation comes with a 1h close above 133.17 that holds as support. Rejection there and a slip under 129.39 would weaken the setup; sustained trade below 123.06 invalidates. Want a ping if 133.17 flips to support on the next 1h close?
Not financial advice.
#AAVE #MarketContext #UpsideScenario
Why it matters: EMA20 at 129.39 sits above EMA50 at 128.98 with RSI 60.93, pointing to a constructive bias; a clean 1h close through 133.17 could unlock continuation, while lighter participation (0.47x) makes that breakout test critical.
📍 Potential entry: 131.06
🎯 Target 1: 139.5
🎯 Target 2: 147.94
🛑 Stop / invalidation: 122.62
Confirmation comes with a 1h close above 133.17 that holds as support. Rejection there and a slip under 129.39 would weaken the setup; sustained trade below 123.06 invalidates. Want a ping if 133.17 flips to support on the next 1h close?
Not financial advice.
#AAVE #MarketContext #UpsideScenario
1
·
--
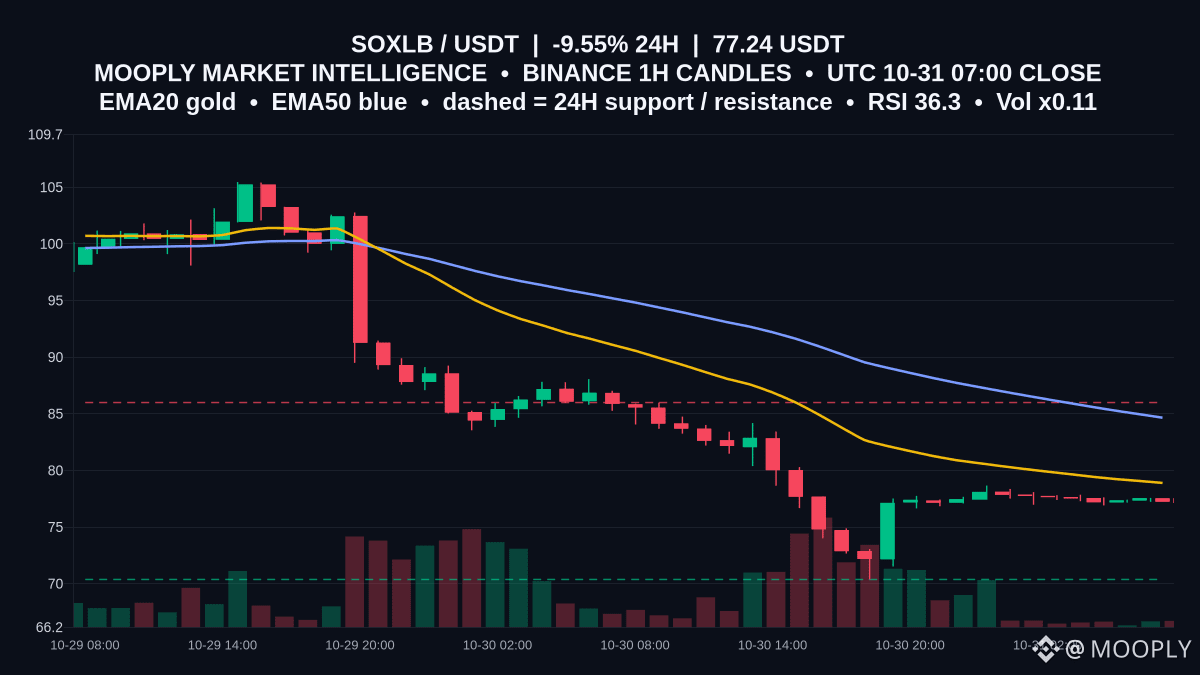
Range is tightening on $SOXLB after a sharp 24h drop to 77.24 (-9.553%).
Price sits beneath EMA20 78.891 and EMA50 84.651, so the short-term bias stays heavy, while RSI 36.28 signals weak but not oversold momentum. MACD at -2.45467439 is above its signal -3.15024382, hinting downside pressure may be easing, and volume participation is thin at 0.11x.
For now, the band is clear: support 70.37 and resistance 85.99. Respecting this range favors mean reversion around SMA20 77.495; a 1h close above 85.99 would tilt toward recovery, while a break below 70.37 would extend the slide. Which side are you watching to be tested first?
Not financial advice.
#SOXLB #MarketContext #RangeWatch
Range is tightening on $SOXLB after a sharp 24h drop to 77.24 (-9.553%).
Price sits beneath EMA20 78.891 and EMA50 84.651, so the short-term bias stays heavy, while RSI 36.28 signals weak but not oversold momentum. MACD at -2.45467439 is above its signal -3.15024382, hinting downside pressure may be easing, and volume participation is thin at 0.11x.
For now, the band is clear: support 70.37 and resistance 85.99. Respecting this range favors mean reversion around SMA20 77.495; a 1h close above 85.99 would tilt toward recovery, while a break below 70.37 would extend the slide. Which side are you watching to be tested first?
Not financial advice.
#SOXLB #MarketContext #RangeWatch
Price sits beneath EMA20 78.891 and EMA50 84.651, so the short-term bias stays heavy, while RSI 36.28 signals weak but not oversold momentum. MACD at -2.45467439 is above its signal -3.15024382, hinting downside pressure may be easing, and volume participation is thin at 0.11x.
For now, the band is clear: support 70.37 and resistance 85.99. Respecting this range favors mean reversion around SMA20 77.495; a 1h close above 85.99 would tilt toward recovery, while a break below 70.37 would extend the slide. Which side are you watching to be tested first?
Not financial advice.
#SOXLB #MarketContext #RangeWatch
5
·
--
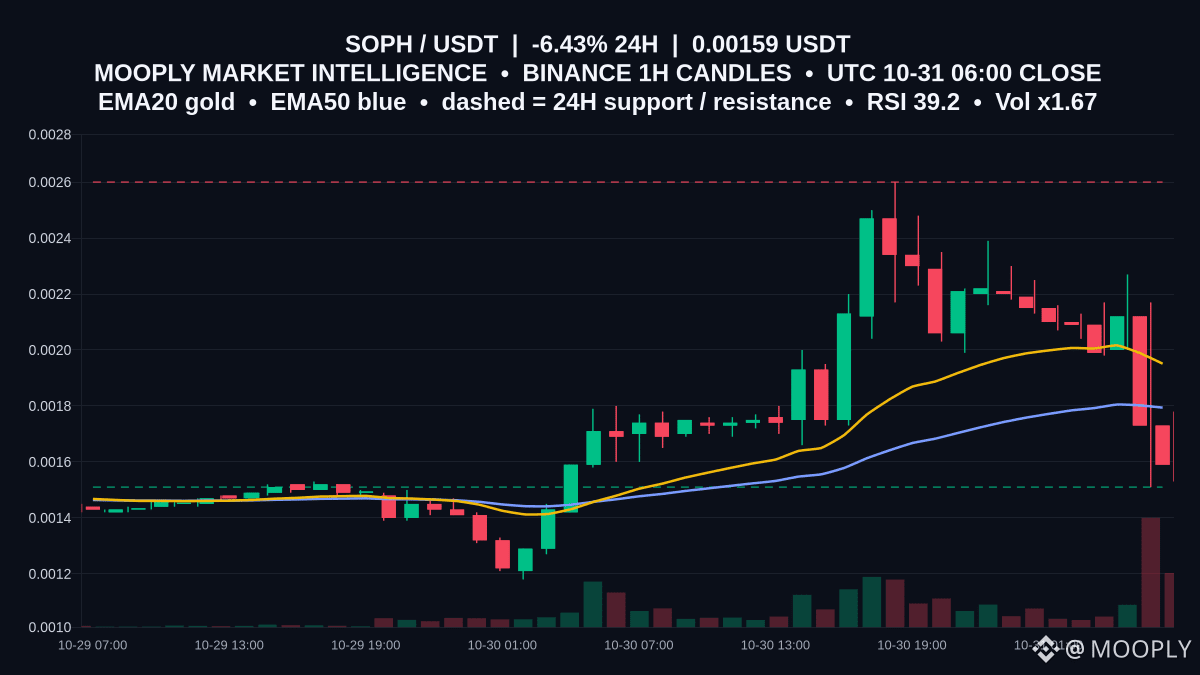
$SOPH trades at 0.00159, hovering just above mapped support at 0.00151 after a -26.05% 6h slide.
Price is below EMA20 0.0019512 and EMA50 0.001794; with RSI 39.15 and MACD beneath its signal (0.00004674 < 0.00012146), momentum leans weak, so reacting to nearby levels becomes critical.
Range context: support 0.00151, resistance 0.0026. With ATR 0.0002657, swings inside this band can be meaningful; watch the 1h closes near 0.00151.
A 1h close back above 0.0019512 would bolster a recovery toward 0.0026; a decisive close below 0.00151 would shift bias lower. A clean break and hold above 0.0026 would mark range expansion.
Are you watching for a reaction at 0.00151 or waiting for a reclaim of 0.0019512 first?
Not financial advice.
#SOPH #MarketContext #RangeWatch
$SOPH trades at 0.00159, hovering just above mapped support at 0.00151 after a -26.05% 6h slide.
Price is below EMA20 0.0019512 and EMA50 0.001794; with RSI 39.15 and MACD beneath its signal (0.00004674 < 0.00012146), momentum leans weak, so reacting to nearby levels becomes critical.
Range context: support 0.00151, resistance 0.0026. With ATR 0.0002657, swings inside this band can be meaningful; watch the 1h closes near 0.00151.
A 1h close back above 0.0019512 would bolster a recovery toward 0.0026; a decisive close below 0.00151 would shift bias lower. A clean break and hold above 0.0026 would mark range expansion.
Are you watching for a reaction at 0.00151 or waiting for a reclaim of 0.0019512 first?
Not financial advice.
#SOPH #MarketContext #RangeWatch
Price is below EMA20 0.0019512 and EMA50 0.001794; with RSI 39.15 and MACD beneath its signal (0.00004674 < 0.00012146), momentum leans weak, so reacting to nearby levels becomes critical.
Range context: support 0.00151, resistance 0.0026. With ATR 0.0002657, swings inside this band can be meaningful; watch the 1h closes near 0.00151.
A 1h close back above 0.0019512 would bolster a recovery toward 0.0026; a decisive close below 0.00151 would shift bias lower. A clean break and hold above 0.0026 would mark range expansion.
Are you watching for a reaction at 0.00151 or waiting for a reclaim of 0.0019512 first?
Not financial advice.
#SOPH #MarketContext #RangeWatch
3
Log in to explore more content
Join global crypto users on Binance Square
⚡️ Get latest and useful information about crypto.
💬 Trusted by the world’s largest crypto exchange.
👍 Discover real insights from verified creators.
Email / Phone number
Trending Topics
BinanceToResumePhaseOneOfWithdrawals
5,178 views
252 Discussing
Security Incident | Recovery Update #4: Withdrawals Resume in Phases (2026-11-01)
Binance Announcement
·246 Likes
·274.2k views
BinanceHadAlreadyCovered$6BofHackLoss
1,393 views
44 Discussing
FBIConfirmsNorthKoreaIsResponsibleForBinanceCryptoHack
8,099 views
54 Discussing