

China_BNB
7.9k Posts

China_BNB
 Square Verified+
Report
Block User
Content Creator [@ChinaBNB1 - X] Community Builder✨My Choice✨Trading Expert✨
Open Trade
High-Frequency Trader
2 Years
559 Following
39.3K+ Followers
23.3K+ Liked
Posts
Portfolio
All
Quotes
Videos
Live
·
--
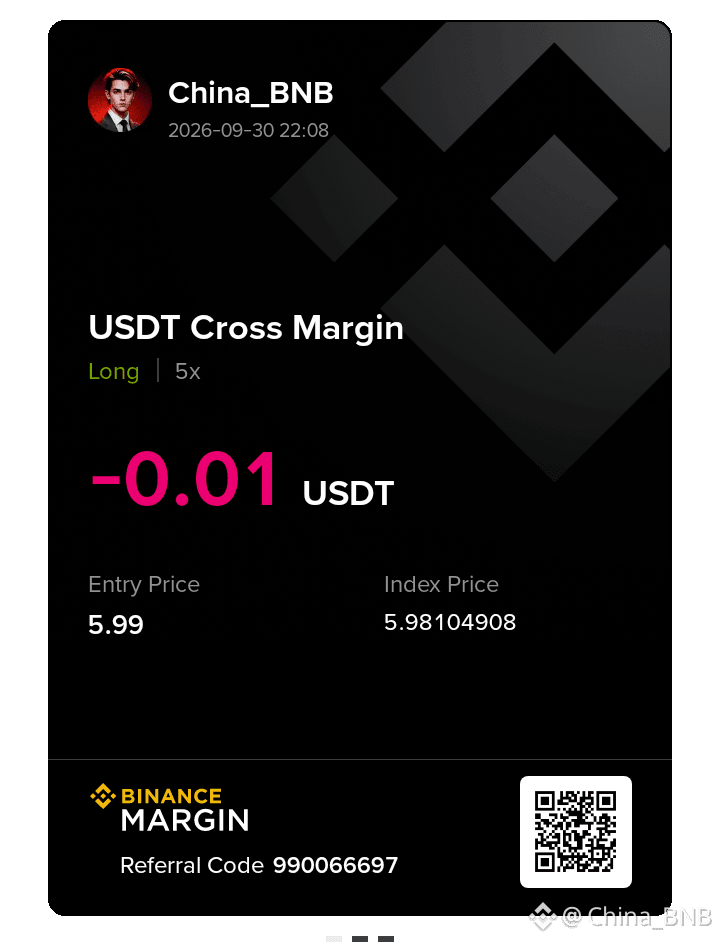
$BNCB / USDT stock SOPT Margin trade have difirent Feture & Spot Margin trade it !
{spot}(BNCBUSDT)
$NVDAB $AAPLB
$BNCB / USDT stock SOPT Margin trade have difirent Feture & Spot Margin trade it !
$NVDAB $AAPLB
$NVDAB $AAPLB
4
204
·
--
$QNT / USDT Feture trade
Short signal 🚥 Cloud clearly show Next 4hr short position entry level $298-$307
$QNT / USDT Feture trade
Short signal 🚥 Cloud clearly show Next 4hr short position entry level $298-$307
Short signal 🚥 Cloud clearly show Next 4hr short position entry level $298-$307
2
512
·
--
Hit 🎯 Take profit next level 🎚️
Hit 🎯 Take profit next level 🎚️
China_BNB
·
--
Bullish🚨 $PIPPIN/USDT — FetuSIGNAL
PIPPIN is around $0.0179 right now, up about 3.3% in 24h.
🟢 Support: $0.0175
🎯 Entry zone: $0.0175–$0.0180
🔴 Resistance: $0.0185
🚀 Breakout: Above $0.0185 with volume
🎯 Targets: $0.0195 → $0.0200
⚠️ Below $0.0175: Watch $0.0160
Simple setup: Hold above $0.0175 = bullish structure remains. A clean break of $0.0185 could open the next move toward $0.020.
Not financial advice—PIPPIN is highly volatile.
$PIPPIN
PIPPIN is around $0.0179 right now, up about 3.3% in 24h.
🟢 Support: $0.0175
🎯 Entry zone: $0.0175–$0.0180
🔴 Resistance: $0.0185
🚀 Breakout: Above $0.0185 with volume
🎯 Targets: $0.0195 → $0.0200
⚠️ Below $0.0175: Watch $0.0160
Simple setup: Hold above $0.0175 = bullish structure remains. A clean break of $0.0185 could open the next move toward $0.020.
Not financial advice—PIPPIN is highly volatile.
$PIPPIN
1
79
·
--
Bearish
$NMR _ USDT perpetual & Spot Signal 📊
🔴 Resistance: $12.20–$12.50
🚀 Break & hold above $12.50 → watch $13.00 → $14.00
🟢 Support: $12.00
⚠️ Below $12.00 → watch $11.50 → $11.00
$NMR is testing resistance. 🔥 A strong breakout above $12.50 with volume can open the next levels. If rejected, watch $12.00 support. Trade carefully. DYOR.
$NMR _ USDT perpetual & Spot Signal 📊
🔴 Resistance: $12.20–$12.50
🚀 Break & hold above $12.50 → watch $13.00 → $14.00
🟢 Support: $12.00
⚠️ Below $12.00 → watch $11.50 → $11.00
$NMR is testing resistance. 🔥 A strong breakout above $12.50 with volume can open the next levels. If rejected, watch $12.00 support. Trade carefully. DYOR.
🔴 Resistance: $12.20–$12.50
🚀 Break & hold above $12.50 → watch $13.00 → $14.00
🟢 Support: $12.00
⚠️ Below $12.00 → watch $11.50 → $11.00
$NMR is testing resistance. 🔥 A strong breakout above $12.50 with volume can open the next levels. If rejected, watch $12.00 support. Trade carefully. DYOR.
1
415
·
--
Bullish
🚨 $NOM/USDT — QUICK SPOT & Feture SIGNAL
$NOM current data shows about $0.00217, with a 24h range of roughly $0.00201–$0.00219 and +7.97% over 24h.
🟢 Support: $0.00200–$0.00205
🎯 Entry zone: $0.00205–$0.00215
🔴 Resistance: $0.00220
🚀 Breakout: Above $0.00220 with strong volume
🎯 Targets: $0.00230 → $0.00250 → $0.00270
⚠️ Invalidation: Below $0.00200
Simple plan: NOM is approaching the $0.00220 resistance. A clean breakout and hold above it would be the key confirmation; rejection could send price back toward the $0.00200 area.
High volatility — use risk management.
🚨 $NOM /USDT — QUICK SPOT & Feture SIGNAL
$NOM current data shows about $0.00217, with a 24h range of roughly $0.00201–$0.00219 and +7.97% over 24h.
🟢 Support: $0.00200–$0.00205
🎯 Entry zone: $0.00205–$0.00215
🔴 Resistance: $0.00220
🚀 Breakout: Above $0.00220 with strong volume
🎯 Targets: $0.00230 → $0.00250 → $0.00270
⚠️ Invalidation: Below $0.00200
Simple plan: NOM is approaching the $0.00220 resistance. A clean breakout and hold above it would be the key confirmation; rejection could send price back toward the $0.00200 area.
High volatility — use risk management.
$NOM current data shows about $0.00217, with a 24h range of roughly $0.00201–$0.00219 and +7.97% over 24h.
🟢 Support: $0.00200–$0.00205
🎯 Entry zone: $0.00205–$0.00215
🔴 Resistance: $0.00220
🚀 Breakout: Above $0.00220 with strong volume
🎯 Targets: $0.00230 → $0.00250 → $0.00270
⚠️ Invalidation: Below $0.00200
Simple plan: NOM is approaching the $0.00220 resistance. A clean breakout and hold above it would be the key confirmation; rejection could send price back toward the $0.00200 area.
High volatility — use risk management.
1
559
·
--
Bullish
🚨 $PIPPIN/USDT — FetuSIGNAL
PIPPIN is around $0.0179 right now, up about 3.3% in 24h.
🟢 Support: $0.0175
🎯 Entry zone: $0.0175–$0.0180
🔴 Resistance: $0.0185
🚀 Breakout: Above $0.0185 with volume
🎯 Targets: $0.0195 → $0.0200
⚠️ Below $0.0175: Watch $0.0160
Simple setup: Hold above $0.0175 = bullish structure remains. A clean break of $0.0185 could open the next move toward $0.020.
Not financial advice—PIPPIN is highly volatile.
$PIPPIN
🚨 $PIPPIN /USDT — FetuSIGNAL
PIPPIN is around $0.0179 right now, up about 3.3% in 24h.
🟢 Support: $0.0175
🎯 Entry zone: $0.0175–$0.0180
🔴 Resistance: $0.0185
🚀 Breakout: Above $0.0185 with volume
🎯 Targets: $0.0195 → $0.0200
⚠️ Below $0.0175: Watch $0.0160
Simple setup: Hold above $0.0175 = bullish structure remains. A clean break of $0.0185 could open the next move toward $0.020.
Not financial advice—PIPPIN is highly volatile.
$PIPPIN
PIPPIN is around $0.0179 right now, up about 3.3% in 24h.
🟢 Support: $0.0175
🎯 Entry zone: $0.0175–$0.0180
🔴 Resistance: $0.0185
🚀 Breakout: Above $0.0185 with volume
🎯 Targets: $0.0195 → $0.0200
⚠️ Below $0.0175: Watch $0.0160
Simple setup: Hold above $0.0175 = bullish structure remains. A clean break of $0.0185 could open the next move toward $0.020.
Not financial advice—PIPPIN is highly volatile.
$PIPPIN
1
1
427
·
--
Bullish
$DEXE 🚨 $DEXE/USDT SPOT SIGNAL
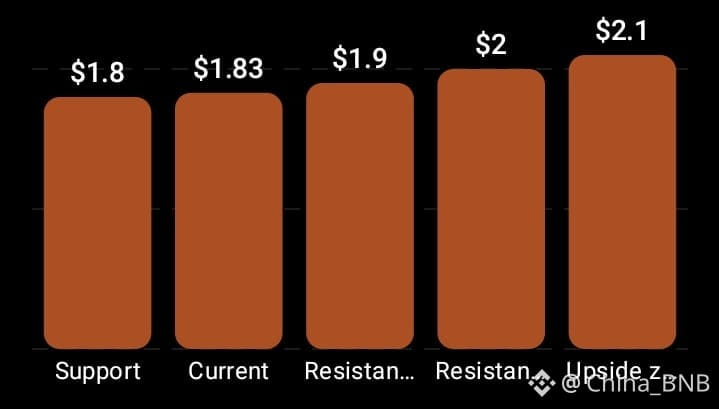
DEXE is holding around $1.83.
🟢 Support: $1.80
🎯 Entry Zone: $1.80–$1.83
🔴 Resistance: $1.90
🚀 Breakout: Above $1.90
🎯 Targets: $2.00 → $2.10
⚠️ Risk Zone: Below $1.80
Simple plan: Watch $1.90 closely. A strong breakout with volume could open the path toward $2.00–$2.10. If $1.80 breaks, avoid chasing.
Trade smart — levels can change quickly.
$DEXE 🚨 $DEXE /USDT SPOT SIGNAL
DEXE is holding around $1.83.
🟢 Support: $1.80
🎯 Entry Zone: $1.80–$1.83
🔴 Resistance: $1.90
🚀 Breakout: Above $1.90
🎯 Targets: $2.00 → $2.10
⚠️ Risk Zone: Below $1.80
Simple plan: Watch $1.90 closely. A strong breakout with volume could open the path toward $2.00–$2.10. If $1.80 breaks, avoid chasing.
Trade smart — levels can change quickly.
DEXE is holding around $1.83.
🟢 Support: $1.80
🎯 Entry Zone: $1.80–$1.83
🔴 Resistance: $1.90
🚀 Breakout: Above $1.90
🎯 Targets: $2.00 → $2.10
⚠️ Risk Zone: Below $1.80
Simple plan: Watch $1.90 closely. A strong breakout with volume could open the path toward $2.00–$2.10. If $1.80 breaks, avoid chasing.
Trade smart — levels can change quickly.
3
655
·
--
Bearish
Hi there is important to all Holder $QNT
{future}(QNTUSDT)
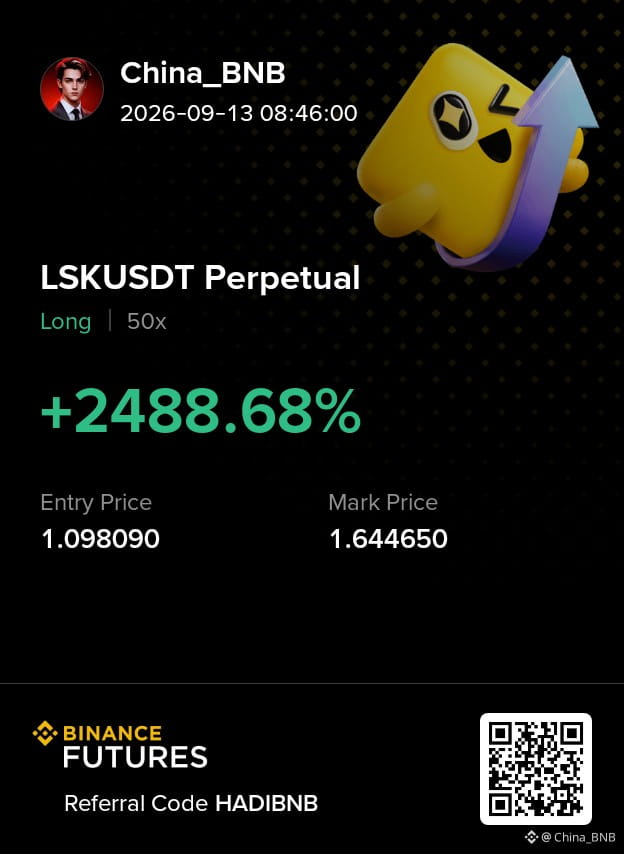
Back to the $76 is going to soon 🔜 bearish RSI is still bull but MACD indicator still show back Bearish so I have open short on the way #QNT-3.19%
Hi there is important to all Holder $QNT
Back to the $76 is going to soon 🔜 bearish RSI is still bull but MACD indicator still show back Bearish so I have open short on the way #QNT-3.19%
Back to the $76 is going to soon 🔜 bearish RSI is still bull but MACD indicator still show back Bearish so I have open short on the way #QNT-3.19%
4
140
·
--
🚨 BITCOIN IS AT A CRITICAL LEVEL — THE NEXT MOVE MATTERS!
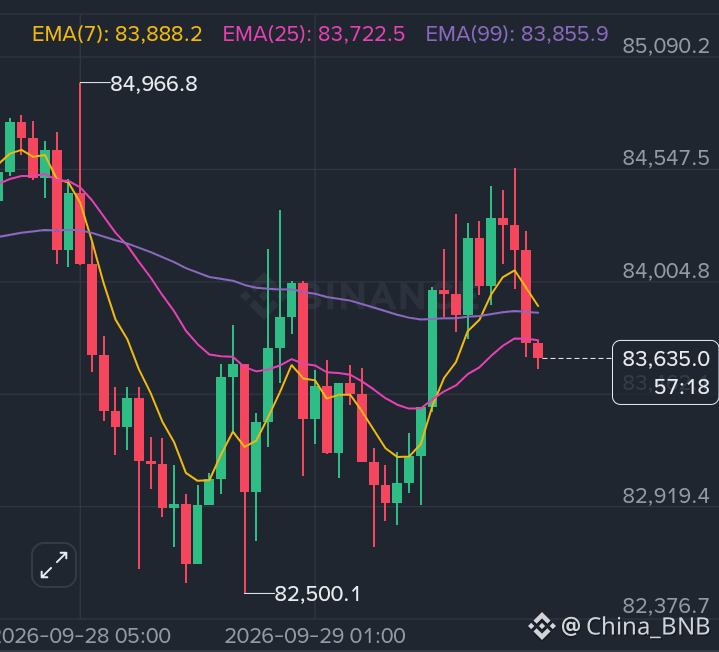
BTC is holding near the $83K–$84K zone, but buyers and sellers are fighting for control.
📍 Entry: $82.8K–$83.5K
🛡️ Support: $82K
⚠️ Strong Support: $80.5K
🚧 Resistance: $84.5K
🚀 Breakout: Above $86K
🎯 Targets: $88K → $90K
Holding $82K could keep buyers active. A break above $86K may bring stronger momentum. But losing $82K could send BTC toward $80.5K.
Will Bitcoin break $86K, or will sellers push it lower first?
$BTC #
🚨 BITCOIN IS AT A CRITICAL LEVEL — THE NEXT MOVE MATTERS!
BTC is holding near the $83K–$84K zone, but buyers and sellers are fighting for control.
📍 Entry: $82.8K–$83.5K
🛡️ Support: $82K
⚠️ Strong Support: $80.5K
🚧 Resistance: $84.5K
🚀 Breakout: Above $86K
🎯 Targets: $88K → $90K
Holding $82K could keep buyers active. A break above $86K may bring stronger momentum. But losing $82K could send BTC toward $80.5K.
Will Bitcoin break $86K, or will sellers push it lower first?
$BTC #
BTC is holding near the $83K–$84K zone, but buyers and sellers are fighting for control.
📍 Entry: $82.8K–$83.5K
🛡️ Support: $82K
⚠️ Strong Support: $80.5K
🚧 Resistance: $84.5K
🚀 Breakout: Above $86K
🎯 Targets: $88K → $90K
Holding $82K could keep buyers active. A break above $86K may bring stronger momentum. But losing $82K could send BTC toward $80.5K.
Will Bitcoin break $86K, or will sellers push it lower first?
$BTC #
2
183
·
--

Article
BITCOIN’S NEXT MOVE MAY DEPEND ON ONE KEY ZONEBitcoin is starting the week under pressure, but the bigger story is not the pullback — it is what happens around $82K–$84K.
BTC recently pushed above $87,000, reaching an eight-month high, before falling back toward the $83K–$84K area. On September 28, Bitcoin was trading around $83K, with short-term selling pressure returning.
The interesting part is that institutional demand has not disappeared. U.S. spot Bitcoin ETFs recorded around $2.39 billion in net inflows during September 21–25, marking a very strong week for ETF demand.
📊 What the chart is saying
For short-term traders, $82K–$83K is an important area to watch.
If BTC holds this zone, buyers may try to push price back toward $85K, followed by the recent $87K–$87.4K resistance area.
If $82K breaks with strong selling volume, attention could shift toward the $80K area and lower support zones.
The market is also dealing with macro pressure and changing leverage, so a breakout without confirmation can quickly turn into another rejection.
Right now, Bitcoin looks less like a simple bullish-or-bearish story and more like a battle between strong ETF demand and short-term selling pressure.
The real question is: will BTC defend $82K and attempt another attack on $87K, or is this pullback only the beginning of a deeper correction?
#BitcoinSpotETFs$2.39BWeeklyNetInflow $BTC
{spot}(BTCUSDT)
BITCOIN’S NEXT MOVE MAY DEPEND ON ONE KEY ZONE
Bitcoin is starting the week under pressure, but the bigger story is not the pullback — it is what happens around $82K–$84K.
BTC recently pushed above $87,000, reaching an eight-month high, before falling back toward the $83K–$84K area. On September 28, Bitcoin was trading around $83K, with short-term selling pressure returning.
The interesting part is that institutional demand has not disappeared. U.S. spot Bitcoin ETFs recorded around $2.39 billion in net inflows during September 21–25, marking a very strong week for ETF demand.
📊 What the chart is saying
For short-term traders, $82K–$83K is an important area to watch.
If BTC holds this zone, buyers may try to push price back toward $85K, followed by the recent $87K–$87.4K resistance area.
If $82K breaks with strong selling volume, attention could shift toward the $80K area and lower support zones.
The market is also dealing with macro pressure and changing leverage, so a breakout without confirmation can quickly turn into another rejection.
Right now, Bitcoin looks less like a simple bullish-or-bearish story and more like a battle between strong ETF demand and short-term selling pressure.
The real question is: will BTC defend $82K and attempt another attack on $87K, or is this pullback only the beginning of a deeper correction?
#BitcoinSpotETFs$2.39BWeeklyNetInflow $BTC
BTC recently pushed above $87,000, reaching an eight-month high, before falling back toward the $83K–$84K area. On September 28, Bitcoin was trading around $83K, with short-term selling pressure returning.
The interesting part is that institutional demand has not disappeared. U.S. spot Bitcoin ETFs recorded around $2.39 billion in net inflows during September 21–25, marking a very strong week for ETF demand.
📊 What the chart is saying
For short-term traders, $82K–$83K is an important area to watch.
If BTC holds this zone, buyers may try to push price back toward $85K, followed by the recent $87K–$87.4K resistance area.
If $82K breaks with strong selling volume, attention could shift toward the $80K area and lower support zones.
The market is also dealing with macro pressure and changing leverage, so a breakout without confirmation can quickly turn into another rejection.
Right now, Bitcoin looks less like a simple bullish-or-bearish story and more like a battle between strong ETF demand and short-term selling pressure.
The real question is: will BTC defend $82K and attempt another attack on $87K, or is this pullback only the beginning of a deeper correction?
#BitcoinSpotETFs$2.39BWeeklyNetInflow $BTC
160
·
--
Bullish
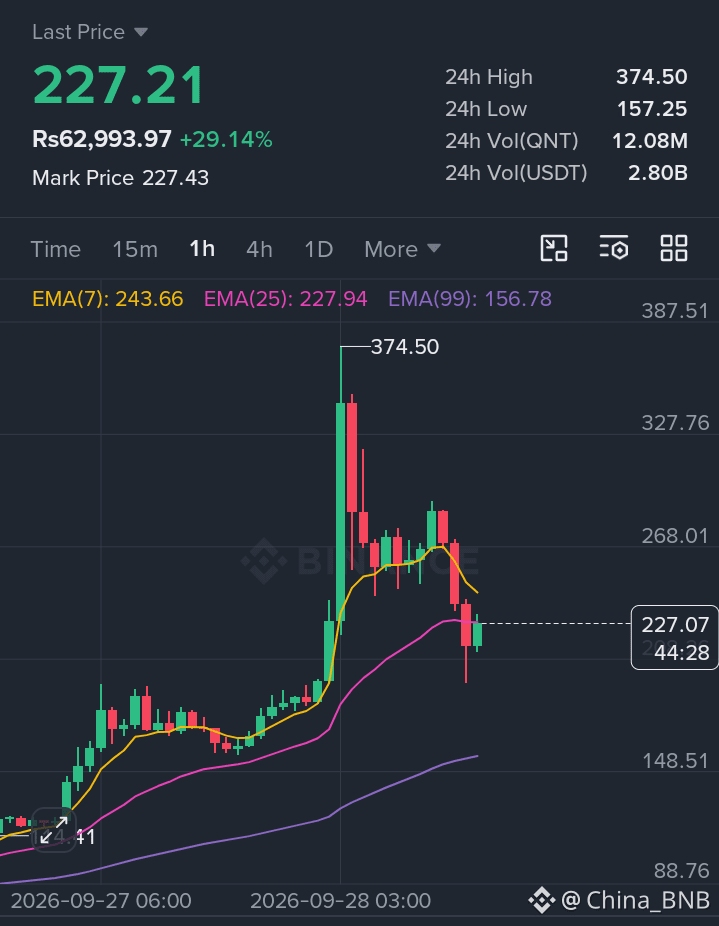
$QNT/USDT — Technical Analysis (28 Sep 2026)
QNT is around $270–$272 on the latest available Binance-linked data. Today’s range has been extremely wide: roughly $242–$320, after yesterday’s move from about $150 to a high near $361.
Key levels:
🔴 Resistance 1: $275–$285
🔴 Resistance 2: $300–$320
🔴 Major resistance: $350–$361
🟢 Support 1: $265–$266
🟢 Support 2: $238–$245
🟢 Major support: $210–$220
Momentum: The broader short-term trend remains strongly bullish, but indicators are becoming stretched. Investing.com's latest technical snapshot showed RSI around 68.6, while StochRSI and Williams %R were already in overbought territory.
Important setup:
If QNT holds $265–266 and reclaims $285, the next technical test is $300–320. A sustained move above $320 would put $350–361 back into focus.
If $265 breaks decisively, watch $238–245. Below that, the deeper correction zone is approximately $210–220. CMC's current analysis similarly identifies $266 and $239 as key Fibonacci support areas.
⚠️ Because QNT has moved more than 400% in only a few days, normal support/resistance levels can be broken very quickly; position sizing and confirmation matter here.
$QNT $ZEC
$QNT /USDT — Technical Analysis (28 Sep 2026)
QNT is around $270–$272 on the latest available Binance-linked data. Today’s range has been extremely wide: roughly $242–$320, after yesterday’s move from about $150 to a high near $361.
Key levels:
🔴 Resistance 1: $275–$285
🔴 Resistance 2: $300–$320
🔴 Major resistance: $350–$361
🟢 Support 1: $265–$266
🟢 Support 2: $238–$245
🟢 Major support: $210–$220
Momentum: The broader short-term trend remains strongly bullish, but indicators are becoming stretched. Investing.com's latest technical snapshot showed RSI around 68.6, while StochRSI and Williams %R were already in overbought territory.
Important setup:
If QNT holds $265–266 and reclaims $285, the next technical test is $300–320. A sustained move above $320 would put $350–361 back into focus.
If $265 breaks decisively, watch $238–245. Below that, the deeper correction zone is approximately $210–220. CMC's current analysis similarly identifies $266 and $239 as key Fibonacci support areas.
⚠️ Because QNT has moved more than 400% in only a few days, normal support/resistance levels can be broken very quickly; position sizing and confirmation matter here.
$QNT $ZEC
QNT is around $270–$272 on the latest available Binance-linked data. Today’s range has been extremely wide: roughly $242–$320, after yesterday’s move from about $150 to a high near $361.
Key levels:
🔴 Resistance 1: $275–$285
🔴 Resistance 2: $300–$320
🔴 Major resistance: $350–$361
🟢 Support 1: $265–$266
🟢 Support 2: $238–$245
🟢 Major support: $210–$220
Momentum: The broader short-term trend remains strongly bullish, but indicators are becoming stretched. Investing.com's latest technical snapshot showed RSI around 68.6, while StochRSI and Williams %R were already in overbought territory.
Important setup:
If QNT holds $265–266 and reclaims $285, the next technical test is $300–320. A sustained move above $320 would put $350–361 back into focus.
If $265 breaks decisively, watch $238–245. Below that, the deeper correction zone is approximately $210–220. CMC's current analysis similarly identifies $266 and $239 as key Fibonacci support areas.
⚠️ Because QNT has moved more than 400% in only a few days, normal support/resistance levels can be broken very quickly; position sizing and confirmation matter here.
$QNT $ZEC
1
283
·
--
Article
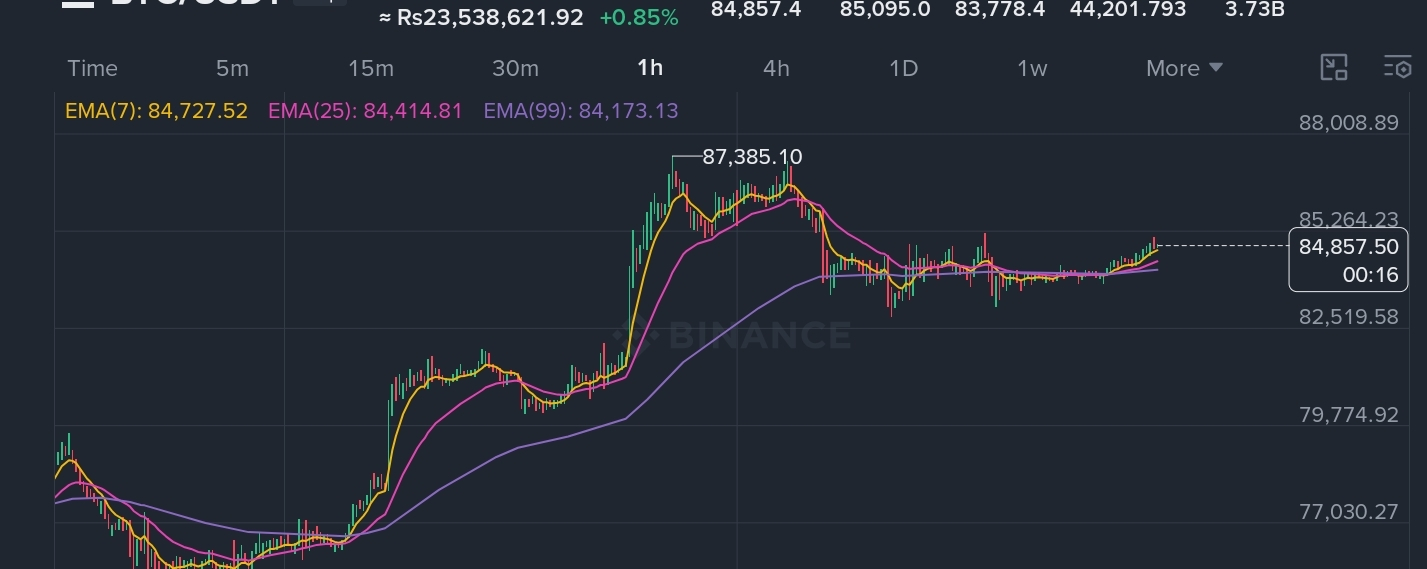
BITCOIN SLIPS BELOW $85K — NOW THE SUPPORT ZONES MATTERBitcoin is trading around $84.5K, after failing to hold above the $85K area. Recent data shows BTC has already pulled back from the $87.3K region, making the current zone important for short-term traders.
The first thing I’m watching is $84K.
If BTC stays above this area, buyers may try to reclaim $85K–$86K. But if selling pressure increases and $84K breaks clearly, attention could shift toward $82K, followed by the $80K–$81K support region.
This is where the market can become interesting
Bitcoin recently showed strong volatility, with September 21 recording a wide range between roughly $80.9K and $87.4K. That tells me liquidity is sitting on both sides, and a clean break could bring another fast move.
For now, I would watch $84K support vs. $85K resistance instead of chasing the move.
If $84K breaks, will Bitcoin finally test the $82K–$80K zone, or will buyers defend this level again?
#btc70k $BTC
{spot}(BTCUSDT)
BITCOIN SLIPS BELOW $85K — NOW THE SUPPORT ZONES MATTER
Bitcoin is trading around $84.5K, after failing to hold above the $85K area. Recent data shows BTC has already pulled back from the $87.3K region, making the current zone important for short-term traders.
The first thing I’m watching is $84K.
If BTC stays above this area, buyers may try to reclaim $85K–$86K. But if selling pressure increases and $84K breaks clearly, attention could shift toward $82K, followed by the $80K–$81K support region.
This is where the market can become interesting
Bitcoin recently showed strong volatility, with September 21 recording a wide range between roughly $80.9K and $87.4K. That tells me liquidity is sitting on both sides, and a clean break could bring another fast move.
For now, I would watch $84K support vs. $85K resistance instead of chasing the move.
If $84K breaks, will Bitcoin finally test the $82K–$80K zone, or will buyers defend this level again?
#btc70k $BTC
The first thing I’m watching is $84K.
If BTC stays above this area, buyers may try to reclaim $85K–$86K. But if selling pressure increases and $84K breaks clearly, attention could shift toward $82K, followed by the $80K–$81K support region.
This is where the market can become interesting
Bitcoin recently showed strong volatility, with September 21 recording a wide range between roughly $80.9K and $87.4K. That tells me liquidity is sitting on both sides, and a clean break could bring another fast move.
For now, I would watch $84K support vs. $85K resistance instead of chasing the move.
If $84K breaks, will Bitcoin finally test the $82K–$80K zone, or will buyers defend this level again?
#btc70k $BTC
1
116
·
--
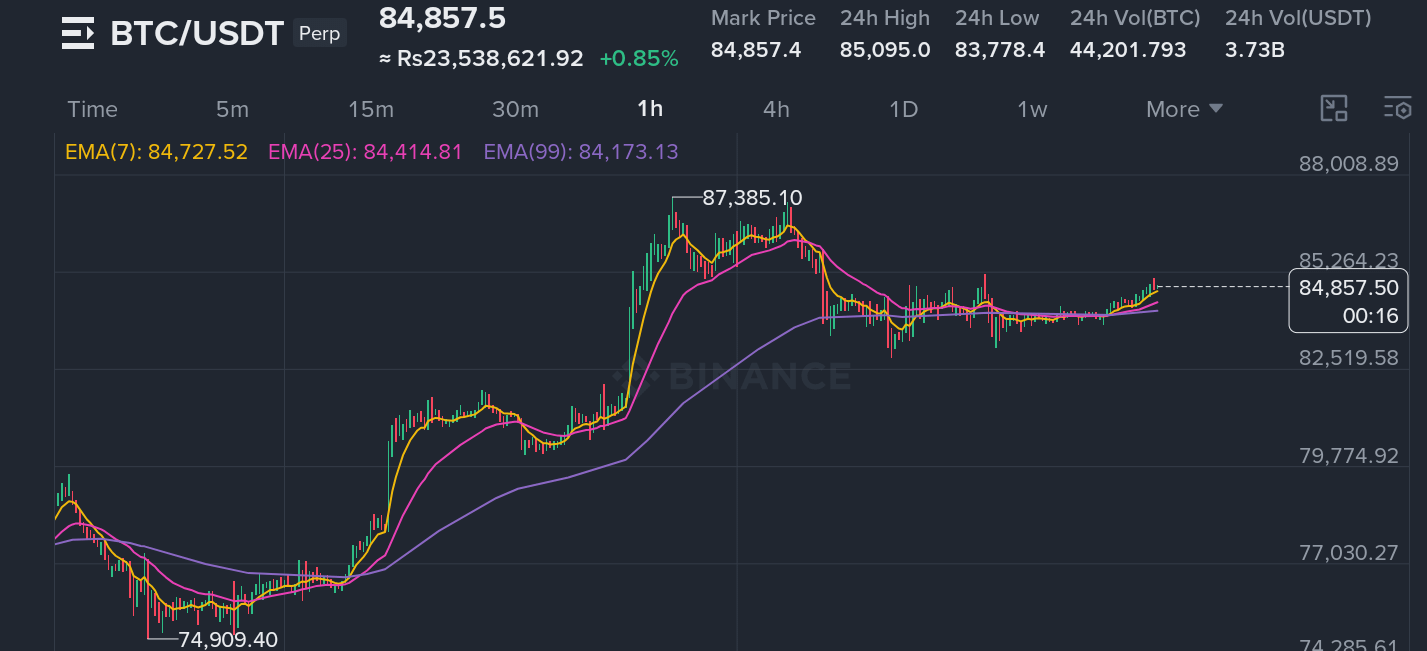
🎙️ BITCOIN SHORT $BTC $ETH AND ALTCOIN LONGER THAN BE CAREFUL MARKET 🔜
End
01 h 53 m 11 s
256
QNTUSDT
Perp
Limit/Short
3
1
·
--
Bearish
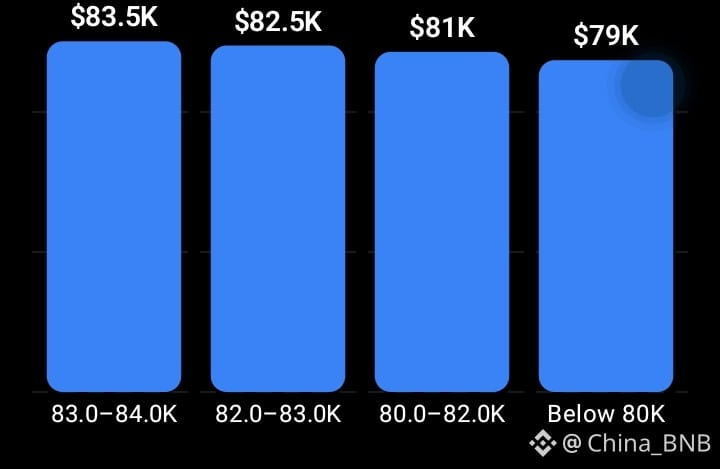
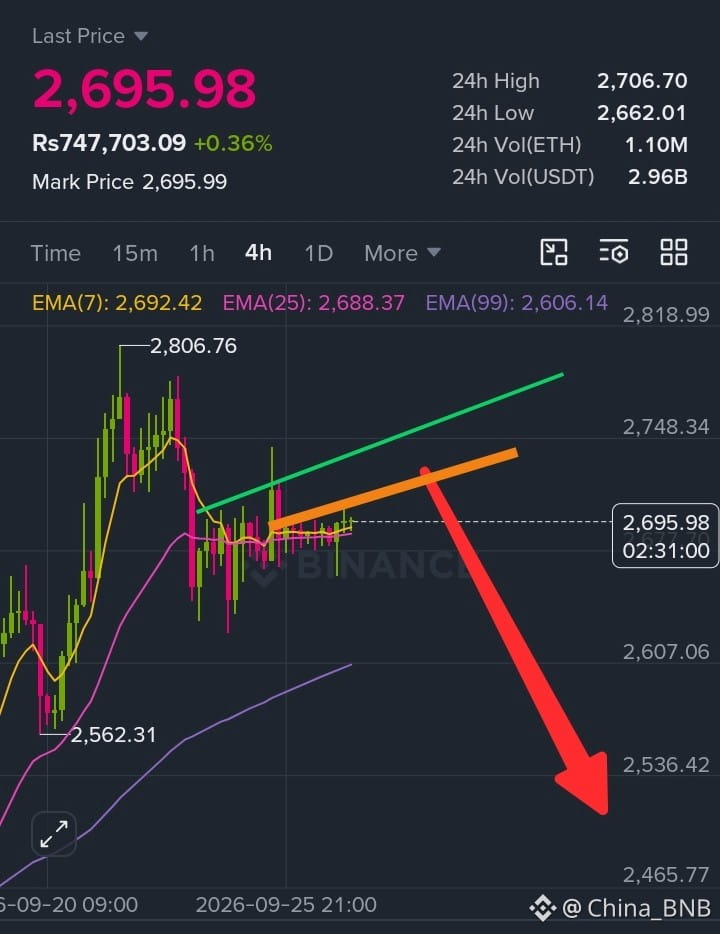
🔻 BTC Long-Liquidation Map — Below $84K
Current market data shows the key liquidity sitting below $84K, with the most important areas:
🔴 $82.0K–$83.0K — first liquidation zone
🔴 $80.0K–$82.0K — major liquidation zone
⚠️ Below $80K — deeper liquidation risk
🎯 Key technical level: ~$81.4K
🚨 Major breakdown area: ~$81K
Recent data reported roughly $1.3B of potential liquidation liquidity between $80K–$83K, while BTC's immediate technical support is around $83.8K.
Short-term read: If BTC loses $83.8K, the next area to watch is $82K–$83K. A sustained break toward $81K could expose the larger $80K–$82K liquidation pocket. A move below $84K has already produced significant long liquidations in recent sessions, including about $280M over four hours on Sep. 23.
These are liquidity zones, not exact liquidation prices; exact levels vary by exchange and leverage. �
coinmarketcap
#bitcoin #Liquidations #btc70k $BTC
🔻 BTC Long-Liquidation Map — Below $84K
Current market data shows the key liquidity sitting below $84K, with the most important areas:
🔴 $82.0K–$83.0K — first liquidation zone
🔴 $80.0K–$82.0K — major liquidation zone
⚠️ Below $80K — deeper liquidation risk
🎯 Key technical level: ~$81.4K
🚨 Major breakdown area: ~$81K
Recent data reported roughly $1.3B of potential liquidation liquidity between $80K–$83K, while BTC's immediate technical support is around $83.8K.
Short-term read: If BTC loses $83.8K, the next area to watch is $82K–$83K. A sustained break toward $81K could expose the larger $80K–$82K liquidation pocket. A move below $84K has already produced significant long liquidations in recent sessions, including about $280M over four hours on Sep. 23.
These are liquidity zones, not exact liquidation prices; exact levels vary by exchange and leverage. �
coinmarketcap
#bitcoin #Liquidations #btc70k $BTC
Current market data shows the key liquidity sitting below $84K, with the most important areas:
🔴 $82.0K–$83.0K — first liquidation zone
🔴 $80.0K–$82.0K — major liquidation zone
⚠️ Below $80K — deeper liquidation risk
🎯 Key technical level: ~$81.4K
🚨 Major breakdown area: ~$81K
Recent data reported roughly $1.3B of potential liquidation liquidity between $80K–$83K, while BTC's immediate technical support is around $83.8K.
Short-term read: If BTC loses $83.8K, the next area to watch is $82K–$83K. A sustained break toward $81K could expose the larger $80K–$82K liquidation pocket. A move below $84K has already produced significant long liquidations in recent sessions, including about $280M over four hours on Sep. 23.
These are liquidity zones, not exact liquidation prices; exact levels vary by exchange and leverage. �
coinmarketcap
#bitcoin #Liquidations #btc70k $BTC
2
232


·
--

Article
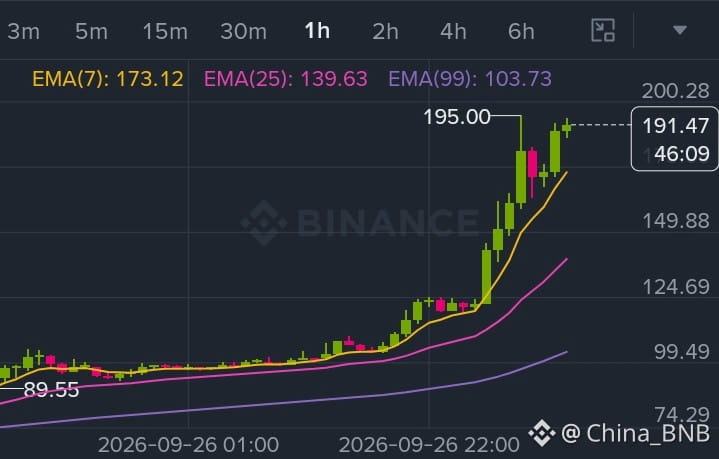
💥ZEC/USDT IS MOVING FAST — AND THE MARKET IS WATCHING! 🔥Zcash is suddenly back in the spotlight.
ZEC has delivered a powerful rally in September, with the price recently pushing toward the $1,600–$1,700 zone. On September 26, ZEC briefly reached around $1,684 on Binance spot, while heavy short liquidations added fuel to the move.
But here is the important part:
After a move this strong, volatility can become extreme.
ZEC is now trading in a market where buyers are showing strong momentum, but traders also need to watch whether the price can hold higher levels after the rally.
Institutional interest is another factor. Grayscale's Zcash ETF reportedly reached around $1 billion in assets under management, although much of that increase came from ZEC's rising price rather than new investor inflows.
For ZEC/USDT traders, the key things to watch are:
📌 $1,600–$1,700: Important recent price zone
📌 Trading volume: Confirmation of strength
📌 Liquidations: High leverage can create sudden moves
📌 Bitcoin direction: BTC can influence the wider crypto market
📌 Support: Losing important levels could trigger a sharp pullback
Zcash is proving that the privacy-coin sector can still attract serious market attention.
🔥 The momentum is strong. But after a huge rally, risk management matters even more.
Watch the chart.
Watch the volume.
Don't chase the candle.
ZEC/USDT is definitely one of the pairs to watch. 👀⚡
#ZEC #zcash $ZEC
{spot}(ZECUSDT)
💥ZEC/USDT IS MOVING FAST — AND THE MARKET IS WATCHING! 🔥
Zcash is suddenly back in the spotlight.
ZEC has delivered a powerful rally in September, with the price recently pushing toward the $1,600–$1,700 zone. On September 26, ZEC briefly reached around $1,684 on Binance spot, while heavy short liquidations added fuel to the move.
But here is the important part:
After a move this strong, volatility can become extreme.
ZEC is now trading in a market where buyers are showing strong momentum, but traders also need to watch whether the price can hold higher levels after the rally.
Institutional interest is another factor. Grayscale's Zcash ETF reportedly reached around $1 billion in assets under management, although much of that increase came from ZEC's rising price rather than new investor inflows.
For ZEC/USDT traders, the key things to watch are:
📌 $1,600–$1,700: Important recent price zone
📌 Trading volume: Confirmation of strength
📌 Liquidations: High leverage can create sudden moves
📌 Bitcoin direction: BTC can influence the wider crypto market
📌 Support: Losing important levels could trigger a sharp pullback
Zcash is proving that the privacy-coin sector can still attract serious market attention.
🔥 The momentum is strong. But after a huge rally, risk management matters even more.
Watch the chart.
Watch the volume.
Don't chase the candle.
ZEC/USDT is definitely one of the pairs to watch. 👀⚡
#ZEC #zcash $ZEC
ZEC has delivered a powerful rally in September, with the price recently pushing toward the $1,600–$1,700 zone. On September 26, ZEC briefly reached around $1,684 on Binance spot, while heavy short liquidations added fuel to the move.
But here is the important part:
After a move this strong, volatility can become extreme.
ZEC is now trading in a market where buyers are showing strong momentum, but traders also need to watch whether the price can hold higher levels after the rally.
Institutional interest is another factor. Grayscale's Zcash ETF reportedly reached around $1 billion in assets under management, although much of that increase came from ZEC's rising price rather than new investor inflows.
For ZEC/USDT traders, the key things to watch are:
📌 $1,600–$1,700: Important recent price zone
📌 Trading volume: Confirmation of strength
📌 Liquidations: High leverage can create sudden moves
📌 Bitcoin direction: BTC can influence the wider crypto market
📌 Support: Losing important levels could trigger a sharp pullback
Zcash is proving that the privacy-coin sector can still attract serious market attention.
🔥 The momentum is strong. But after a huge rally, risk management matters even more.
Watch the chart.
Watch the volume.
Don't chase the candle.
ZEC/USDT is definitely one of the pairs to watch. 👀⚡
#ZEC #zcash $ZEC
2
245
Log in to explore more content
Join global crypto users on Binance Square
⚡️ Get latest and useful information about crypto.
💬 Trusted by the world’s largest crypto exchange.
👍 Discover real insights from verified creators.
Email / Phone number