

The full text is relatively long and is divided into three parts. This article is the first part.
Chapter 1 NFT Ecology
NFT Overview


As we move into 2024, the NFT space will continue to grow, and we can see most of the application layers surrounding NFTs converging on the following points.
Metaverse Interoperability - In 2023, many brands and creators launched proprietary virtual worlds and NFTs, but they remained decentralized. By 2024, cross-platform ecosystems can enable unified digital identities and assets across different A metaverse that will drive virtual experiences that are transferable between worlds.
The evolution of gaming NFTs - While the "play to earn" model has come under fire in 2023, gaming NFTs will evolve into tools for creation, customization and governance, with user-generated gaming metaverses leveraging NFTs to prove ownership of digital assets .
Social Tokens - Social NFTs are rapidly emerging by allowing exclusive channels with creators, however, in 2024 we may see a shift away from NFT hype towards models of direct revenue sharing through tokens, such as Farcaster and DEGEN, this Tips It may provide creators with monetization methods in a more sustainable way.
The Evolution of NFTs: Key History and Milestones


Chapter 2 Market Overview
Market Cap and Volume - Signs of Recovery

According to the data, it is clear that both market capitalization and trading volume have declined compared to the previous year. Market capitalization experienced a major decline, falling by 41.79% to a low of 3.3 million ETH. The peak of trading activity occurred in February On the 20th, the day's trading volume soared to a yearly high of 240,000 ETH.
However, this momentum was not maintained throughout the year, with updates and releases such as the long-awaited game Legends of the Mara, new series Azuki Elementals and DeGods failing to live up to the community's expectations, resulting in a waning of market enthusiasm and, consequently, transaction volumes. Remaining sluggish through the middle of the year, there were nonetheless signs of a rebound starting in November.
Blue Chip Index – Sustained Blue Chip Advantage

Going into 2023, expectations for blue-chip NFTs had been adjusted by about 70%, with expectations overall suppressed. However, there were some lasting signs of resilience at the end of 2023, with the index rebounding from the bottom of 4,488 points in October 2023, and by the end of the year It recovered to 5,000 points, which may indicate that demand for high-quality collectibles still exists.
Looking ahead to 2024, there is a gathering that is leading the NFT bull market - Pudgy Penguins, and the market is likely to oscillate between speculation and accompanying temporary spikes in volatility.

A deeper look into NFT transaction volume in 2023 shows that blue-chip collectibles still dominate the market, with Bored Ape Yacht Club alone accounting for 10.45% of total transaction volume, with Mutant Ape Yacht Club and Azuki ranking second and third respectively.
The combined trading volume of the top 9 collectibles accounts for nearly 50% of the overall trading volume. Although new collectibles are emerging frequently, the data shows that the most trustworthy blue-chip NFTs still account for the majority of trading activity.
Category - PFP remains key to NFTs
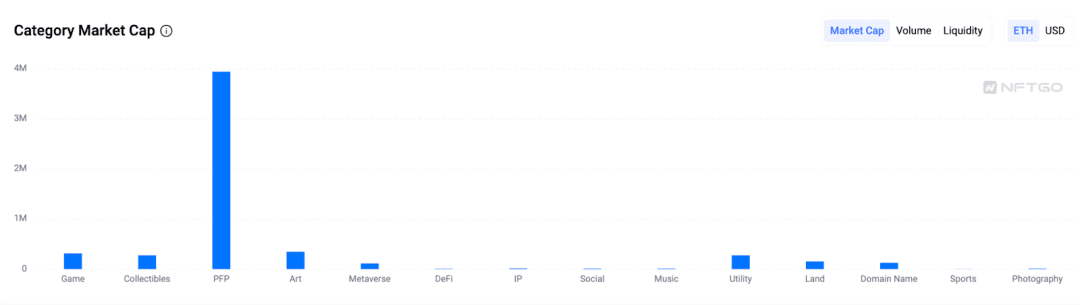
The chart shows that PFP is still the cornerstone of NFT applications, with a total market value of approximately 4 million ETH. In contrast, the art category exceeds games, collectibles and utility types and has risen in the NFT field, with a market value of nearly 500 million ETH. , this surge may be due to advances in AI that have greatly boosted the market, in addition to the fact that the domain name category has become more prominent in the NFT space since last year.
PFP will continue to be a cornerstone of the NFT industry, providing the foundation for various NFT collectibles to broaden their reach, with noteworthy developments including the launch of new games by Yuga Labs, innovative collectibles and elements from Azuki and DeGods, and Pudgy Penguins’ partnership with Walmart Cooperation and the integration of AI technology have injected new impetus into the industry, promoting the increase in video and generative art NFTs. Looking forward to 2024, we expect more innovative efforts to further activate the market.

The gaming category has the highest liquidity, rising by approximately 380%. The NFT issuance of classic games such as OVERWORLD INCARNA and Pixelmon has further activated the market. The art and land categories also have significant liquidity, both exceeding other categories by 200%.
Holders and traders - from volatile markets to calm markets

As 2023 comes to an end, the NFT market is less volatile than last year, with the first four months characterized by increased activity. Data from NFTGo shows that the overall market experienced a decline in 2023, with significantly fewer active traders than in 2022. A year-on-year decrease of 47.51%. Despite the decline in trading activity, the number of NFT holders has grown considerably, up 132.44% from last year, to a total of 6.42 million.

The data shows that the daily buyer to seller ratio in 2023 ranged from 0.52 to 1.02, with an overall average of 0.85, indicating a relatively balanced market between buyers and sellers, with September having the highest monthly average (0.92), boding well for the The upcoming "Uptober".
NFT Market - Blur vs. OpenSea, who wins?

In 2022, OpenSea dominated the market with 7.74 M ETH trading volume, 6x more than its next competitor, however, Blur, a new entrant after its launch in October 2022, saw traffic explode by December Exceeds OpenSea's daily trading volume.

This growth continued even more in 2023, with Blur accumulating a total trading volume of 4.33 M ETH, which is 2.5 times that of OpenSea's 1.7 M ETH. However, OpenSea maintained the lead in terms of sales volume, with 7.9 million, compared to Blur's 4.1 million, This implies a higher average transaction value on Blur.
In the past month, Blur had 292,000 active traders, including 187,000 buyers and 210,000 sellers. The total number of traders on OpenSea was 642,000 buyers and 719,000 sellers, but Blur will attract more high-value whales trader.

Key factors for Blur’s growth include its features like zero platform fees, token incentives, and bulk purchases for professional traders, who will gravitate toward markets with features like multi-chain trading, maximum liquidity, security, and more.
Solana and BTC – Markets on the rise in 2024
Overall trading volume and number of traders have grown significantly over the year, indicating growing interest in Solana NFTs, with total weekly trading volume across both markets growing from approximately $1.5 million in early January to over $1.1 million in late December , the number of weekly active traders increased from approximately 80,000 to over 110,000 over the same period.

The number of unique collectibles traded weekly increased from around 5,000 in January to over 15k in December, demonstrating the growing diversity of NFTs being traded on Solana.

The number of active NFT traders on Solana surged in 2023, with the total number of weekly traders on Magic Eden and TensorSwap rising threefold from January to over 100,000 in December.
The average weekly transaction size has declined over the year, from about $850 in January to $550 in December, with Magic Eden’s average transaction size consistently being larger than TensorSwap’s.

Magic Eden accounts for the majority of trading volume and traders. Although TensorSwap grew in the fourth quarter of 2023, Magic Eden's total weekly trading volume fell from 90% in the first quarter to 60% in the fourth quarter. TensorSwap's share increased from 10% to 40%, indicating that competition between the two markets is becoming increasingly fierce.

In 2023, Ordinals disrupted the industry with its innovative inscription concept, attracting the attention of all investors, and as of January 2024, the total number of inscriptions exceeded 56 million.
As shown above, from April to September 2023, the chart shows a period of significant growth as most markets begin to support Ordinals and BRC20, despite a temporary decline in daily inscription numbers in October, the launch of UniSat's Brc20-swap, etc. A series of positive market conditions have contributed to the recovery.

Initially, Ordinals were mainly used for images, however, as the market developed and BRC-20 was introduced, the lack of file format restrictions in Ordinals made it possible to embed JSON files (mainly text format) into BTC.
With the help of Indexer, BRC-20 can replicate functions similar to ERC-20, including minting and asset transfers. This development has made text the most popular type in Ordinals, accounting for nearly 90% of the daily inscription volume, worth Note that the number of textual inscriptions exceeds 400,000.

The development of the market has been closely tied to the progress of Ordinals, with UniSat marking an important milestone in this development, and over time, major exchanges such as OKX, Huobi and Binance began to list ORDI Tokens have significantly increased transaction volume.
OKX has dominated a significant portion of the market's trading volume since November, having executed over $1.8 billion in trades as of January 2024, highlighting Ordinals' strong growth and increasing market acceptance .
NFT/ETH Ratio - NFT Market Shows Unique Resilience

Ethereum has been at all-time lows since the beginning of 2023, and the floor price of NFTs has also remained at a relatively low level. It is worth noting that the ratio peaked in February, coinciding with Ethereum’s lowest price of $1,429 during the year. .
This shows that despite the overall correlation between the NFT market and the Ethereum market, the NFT space exhibits its own unique stability.
Throughout 2023, the NFT/ETH market cap ratio has trended downward, from around 0.06 to below 0.04.

In short, the correlation coefficient of the two markets is about 0.6 in 2023, with lower correlation occurring in Q1 and Q2 - when the Ethereum market is in a downturn, in Q3 and Q4 of 2023, the correlation coefficient remains stable, higher than 0.8, indicating that NFTs also tend to show stronger trading volumes in the more active Ethereum market.
NFTFi Trends - DeGods and MAYC Most Stable

Weekly NFT deposits averaged around 3,500 in 2023, reaching over 5,000 at times, with the top 10 collectibles accounting for an average of 30-40% of deposits, with DeGods and Mutant Ape Yacht Club being the most stable deposit collections throughout 2023. Azuki is also in the top five most weeks.

Deposits surged in late June due to increased volatility in the crypto market, and if growth continues at the pace of 2023, we can expect average weekly deposits in the 4,000-5,000 range in 2024, with some potential peaks of up to With 6,000+ deposits, blue chip NFTs should continue to be the first choice for deposits.
SocialFi trends – stabilizing after the limelight

Transaction volume data for 2023 shows that there is an active and growing ecosystem on multiple platforms, with transaction volume throughout the day fluctuating between 10,000 and 200,000 in a year, with the highest volume occurring in September, with Friendzy, StarArena and Hub3 activity drove transaction volume growth.
While platforms like Friend.tech and Post have relatively stable weekly trading levels, newer entrants like Hub3 and StarArena are experiencing more volatility due to increased adoption.

In terms of trends in 2024, we expect transaction volumes to continue to grow incrementally across existing and emerging platforms, and as the space matures we expect SocialFi platforms to see 10-25% growth at annual transaction levels .
OpenSea content you care about
Explore | Collect | Sell | Buy

Favorite and follow OpenSea Binance Channel
Stay up to date with the latest information

