I believe I can move forward steadily on this challenging path of trading, and the key lies in always maintaining a focused learning attitude. I not only delve deeply into the fundamentals, striving for a thorough understanding; I also meticulously analyze news factors, capturing every possible dynamic that may influence the market; at the same time, I conduct in-depth research on various technical indicators, exploring the patterns and signals within them. Ultimately, I successfully built a trading system that allows me to achieve stable profits!
More time is spent fishing and exercising. From 50,000 entering the crypto world to making 10 million, then to being 8 million in debt, then to earning 20 million, and now to financial freedom.
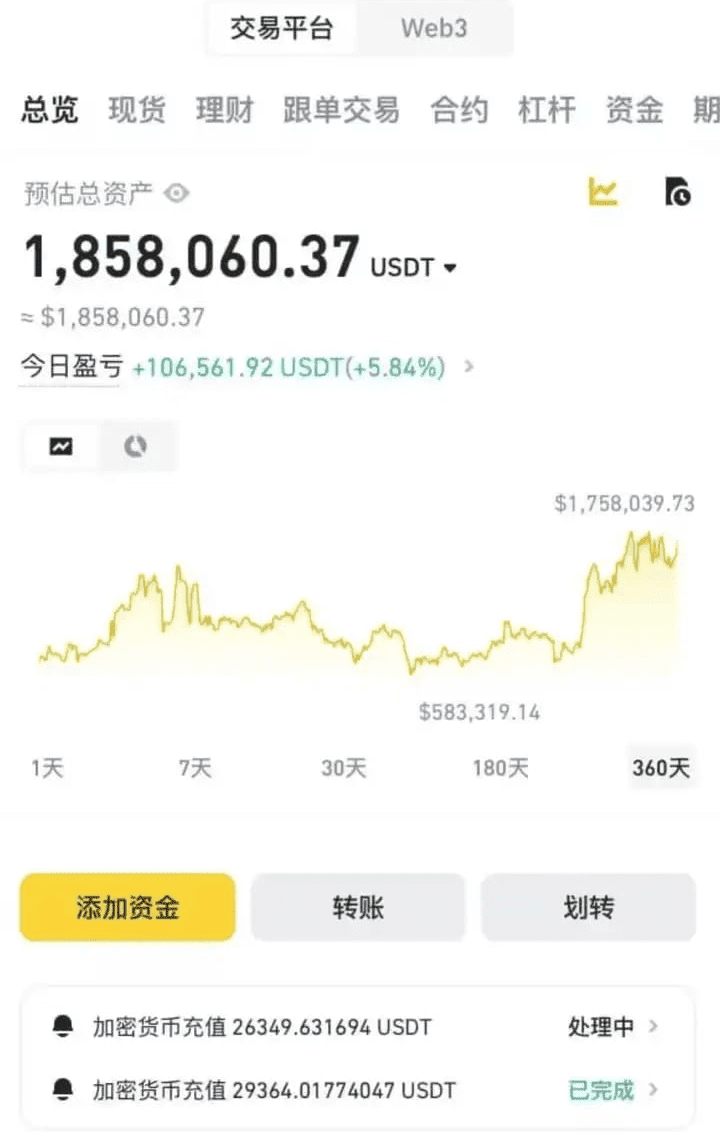
There is a foolproof method for trading coins that keeps you 'ever profitable', with a target of 30 million!
I still use this method until now, it is high and very stable.
Don't worry about whether you can learn; if I can seize this opportunity, so can you. I'm not a god, just an ordinary person. The only difference is that others have overlooked this method. If you can learn this method and prioritize it in your future trading, it can help you earn an extra 3 to 10 points daily.
First Step: Add coins that have increased in price over the last 11 days to your favorites, but note that coins that have dropped for more than three days should be excluded to avoid capital already profiting and escaping.
Step 2: Open the candlestick chart and only look at the MACD golden cross of individual coins at the monthly level.
Step 3: Open the daily candlestick chart, where only look at the 60 moving average. As long as the coin price pulls back near the 60 moving average and a volume candlestick appears, make a heavy entry.
Step 4: After entering the market, use the 60 moving average as a standard; if above, hold; if below, exit and sell. It is divided into three details overall.
1: When the wave increase exceeds 30%, sell one-third.
2: When the price increase of a wave exceeds 50%, sell one-third.
3: This is the most important and core factor determining your profitability. If you buy on the same day and unexpected situations arise the next day, and the price directly breaks below the 60-day moving average, you must exit entirely. Do not harbor any lucky thoughts. Although the probability of breaking below the 60-day moving average through this monthly and daily selection method is very low, we still need to have risk awareness. In the cryptocurrency market, preserving the principal is the most important thing. However, even if you have sold, you can wait until it meets the buying conditions again to buy back.
Ultimately, the difficulty in making money lies not in the method but in execution. 'When the coin price directly breaks below the 60-day moving average, you must exit entirely. Do not harbor any lucky thoughts.' This single sentence has killed 90% of people.
Everyone's original intention for coming to the cryptocurrency market is the same, without a doubt. If you are just here to play around and kill time, then this place is not suitable for you.
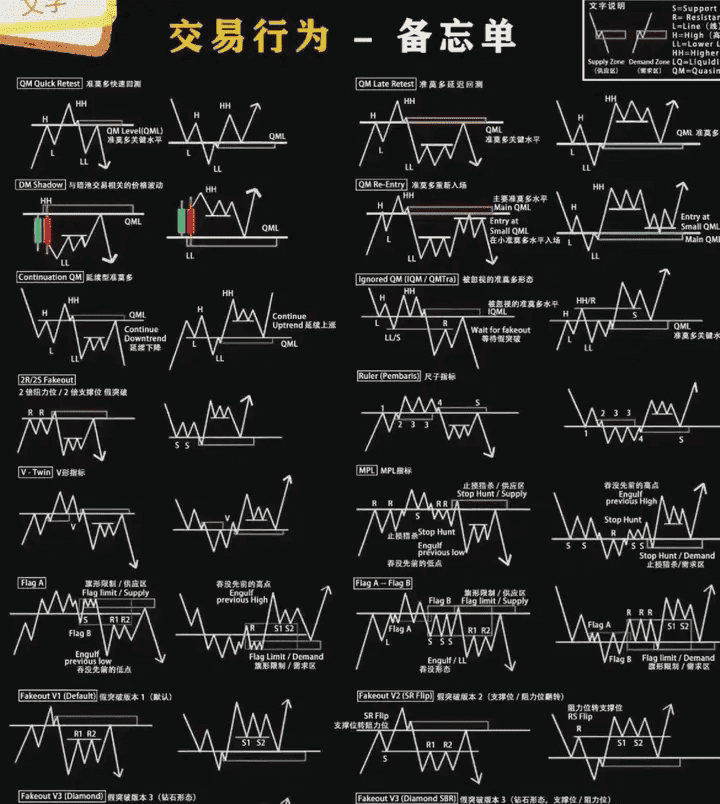
Below is a compilation of trading behaviors; understanding this chart can increase your win rate to 90%.
1. Basic Principles of Investment
Don't trade without looking at the charts: Never trade in the cryptocurrency market without reviewing the price charts.
Avoid chasing highs on good news: Never buy when positive news is released, especially when the price of the coin has already shown a significant increase before the news is released.
Don't buy into plummeting coins: Never buy when the coin price is crashing just because you think it's cheap. Under continuous selling pressure, the price often goes lower.
Stay away from downtrends: Never buy during a downtrend, no matter how low the 'valuation' seems. When the price continues to drop, you'll understand the reason behind the decline.
Maintain trading consistency: Always adhere to the principle of consistent trading. If you buy and sell in the same situation, your trading discipline has significant issues.
Revealing how cryptocurrency experts use six iron rules to achieve financial freedom easily!
If you want to make money in the cryptocurrency market, you must remember these six rules:
1. You should divide your money into five parts and only use one-fifth each time for trading. If you lose 10 points, exit immediately. That way, even if you lose five times in a row, you would only lose one-tenth of your total amount, which won't be devastating.
2. You must follow the market; don't go against the trend. When the market is down, a rebound may be a trap; when the market is up, a pullback may be a good opportunity to profit.
3. Never chase coins that have already surged; they are too high and could fall at any moment.
4. You must learn to observe the MACD indicator; it can help you find the best entry timing. When the DIF and DEA lines cross below the zero axis and then rise above it, that's a good buying opportunity. If they cross above the zero axis and then decline, that's a selling signal.
5. Remember, never average down when losing money; add to your position when making money. You must consider volume-price relationships. If the price surges when low, it may rise; if it fails to rise when high, be quick to exit. When selecting coins, choose those with good trends and value.
6. Review your trades weekly; see what you did well and what you did poorly, and adjust your strategy in a timely manner.
These six rules are all lessons learned from my blood; if you follow them, you will definitely thrive in the cryptocurrency market!
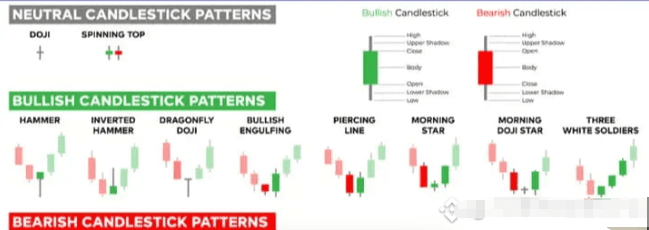
Cryptocurrency traders must understand and master the 16 essential candlestick patterns and price forms that even beginners can quickly grasp. Simplicity is key; the simpler something is, the more useful it is.
Purely practical sharing
Candlestick charts originated from Japan's 18th century book (the Sakata Method), authored by Homma Kiouson. The book mainly records the strategies he used while trading in the rice market, where the graphical representation of prices gradually evolved into candlesticks. Candlesticks are also known in Japan as kei lines, and later transliterated into K lines by Westerners, developing from there.
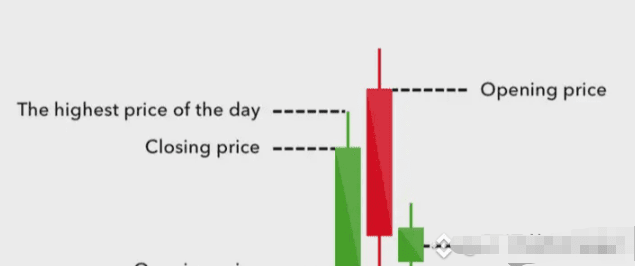
Each daily candlestick requires four prices: opening price, closing price, highest price, and lowest price.
The thin line at the top of the candlestick is called the upper shadow, the thick line in the middle is the body. The thin line below is the lower shadow. When the closing price is higher than the opening price, indicating an upward trend, we call this candlestick a bullish line, usually represented in red. At this time, the length of the upper shadow indicates the price difference between the highest and closing prices, the length of the body represents the price difference between closing and opening prices, and the length of the lower shadow indicates the price difference between the opening price and the lowest price.
Below are 16 candlestick patterns and their price forms that are essential for trading:
Candlestick charts are used to predict future price movements. Below are 16 common candlestick patterns and how to use them to find trading opportunities.
Candlestick charts have three basic functions: 1. The body of the candlestick represents the opening/closing price range. 2. The wick or shadow indicates the intraday high and low. 3. The color of the candlestick reveals the direction of market movement - a green body indicates a price increase, while a red body indicates a price decrease.
As prices change, various candlesticks form patterns that traders can use to identify key support and resistance levels. There are many candlestick patterns, which imply trading opportunities in the market - reversals of price movements or continuations of price movements, or indecision in the market. Before starting to trade, it is crucial to understand the basic knowledge of candlestick charts and use their patterns to identify trading opportunities, providing the basis for trading.
Practice interpreting candlestick charts: While candlestick charts and price patterns are suitable for quickly predicting trends, we should also integrate them with other forms of technical analysis to confirm overall trends.
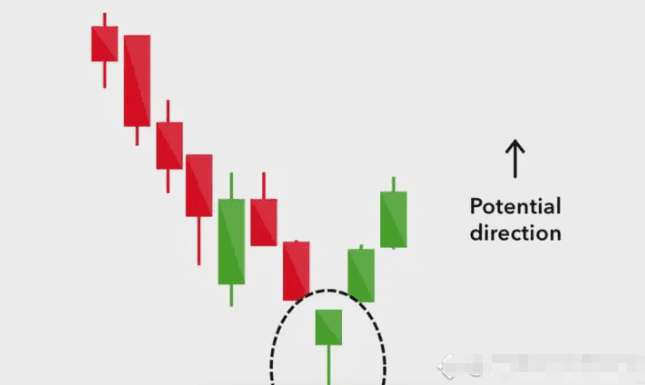
Six Bullish Candlestick Patterns: These patterns may form after a downtrend and indicate that the price trend has reversed. They serve as indicators for traders considering establishing long positions.
Hammer Candlestick Pattern: The hammer candlestick pattern consists of a short body and a long lower shadow, located at the bottom of a downtrend. A hammer indicates that despite selling pressure, strong buying power ultimately drives the price back up. The color of the hammer can vary, but a green hammer indicates stronger buying power than a red one.
Inverted Hammer Pattern
The same bullish pattern is the inverted hammer. The only difference is that the upper shadow is long while the lower shadow is short. This indicates buying pressure followed by selling pressure, which is insufficient to push down the market price. The inverted hammer indicates that buyers will soon take control of the market.
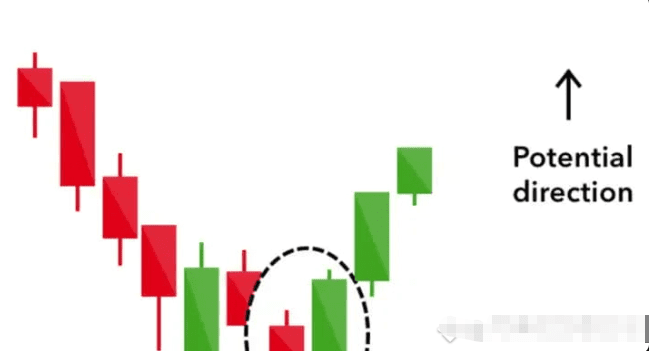
Bullish Engulfing Pattern
The bullish engulfing pattern consists of two candlesticks. The first candlestick is a short red object, which is entirely engulfed by a larger green candlestick.
The opening price on the second day is lower than the first day's, but the bullish market drives the price up, ultimately attracting more buyers.
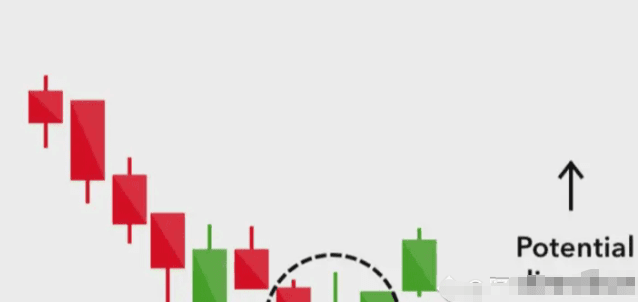
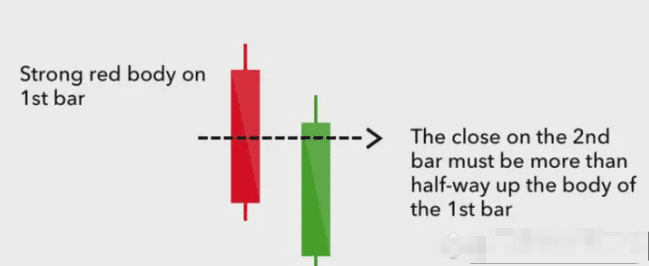
Piercing Line
The piercing line also consists of two long candlesticks, one long red candlestick followed by a long green candlestick. Generally, there will be a significant gap between the closing price of the first candlestick and the opening price of the green candlestick. This indicates significant buying pressure as the price is pushed up to the previous day's midpoint or even higher.
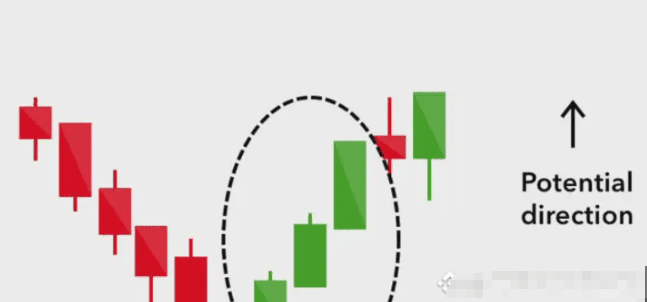
Morning Star Pattern
The morning star pattern is considered a sign of hope in a downtrend. It consists of three candlesticks: a long candlestick situated between a long red and a long green one. Generally, the 'star' does not overlap with longer candlesticks because there are gaps in the market at both opening and closing. This indicates that selling pressure from the first day is weakening, and a bull market is about to arrive.
Three White Soldiers
Three White Soldiers consists of three consecutive long green candlesticks (with upper shadows), with their opening and closing positions gradually higher than the previous day. This is a strong bullish signal, appearing after a downtrend, indicating steadily rising buying pressure.
Six Bearish Candlestick Patterns
Bearish candlestick patterns often form after an uptrend, signaling resistance points. Severe pessimism towards market prices often leads traders to liquidate their long positions and open short positions to capitalize on the price decline.
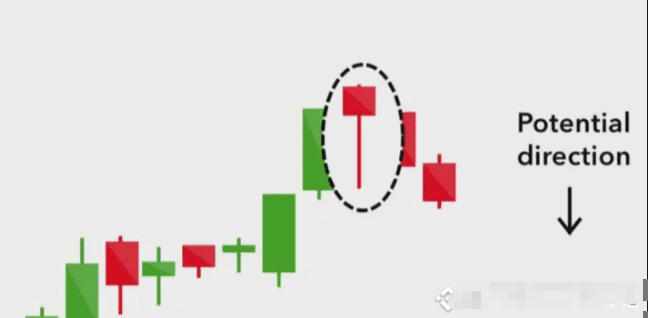
Hanging Man Pattern - The Hanging Man is a bearish pattern equivalent to the hammer pattern. It has the same shape but forms at the end of an uptrend. This indicates significant selling but buyers are able to push the price up again. Significant selling is often seen as a sign that the bulls are losing control of the market.
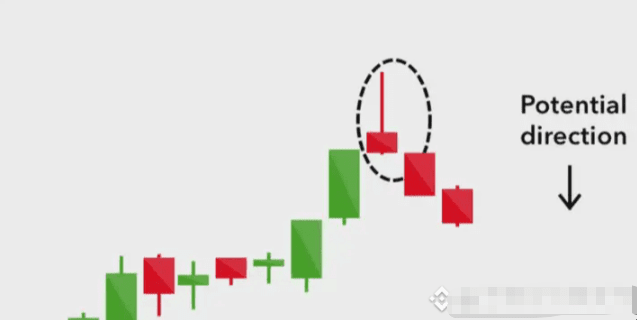
Shooting Star
The shape of a shooting star is similar to an inverted hammer, but it is in an upward trend: its lower body is small while the upper shadow is long. Generally, the market opens with a large gap, then rebounds to the intraday high, closing at a price above the closing price, like a star falling to the ground.
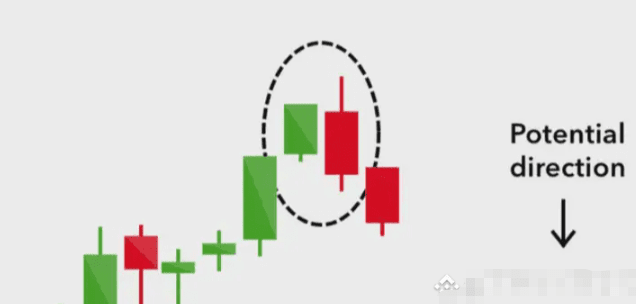
Bearish Engulfing Pattern
The bearish engulfing pattern occurs at the end of an uptrend. The first candlestick has a small green body, which is then engulfed by a long red candlestick. This indicates that price volatility has peaked or slowed down, suggesting an impending market downturn. The lower the second candlestick closes, the more pronounced the trend may be.
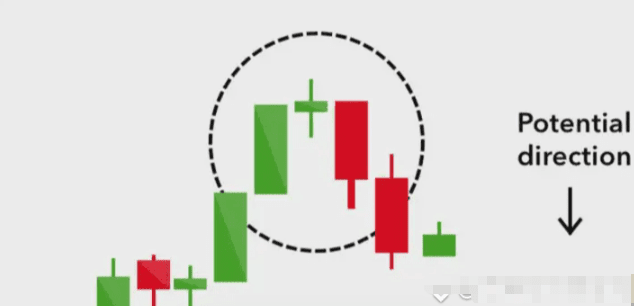
Evening Star
Evening Star is a pattern consisting of three candlesticks, equivalent to the bullish morning star. It consists of a short candlestick, a long green candlestick, and a large red candlestick in between. The appearance of this pattern often indicates a reversal of an upward trend. When the closing price of the third candlestick is below the opening price of the first candlestick, it shows that the bearish trend is evident.
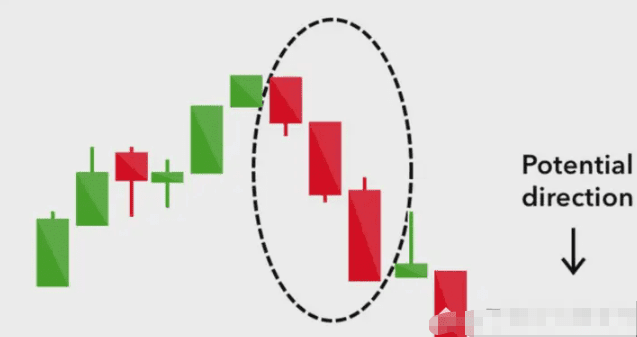
Three Black Crows
Three Black Crows - The Three Black Crows pattern consists of three consecutive long red candlesticks with short or nonexistent shadows. The opening price is close to the previous candlestick's opening price, but the closing price continues to fall under selling pressure. Traders interpret this pattern as the beginning of a downtrend, as sellers have outnumbered buyers over three consecutive trading days.
Dark Cloud Cover
The dark cloud cover pattern indicates a bearish reversal. It consists of two candlesticks: a red candlestick that opens above the previous green body and closes at the midpoint. This indicates that the bears have taken control of intraday trading, leading to a sharp decline in price. If the candlestick's shadow is short, it shows that the downtrend has decisive influence.
Four Continuation Candlestick Patterns
If the candlestick pattern cannot indicate a change in market trend, we call it a continuation pattern. These can help traders determine resting periods in the market when indecision prevails.
Doji Star - When the market's opening and closing prices are very close, forming a candlestick pattern resembling a cross or a plus sign, this type of Doji indicates a struggle between bulls and bears, with neither side gaining any advantage. A standalone Doji is a neutral signal but can be found in trend reversal patterns, such as a bullish morning star and a bearish evening star.
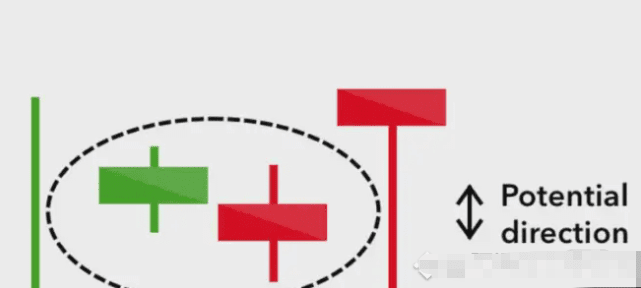
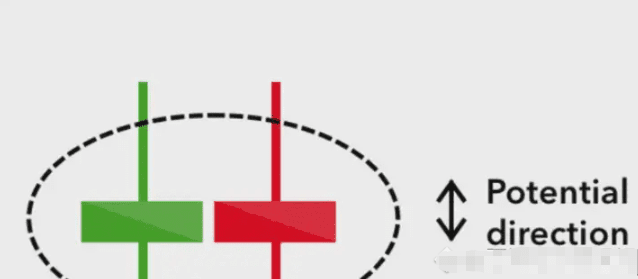
Spinning Top
The spinning top candlestick pattern has a short body with the body placed between the upper and lower shadows. This pattern indicates market indecision, resulting in minimal price changes: bulls push the price up, while bears push it down again. The spinning top pattern is generally interpreted as a continuation pattern of either an uptrend or downtrend. In itself, the spinning top is a relatively mild signal, but it can be interpreted as a sign of what’s to come, as it indicates that current market pressure is losing control.
Falling Three Methods Pattern
The three methods pattern is used to predict the sustainability of the current trend, whether bearish or bullish. The bearish pattern is called 'Falling Three Methods.' It consists of a long red candlestick followed by three small green candlesticks and another red candlestick, where the green candlesticks are all contained within the bearish candlestick's range. This indicates that the bulls are insufficient to reverse the trend.
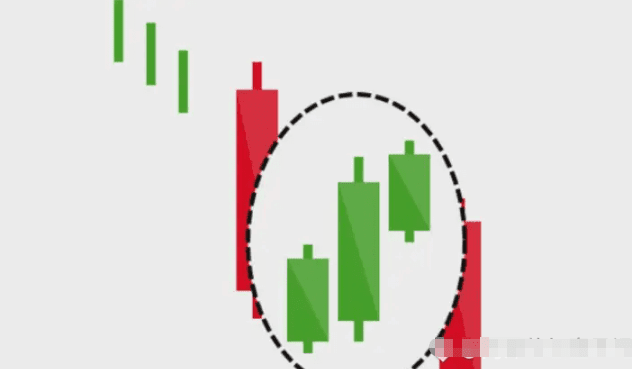
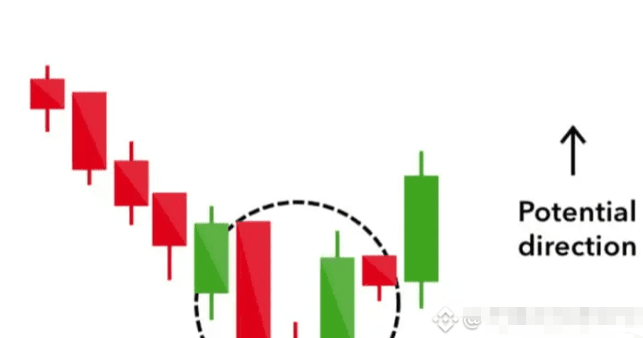
Rising Three Methods Pattern
For bullish patterns, the 'Rising Three Methods' candlestick pattern is the opposite. It consists of three shorter red candlesticks sandwiched between two longer green ones. This pattern conveys to traders that despite some selling pressure, buyers are still controlling the market.
Candlestick charts show the changes in market prices over specific periods and are important tools for entering cryptocurrency trading. Below are some basic guidelines to help you understand candlestick charts.
1. Bullish Candlestick Patterns
1. Hammer - The hammer is located at the bottom of a downtrend, with a long lower shadow at least twice the body. It indicates that despite significant selling pressure, buyers push the price back close to the opening level. A green hammer is a stronger bullish signal than a red one.
2. Inverted Hammer - The inverted hammer pattern is similar to the hammer pattern, but the long shadow is above the body. It usually appears at the bottom of a downtrend, indicating upward potential. Even if sellers pull it down to the opening level, the price does not continue to fall, suggesting that the market may turn bullish.
3. Three White Soldiers - The Three White Soldiers pattern consists of three consecutive green candlesticks where the opening price is within the range of the previous candlestick’s body, and the closing price exceeds the highest point of the previous candlestick. A short lower shadow indicates persistent buying pressure.
4. Bullish Engulfing - The bullish engulfing pattern consists of a longer red candlestick followed by a shorter green candlestick, where the green candlestick is completely within the body of the red candlestick, indicating that the bearish trend is slowing or about to end.
2. Bearish Candlestick Patterns
1. Hanging Man
The Hanging Man is similar to the hammer pattern but appears at the end of an uptrend, indicating that despite buyers pushing the price up, large-scale selling suggests that the market may soon turn bearish.
2. Shooting Star
The shooting star line is a candlestick with a long upper shadow, a short body close to the bottom, usually appearing at the end of an uptrend, indicating that after the market reaches a high, sellers dominate and drive the price down.
3. Three Crows
Three Crows consists of three consecutive red candlesticks, with the opening price within the range of the previous candlestick's body, and the closing price below the previous candlestick's lowest point, indicating that selling pressure continues to drive the price down.
4. Bearish Engulfing Pattern
The bearish engulfing pattern consists of a longer green candlestick followed by a shorter red candlestick, where the red candlestick is entirely within the body of the green candlestick, indicating that buying pressure is weakening.
5. Dark Cloud Cover
Dark Cloud Cover consists of a green candlestick followed by a red candlestick, where the opening price of the red candlestick is higher than the closing price of the previous green candlestick, but the closing price is below the midpoint of the green candlestick, typically accompanied by high trading volume, indicating a change from an uptrend to a downtrend.
Three, Three Types of Consolidation Candlestick Patterns
1. Rising Three Methods
The Rising Three Methods pattern is commonly found in uptrends, consisting of three shorter red candlesticks followed by a continuing up green candlestick, indicating that the market will turn bullish again. This pattern signals that the market will continue to rise after a brief adjustment, serving as a buy signal.
2. Falling Three Methods
In contrast to the rising three methods, the falling three methods pattern indicates that the market will continue to fall. This pattern consists of three shorter green candlesticks followed by a continuing down red candlestick, signaling that the market will continue to fall after a brief adjustment.
3. Doji Star
When the opening and closing prices are the same or very close, a Doji pattern forms, indicating that the forces between buyers and sellers are undecided. Doji can be classified into the following categories:
Gravestone Doji: Indicates a bearish reversal, with a long upper shadow and opening/closing prices close to the low.
Long-legged Doji: Indicates indecision, with both upper and lower shadows, opening/closing prices near the midpoint of the body.
Dragonfly Doji: Indicates a bullish or bearish market, with a long lower shadow and opening/closing prices close to the highest point.
Four, How to Use Candlestick Charts in Bitcoin Trading
1. Learn the basics
Cryptocurrency traders should deeply learn the basics of candlestick charts, including understanding how to read candlestick charts and recognize different candlestick patterns. Understanding different candlestick patterns and their meanings is the foundation for technical analysis.
2. Combine multiple indicators
Combine candlestick patterns with other technical indicators, such as moving averages, RSI, and exponential smoothing moving averages, to gain a more comprehensive prediction. Using multiple technical indicators can improve prediction accuracy.
3. Use multiple time frames
Analyze candlestick patterns across multiple time frames to gain a comprehensive understanding of market sentiment. For instance, when analyzing daily charts, also pay attention to hourly and 15-minute charts. Analyzing multiple time frames can help traders better grasp short-term and long-term market trends.
4. Practice Risk Management Techniques
Using candlestick patterns carries risks; traders should practice risk management techniques, such as setting stop-loss orders to protect capital and avoid overtrading. Proper risk management can help traders reduce losses and improve trading success rates.
Candlestick patterns are a way to observe market trends and can help traders identify potential opportunities. Combine with market environment and technical analysis indicators, such as trend lines, RSI, stochastics, Ichimoku chart, and parabolic SAR for analysis. Support and resistance levels are also important components of candlestick chart analysis, with support being an anticipated strong demand price level and resistance being an anticipated strong supply price level.
Five, Practical Tips
1. Trend Confirmation
Use candlestick patterns to confirm market trends. For example, the continuous occurrence of the Three White Soldiers pattern can confirm an uptrend, while the Three Crows pattern can confirm a downtrend. Trend confirmation is an important step in formulating trading strategies.
2. Combine with trading volume
Combine volume analysis with candlestick patterns. Changes in trading volume can provide additional market sentiment information; for example, in the Three Methods pattern, if volume increases with each green candlestick, it indicates strong buying intent.
3. Backtest Strategies
Before applying candlestick patterns in real trading, you can backtest the trading strategy using historical data. Backtesting allows you to evaluate the effectiveness and stability of the strategy, thereby increasing the success rate of trades.
4. Maintain Discipline
In trading, strictly follow the strategies and risk management measures you have set. Avoid emotional trading; maintaining calmness and discipline is a key factor for successful trading.
By studying and practicing in depth, beginners can gradually master the analysis skills of Bitcoin candlestick charts, improving their decision-making ability and profit level in the cryptocurrency market.
15 Essential Rules for Survival in the Cryptocurrency Market!
First Rule: Preserve your principal to survive in the market for the long term.
The principal is a lifeline that must be firmly guarded! Many people ignore risks in pursuit of high returns, only to suffer heavy losses in the end.
Second Rule: As long as you are not greedy, making a profit is actually quite simple.
Maintain a stable mindset; earning a little less can actually make it easier to accumulate wealth.
Third Rule: Focus investments; don’t go all-in, and trade with the trend.
Don't blindly diversify investments; avoid putting all your money in, and adjust strategies based on market trends.
Fourth Rule: Avoid heavy positions, don't stubbornly hold on, and trade less.
Control your position; don't stubbornly hold on to losses, and trade moderately.
Fifth Rule: Enter calmly, exit decisively, and stop-loss resolutely.
Do not rush to buy; when selling, be decisive, set stop-loss lines, and strictly enforce them.
Sixth Rule: The market's profits are limitless, but losses can be bottomless.
Don't be greedy with money that can't be earned endlessly, but losses can deplete everything.
Seventh Rule: Once a stop-loss is triggered, exit immediately.
Stop-loss is a protection for your account and should not be hesitated.
Eighth Rule: For long or short positions, securing profits is the most stable strategy.
Whether doing long-term or short-term trading, the ultimate goal is to ensure profits are secured.
Ninth Rule: The unchanging truth of the market is that extremes must reverse.
Regardless of rise or fall, there is a limit, and it must reverse.
Tenth Rule: If there is no opportunity, do not trade; missing out is not terrible.
Don't force yourself to seize opportunities every time; being able to grab a portion is enough.
Eleventh Rule: Waiting for the right opportunity is more important than acting blindly.
Don't rush to find trading opportunities; patiently wait for more favorable conditions.
Twelfth Rule: Stop trading after reaching your target, and conserve your energy.
Don't be greedy; exit timely after completing your daily goals to conserve energy for the next trade.
Thirteenth Rule: Stop-loss is self-set, and profit comes from the market's grace.
Stop-loss is the investor's responsibility, while profit is the market's reward.
Fourteenth Rule: Wealth comes from waiting, not from frequent trading.
The best investments are often gained through patient waiting rather than constant trading.
Fifteenth Rule: When your mindset is fragile, strictly executing the strategy is most important.
Desire can easily get out of control in trading; only by strictly executing strategies can you achieve a unity of knowledge and action.
I am A Xin; if you don't know what to do in a bull market, click on my profile, follow me for bull market spot planning, contract passwords, and free sharing.

