After 10 years of trading cryptocurrencies, I have turned my savings of 68,000 into over 80 million, only trading spot and not engaging in contracts. Although I haven't achieved the small goals that some people do with 10,000, I am very content and feel secure, dreaming that my account will exceed 100 million by the end of this year, allowing me to have more capital to earn more money next year.
The mindset of trading cryptocurrencies must be good. Don't let your blood pressure spike during a big drop, and don't get carried away during a big rise. It's important to secure your profits. When I first started trading, I was often worried and couldn't sleep well, frequently waking up at night. Now I am much more calm.
Ultimately, the difficulty in making money lies not in the techniques, but in adhering to my own set of secrets. Just this alone excludes 70% of people.
K-line patterns that cryptocurrency players must know!
1. T-line (dragonfly).
· Application Rules:
Bottom bullish, top bearish reversal line.
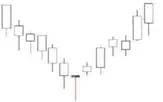
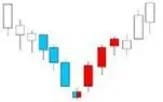
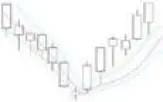
2. V-shaped reversal.
· Application Rules:
The bottom has been reached, and it is reversing upwards.
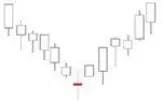
3. Long upper shadow.
Application Rules:
1. Long upper shadows appearing at high points of uptrends, if trading volume increases, indicate the bulls are aggressively chasing higher, but heavy selling pressure at high points makes it difficult for the stock price to rise, and the market is likely to reverse or pull back.
2. Long upper shadows appearing at low points of downtrends, if trading volume increases, indicate bullish bottom-fishing, but cannot effectively curb selling pressure, leading to a gradual shift towards a balanced state between bulls and bears.
4. Long doji.
· Application Rules:
1. The doji may form an important warning signal. The original trend may pause or reverse.
2. A doji only has significant meaning under the condition that it does not often occur in a market.
3. If it has a long upper shadow or a long lower shadow, it further indicates that the market is hesitant, and a typical doji has greater predictive significance for the original trend's pause or reversal. The bottom has been reached, and it is reversing upwards.
5. Long lower shadow.
· Application Rules:
1. Long lower shadows appearing at high points of uptrends, if trading volume increases, indicate heavier selling pressure, active buying, but there is a sense of exhaustion among the bulls.
2. Long lower shadows appearing at low points of downtrends, if trading volume increases, indicate a panic sell-off, but active buying at low points, with a large amount of bullish bottom-fishing.
6. Water Lily.
· Application Rules:
A large bullish line crosses three moving averages, changing the moving averages to a bullish arrangement, and the trend looks bullish.
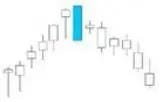
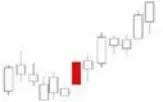
7. Large bullish line.
· Application Rules:
1. A large bullish line appearing in an uptrend indicates that the market is dramatically rising.
2. A large bullish line appearing in a downtrend indicates that the market is dramatically rebounding.
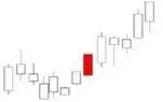
8. Large bearish line.
· Application Rules:
1. A large bearish line appearing in an uptrend indicates that the market has deeply pulled back.
2. A large bearish line appearing in a downtrend indicates that the market has accelerated downwards.
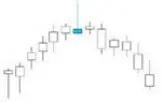
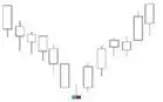
9. Inverted V-shaped reversal.
· Application Rules:
Reversal pattern, the trend looks bearish.
10. Inverted hammer.
· Application Rules:
If the inverted hammer appears after a downtrend, it constitutes a bullish candlestick pattern. This is the same as the ordinary hammer line. When analyzing the inverted hammer line, one very important point is: after the inverted hammer line appears, one must wait for the next time unit’s bullish signal to verify it. The verification signal for the inverted hammer may take the following form: the next day’s opening price gaps up, exceeding the body of the inverted hammer. The larger the gap up distance, the stronger the verification signal. It may also take another form: the next day is a white candlestick, and its price is at a higher level, thus completing the bullish verification signal.
11. Hanging man.
· Application Rules:
1. If the hanging man appears after an uptrend, it constitutes a bearish candlestick pattern.
2. When analyzing the hanging man, one very important point is: after the hanging man appears, one must wait for the bearish signal of the next time unit to verify it. The verification signal for the hanging man could take the following form: the larger the gap down from the opening price the next day, the stronger the verification signal.
3. It may also take another form: if the next day is a black candlestick and its closing price is below the body of the hanging man, it completes the bearish verification signal.
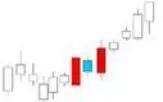
12. Stacked Bullish Cannon
· Application Rules:
Overlapping bullish cannon, the trend looks extremely bullish.
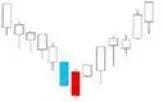
13. Stacked Bearish Cannon.
· Application Rules:
The repetition of bearish cannon indicates a high possibility of short-term downtrend.
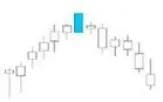
14. Top Doji.
· Application Rules:
Short-term topping, the trend looks bearish.
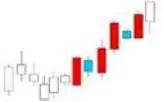
15. East Red Large Bullish Rise.
· Application Rules:
Continuous bullish lines, if combined with a moving average golden cross, will look bullish.
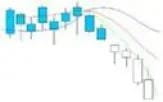
16. Guillotine.
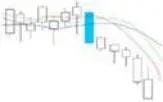
· Application Rules:
A large bearish line cut through three moving averages, changing the arrangement of the moving averages to a bearish arrangement, and the trend looks bearish.
17. Bullish Cannon.
· Application Rules:
Strong bullish, short-term bullish.
18. Dawn Appears (Counterattack Line).
· Application Rules:
1. The counterattack line shape appears in a round of slow to rapid decline, and the market will evolve into a V-shaped reversal or stop and sideways trend.
2. The strength of the counterattack line shape depends on the depth of the next bullish line penetrating the bearish line's body. The deeper the bullish line penetrates the bearish line's body, the higher the probability that the market will evolve into a reversal or stop and sideways trend.
19. Solid Bullish Line
· Application Rules:
Solid bullish line patterns indicate the aggressive stance of the bulls; the specific intensity is determined by the size of the bullish line's body.
20. Solid Bearish Line
· Application Rules:
Solid bearish line patterns indicate the firm stance of selling pressure; the specific intensity is determined by the size of the bearish line's body.
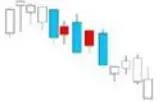
21. Evening Star.
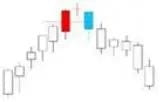
· Application Rules:
1. The judgment rules for the evening star are the same as those for the evening star.
2. The evening star has a stronger predictive significance for trend pause or reversal than the evening star.
22. Evening Star.
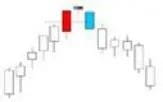
· Application Rules:
The key point of this pattern lies in the depth to which the black body of the third day penetrates the white body of the first day.
Below is a list of some reference factors. If the evening star pattern has such characteristics, it will help increase the chances of forming a reversal signal. These factors include:
(1) If there is a price gap between the body of the first candlestick and the star candlestick, and also a price gap between the body of the star candlestick and the body of the third candlestick;
(2) If the closing price of the third candlestick deeply penetrates into the body of the first candlestick (generally greater than 50%);
(3) If the trading volume of the first candlestick is light while the trading volume of the third candlestick is heavy.
23. Golden Spider.
· Application Rules:
Long-term, medium-term, and short-term moving average golden crosses indicate a bullish outlook.
24. Nine Yin White Claw.
· Application Rules:
Continuous bearish lines and moving average dead cross appearing together indicate a high risk for the future trend.
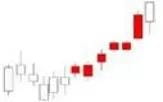
25. Dramatic rise with parallel reds.
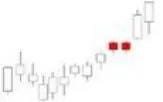
· Application Rules:
Dramatic rise with parallel reds (parallel bullish lines) -- also known as "parallel bullish line K-line, two bullish lines gapped flat bottom."
This pattern consists of two adjacent bullish lines K, which have the same opening price. Their bodies also have roughly the same height.
In an uptrend, if a set of upward gapped parallel bullish lines appears, it constitutes a bullish continuation pattern.
Looking at the trend in the large cycle, looking at the entry point in the small cycle, (with accompanying illustrations).
Because I need to go out and sunbathe.
Sunbathe to supplement calcium, so there’s not much dry goods; simplify complex problems, not much to say, just show skills.
Large cycle suppresses small cycle, small cycle guides large cycle
How exactly are these two sentences used? Many people use them poorly, saying these two sentences are useless, but in fact, they have not found the method.
Large cycle suppresses small cycle, which means you should not trade against the trend. If the large cycle is bullish, do not short; if the large cycle is bearish, do not go long.
Small cycle guides large cycle, meaning its trend may reverse.
Let's take a look at the chart.
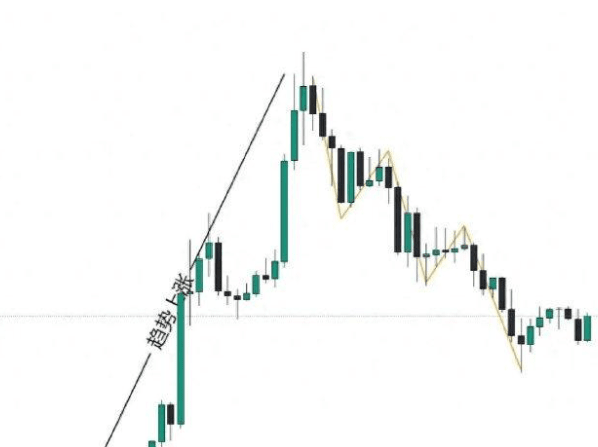
The black line segment indicates a direction upwards, the yellow line segment indicates it is now starting to pull back. At this moment, we need to use the first sentence: large cycle suppresses small cycle. At this time, the small cycle may develop a downward trend, and it's normal for it to turn bearish.
When the rise is particularly strong
Only with a sufficiently healthy pullback can one go further; therefore, this pullback will not go too far. If one wants to go short, it must be done in the current yellow line segment cycle, quickly entering and exiting.
Don't think about shorting too far; after all, this is just a pullback of the black line segment. If you hold the idea of shorting too far, you will be easily stopped out.
So when to go long? You can observe that the small cycle's pullback ends and begins to reverse, which also means that the large cycle's pullback is ending.
For example, when the price breaks the high of the small cycle, it warns that the price of the small cycle may start to reverse, meaning the small cycle is turning from bearish to bullish.
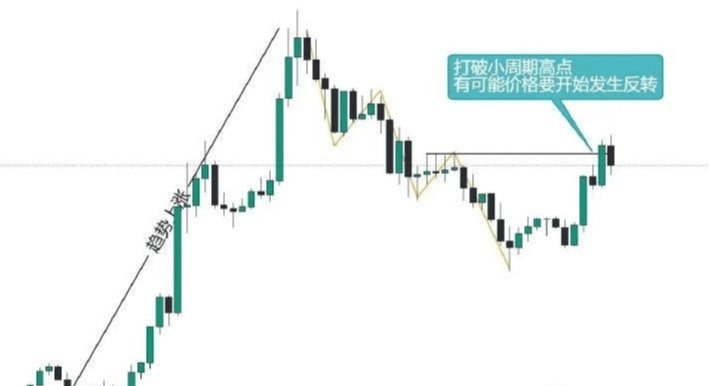
Subsequently, the small cycle's price turns from bearish to bullish, breaking through the high point of the large cycle.
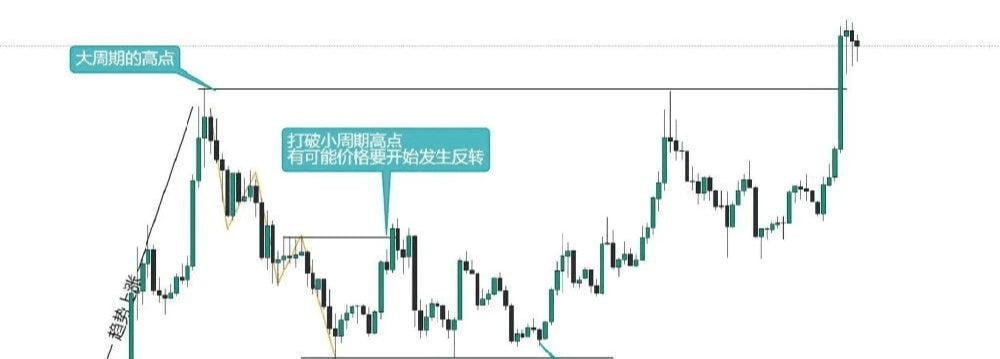
So in the small cycle, you did this long position.
What has been found is the reversal point of the small cycle, following the reversal point of the small cycle also follows the bullish trend of the large cycle's black line segment.
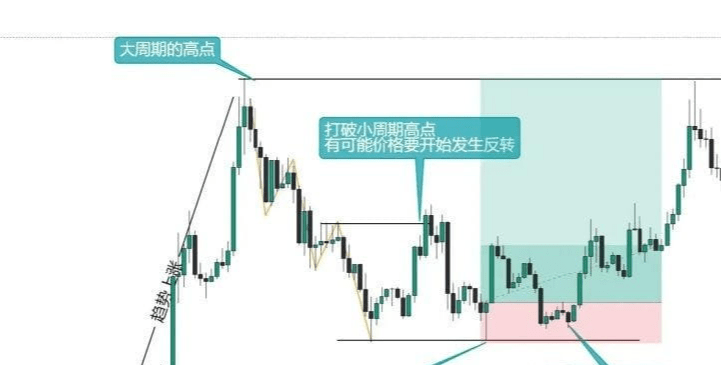
This is also the small cycle guiding the large cycle. Look at the large to do small, follow the large also follow the small.
This is also why one shouldn't make counter-trend trades; often, a small counter-trend trade causes one to miss out on greater profits. What traders fear most in trading is wanting to take everything and always wanting to be on the scene; this also explains why many traders frequently cut losses.
In trading, one must make some trade-offs; do not trade the ones you are not good at, and avoid counter-trend trades, trying to only trade within a single cycle.
Persistence over a period of time will definitely lead to growth in capital, but all prerequisites require a set of one's own trading methods.
Order of key levels (with accompanying illustrations) trading is also a process of continuous introspection.
Today's main sharing content is the order of key levels.
Divided into three types: horizontal resistance and support pressure, channel lines, trend lines.
Therefore, the order of the key points of these three types is as follows:
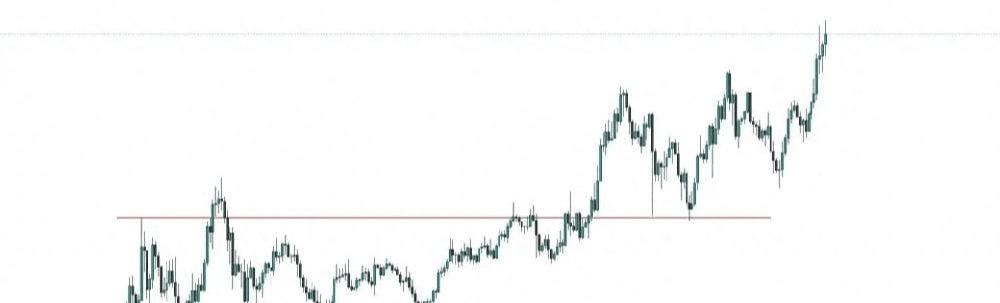
1. Horizontal resistance support pressure.
2. Channel line.
3. Trend line.
Next, we will sequentially understand them through chart cases.
1. Horizontal resistance support pressure.
Horizontal pressure support is lateral support pressure.
As shown in the figure, this kind of pressure and support has the greatest relative effect.
Sorted first.
2. Channel line.
Have you really used the channel line correctly?
When rising, the trend line is below, and the channel line is above.
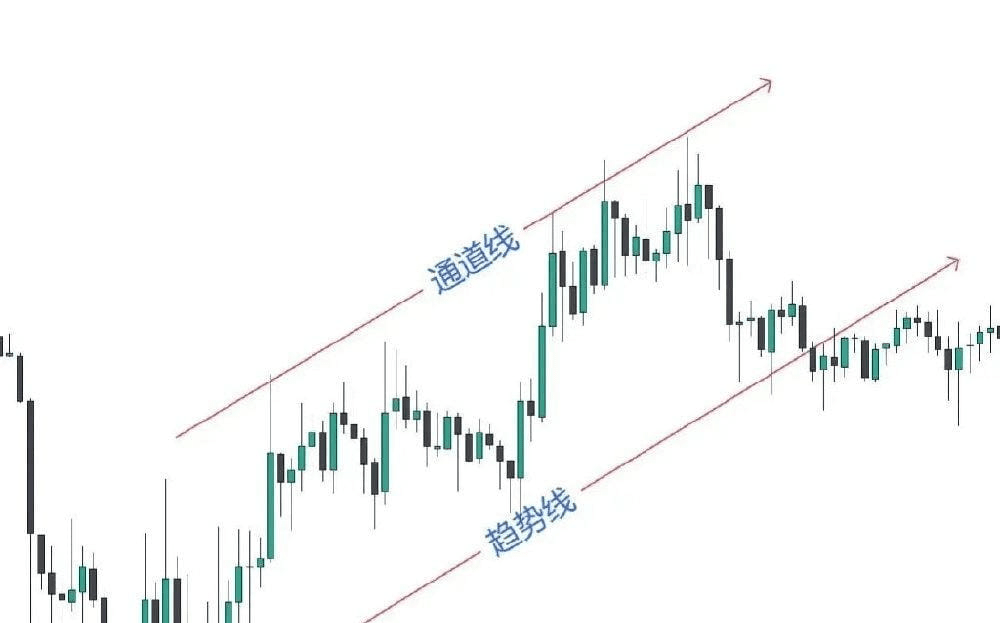
When falling, the channel line is below, and the trend line is above.
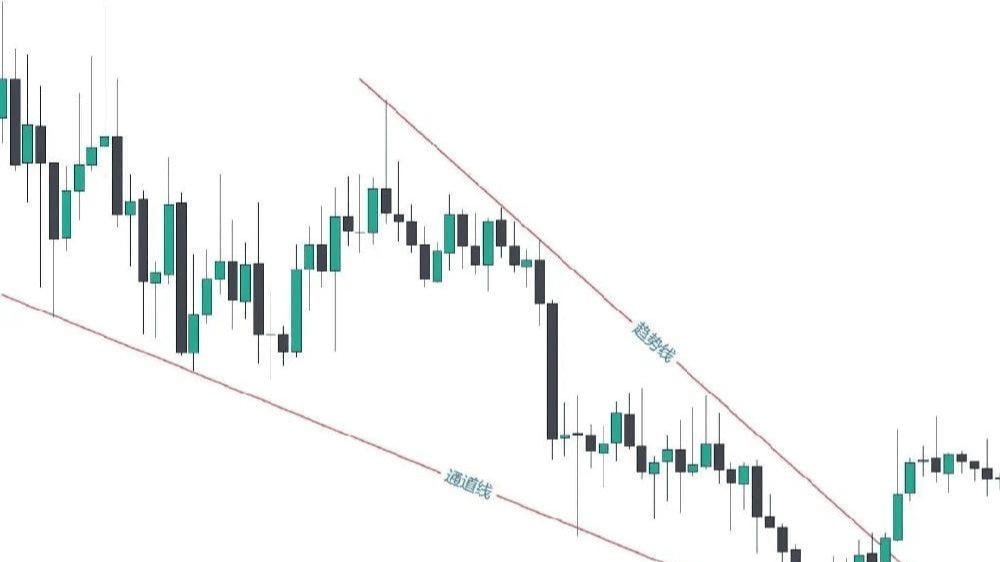
In the trading process, we will use the channel line for overrun. It is second only to horizontal pressure support.
Next, let's get to know the last trend line.
3. Trend line.
The trend line is a subject of much controversy, as each person draws it differently.
When drawing trend lines, several key points need to be noted. Points 1 and 2 are merely verification and do not constitute the drawing of a trend line; three points in a line truly conform to the correct drawing of a trend line.
What does this mean? As shown in the chart, when the price reaches the marked point 2, this trend has been drawn well, and it requires verification at point 3.
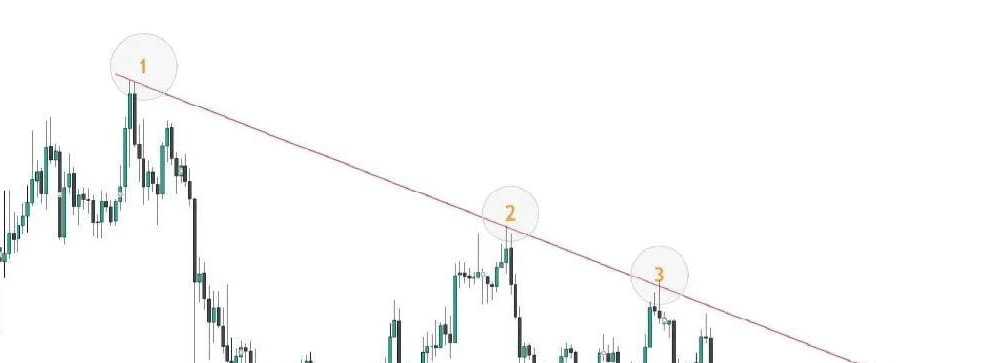
Only after point 3 verifies can this trend line be considered an effective trend line.
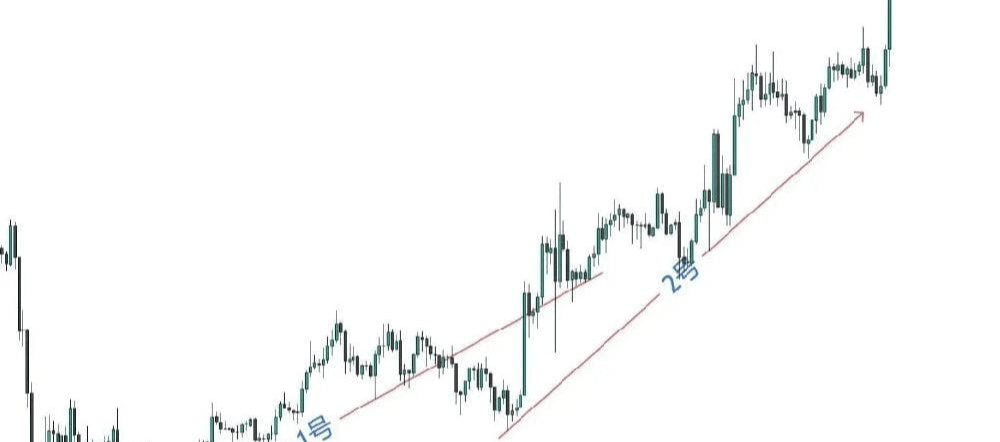
2. Points that need attention.
In the chart, both trend lines are actually effective trend lines; which one will you take as the main one in trading?
Is it number 1 or number 2? In essence, there is no right or wrong, but remember that trend lines also have a time sensitivity; you can't just draw a trend line and use it as the main guide; the current price trend is more important.
The previous illustrated analysis is complete.
The key analysis of trading is a method used to identify and evaluate the primary and secondary factors in trading. In a trading process, many factors may affect the success of the trade. By conducting a primary and secondary analysis of these factors, we can better understand the key points of trading and make wiser decisions.
And can more accurately grasp and respond to various possible risks and opportunities in the decision-making process. Through scientific and comprehensive analysis, one can improve the success rate and effectiveness of trading, thereby achieving sustainable development.
Trading is a process of continuous introspection.
Need to practice your trading skills.
Need to learn to manage positions.
Need to learn to make trade-offs and abandon trades that you're not good at.
Need to learn patience, waiting for trades you're good at.
Need to learn to control greed, leave when it's time, never insist.
Need to bow to the market.
Need to continuously acknowledge mistakes and correct them.
Need to realize that money is more important than a single order.
Need to self-comfort and self-heal.
Need to simplify things.
Need to have self-confidence.
Need to practice self-restraint.
Need to block out external voices; trading requires independent thinking.
Need to understand to extend the timeline and abandon the idea of wanting to make a lot of money immediately.
In the puzzle of trading, finding the answer in a short time is difficult, but with your growth, you will definitely find the answer.
Trading is a self-battle, and in this battle process,
you not only trade better, but your inner self and improvement will make you better, and your life will also improve.
Ruler of the cryptocurrency market: Don't let your mindset blind you when trading, sharing money-making tips from trading experts!
In this world, everything can be arranged, except your heart. Losing anyone in this world is not scary, it doesn't matter, but losing yourself is. There is still a long, long road ahead, and it has to be walked alone, relying on oneself, using one's own ability to complete it. This world will not return in kind just because of your contributions, nor will it demand equal treatment from others based on how you treat them. Living in this world, the hardest thing is to maintain humility and peace, and this humility comes from inner sincerity and solid effort.
You must believe that everyone and everything you encounter in your life has its value and significance. Some people teach you love, some things teach you to grow. Even if they only leave a faint mark on your path, it is still a precious asset. At least at some moment in the past, you understood life, and you understood yourself. We might as well think this way: Efforts that yield results are exercise, while efforts that do not yield results are training. Regardless, every encounter is an indispensable element of your life.
Without a high win rate contract trading system and effective capital management, it's hard to have a good mindset. Don't tell me you currently hold losing contracts and have a good mindset; I can only say you have reached the highest realm of loss, deceiving yourself.
Mindset = Excellent capital management + Win rate > 30% trading system.
Among the winners in the cryptocurrency contract market, technology is secondary; the core of their trading is capital management, risk control, and trading strategy.
The reason they can make money lies in the fact that losers do not execute, or do not strictly execute, or do not comprehensively implement capital management, risk control, and trading strategies.
If the two armies face off, if technical analysis is the weapon, both sides are surely evenly matched; however, if one side thinks that when two strong meet, the brave wins, and recklessly charges in, ignoring all risks, they will surely be defeated. They do not lose due to their weaponry, but rather due to their lack of understanding of defense, strategy, and troop deployment. In our trading, this is risk control, trading strategy, and capital management.
If everyone strictly, scientifically, reasonably, and comprehensively executes and adheres to capital management, risk control, and trading strategies, then technical analysis can play a role in influencing the win-lose pattern.
This also illustrates that winners focus on capital management, risk control, and trading strategies, never nitpicking technical analysis. Their requirements for technical analysis are rough, which is enough to keep them winning for 10 or 20 years continuously. Their broad perspective and deep understanding are incomparable and unchallenged by traders who only focus on technical analysis.
And unsuccessful traders will not understand what forces influence trading, diving into piles of technical analysis books without being able to extricate themselves.
The reason why losers and winners are equally matched in technical analysis is also due to the inherent limitations of technical analysis itself. For example, in Dow Theory, confirming a trend can only occur after the market has moved 30%, which may miss the opportunity to bottom-fish or sell at the top.
Technical analysis ultimately is a matter of probability; no matter how good your technique, it only means a slightly higher win rate, perhaps 50-60% certainty; their technique may be slightly worse, but the win rate probability will still be 40-50%, not much difference.
For instance, when a trend reaches a peak and has moved around 30%, it shouldn't be a big disagreement about being near the top. Traders with different opinions may say it is close to the top. From the overall trend perspective, the viewpoints are essentially the same, and divergences can be ignored, not leading to significant differences in outcomes.
However, if you enter with full positions and heavy leverage here, problems arise: our traders participate in the trend, and can see the overall direction correctly, but heavy investment leads to being shaken out by small, insignificant adjustments and losing money, making one feel slightly dazed and missing the trend, which is quite regrettable.
Light positions are not afraid of mistakes because the losses are minimal. Just follow the trend back and forth; it won't shake you off, and you can profit greatly with small positions through dynamic management.
The technical level difference between both parties is at most only 30%. If you think too highly of yourself and enter heavily without executing capital management; those with slightly lower levels, who feel inferior, trade lightly and manage their funds.
In the end, those who get washed out and lose a lot of money are definitely those who entered heavily with high levels; those with slightly lower levels will follow the trend downwards, although the profits won't be too much. But it has widened the gap with heavily invested players. After several cycles, one or two years later, the difference between them is like that of a beggar and a rich man.
So how do we do good capital management? The trading system is the prerequisite for capital management. We need to understand what capital management is. Transitioning from prediction to non-prediction is a hurdle that needs to be understood gradually; naturally, one will comprehend it. Before understanding it, explaining face-to-face for ten days or half a month will yield no results.
A mature trading system should include capital management, which should not exist independently of the trading system. Remember, it should not, rather than cannot. Personally, I believe it is essential to accurately understand the concepts of trading rules, systems, and capital management.
Starting from risk control to achieve capital management. To make it easier for everyone to understand, Li Jun still uses the previously discussed moving average trading system and Bollinger Bands for explanation: golden cross opens long, dead cross closes long and opens short.
Assuming that the accuracy of the moving average trading system is 30%, and the average win-loss ratio is 7:3, then, considering trading fees and costs, the entire trading system cannot make money.
How to understand? For example, in trading one hundred contracts, thirty contracts make a profit, seventy contracts incur losses. The average profit per winning contract is seventy thousand, while the average loss per losing contract is thirty thousand. Calculating it out, of course, nothing is gained.
In reality, trading rules and systems established solely based on indicators can mostly only ensure no losses.
In the assumption that, through backtesting long-term historical data, the system's maximum loss reaches 80%, it can be said that this system not only does not make money but also has a very high risk coefficient, a maximum drawdown of 80% is very frightening.
How to understand? Suppose you have one million in funds, and the maximum loss reduces you to only two hundred thousand; even if the final outcome is still able to earn back to one million, the risk coefficient in the process is extremely high, and it can be said to be out of control. If you encounter a terrifying black swan, there is a possibility of liquidation at any time.
For a system that has high risk and does not make much money, should it be completely unusable?
The answer: Definitely not.
First, we look at the risk; if the maximum drawdown of the system is 80%, can this risk be reduced a bit?
Of course it is possible. If you reduce your position by half, then the overall risk coefficient will also be reduced by half, and the maximum drawdown will become 40%.
Next, if we lower the position to 25%, wouldn't the maximum drawdown also be reduced to 20%?
When we write "maximum position control within 10%" as a rule into our trading system, we get a low-risk system with a maximum drawdown of 10% that does not make money.
Please note that this "maximum position control within 10%" is a simple and straightforward rule in the capital management system, mainly for risk control.
The control of trading system risk comes from reasonable capital management.
Let's divert a bit; everyone knows not to operate fully, but most people do not know why they shouldn't operate fully. The answer lies here.
Capital management amplifies profits.
For us, a low-risk but not very profitable trading system is actually of little use. To emphasize, how can we make this system achieve positive returns and profits?
In actual operations, not changing the opening and closing rules cannot change the 30% accuracy rate; for a 7 to 3 win-loss ratio, we also cannot change it. Although helpless, it is not without a solution. If we can control the average holding position of profitable contracts to 10% and the average holding position of losing contracts to around 5%, wouldn't we achieve profitability?
Capital management here almost plays the role of maximizing profit. A good capital management can turn a system that originally does not make money into a money-making system, and a system that earns small money into a system that makes big money.
Exploring the world of digital currency is akin to comprehending the true meaning of life. Once you grasp the wisdom of living, the mysteries of the cryptocurrency world will also become clear. The path of simplicity lies in the integration of knowledge and action, allowing you to maneuver skillfully and secure victory!
Continue to follow me, allowing you to encounter fewer obstacles and more shortcuts on the cryptocurrency journey. Focus on conveying the most valuable cryptocurrency information and insights.