You can experience the thrill of heaven and earth in just a few minutes. Many people line up to experience roller coasters, which are so dangerous and thrilling; it's the same principle~ Those who understand, understand. People are made of flesh and blood, and everyone has a certain degree of greed. Coincidentally, contracts can satisfy this human weakness.
A 10-year veteran will teach you two tricks to help you navigate the cryptocurrency world!
Today, without talking about inspirational quotes, I will publicly share my summarized '7 Trading Strategies for Cryptocurrency' with you. If you follow it, you can at least avoid losing years of wasted money!
Rule One: If you don't understand trading volume, you're doomed to be cut!
Increased volume without a drop is a signal to stop falling! Increased volume without a rise is a sign of reaching the top.
An increase in volume must be sustained during an uptrend; a key level of increased volume during a downtrend means it will continue to fall! Don't just focus on the price; volume is the true intention of the funds!
Iron Rule Two: Key points = life and death boundary!
Resistance levels, support levels, trend lines, react immediately when touched! Want to be more precise? I use Fibonacci to calculate key levels, and it really is accurate every time!
Iron Rule Three: Time cycles are not ornaments; they are your third eye!
1 minute: precise entry and exit points! 3 minutes: watch for wave adjustments! 30 minutes/1 hour: grasp the intraday trend. If you don't look at multiple cycles, you are just blindfolded trying to touch the K-line!
Iron Rule Four: Stop loss is not surrender; it's making way for the next opportunity!
If a trade is lost, it is lost; acknowledge it! Don't carry emotions into the next trade; losses are often due to emotional bounce trades!
Iron Rule Five: Three-position method, a lifesaver for contract trading!
Break the 5-day moving average → first portion of the position: break the 15-day moving average → second portion of the position: break the 30-day moving average → third portion of the position: if it breaks through the corresponding moving average, you should cut it; do not hesitate!
Iron Rule Six: No strategy for selling = just playing a game!
Break below the 5-day line at a high position: first sell a portion! Break below the 15/30-day line: clear! All! Positions!
Taking profits is true winning; greed will result in losing everything!
Iron Rule Seven: Position + Price out of sync, be alert immediately!
Increasing positions but not rising: be careful of selling signals! Increasing positions but not falling: may be quietly building long positions! Many people get caught because they do not understand these 'detail signals'!
These things look simple, but it's really hard to do them. However, as long as you follow them, even if you only achieve 70%, you can survive in the crypto world longer than 99% of people!
If you also want to avoid detours and no longer want to be repeatedly harvested, come to Z me.
Don't wait until you lose everything to look back!
Contract short-term technical indicators analysis basics: Boll indicator
Basic knowledge of the BOLL indicator
The Boll indicator is a technical analysis indicator designed based on the statistical model of 'standard deviation,' which provides an intuitive price range derived from this mathematical model.
The indicator draws three lines on the graph, where the yellow line is the price resistance line, and the purple line is the price support line. There is also a white line between these two lines, which is the average price line, while the remaining alternating red and green lines represent the price line.
The vast majority of technical analysis indicators are constructed through numerical methods, and they do not rely on trend analysis and pattern analysis, while the BOLL indicator has an inseparable relationship with the price's shape and trend. The concept of 'price channel' in the BOLL indicator is the intuitive representation of price trend theory.
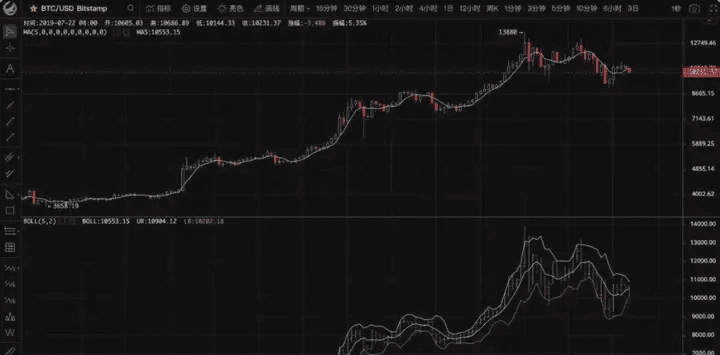
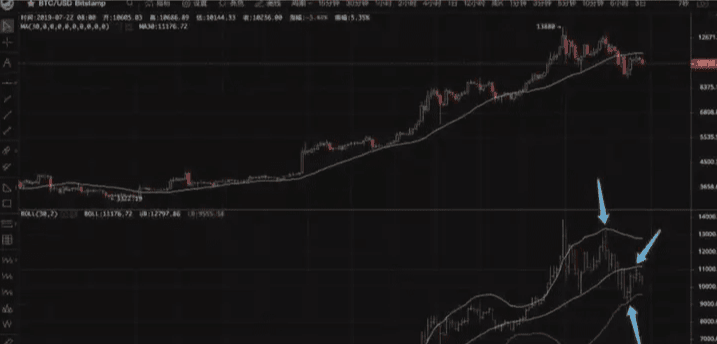
When the price of the currency fluctuates beyond the upper boundary of a narrow price channel, it indicates that an exceptionally intense upward fluctuation in price is about to begin; as shown in part of Figure 1. When the price of the currency fluctuates very little and is in consolidation, the price channel will narrow, which may indicate that the price fluctuations are in a temporary calm period; as shown in part of Figure 2. The first two '2's represent the consolidation phase within the downward cycle, while the third '2' represents the sideways phase, which should be considered in conjunction with other indicators. When the price of the currency fluctuates beyond the lower boundary of a narrow price channel, it similarly indicates that an exceptionally intense downward fluctuation in price will begin. As shown in part of Figure 3.
Boll moving average usage
When we set the Boll indicator, we will see two values, and we generally use the second value as 2, which doesn't need further explanation.
Let's look at the first indicator, which corresponds to the daily Boll indicator/weekly Boll indicator mentioned above. What does it mean?
When we set the Boll indicator to 60 and the K-line MA to 60, comparing the 60-day moving average and the 30-day moving average entanglement, we can see that the MA white line and the Boll white line are the same.
This naturally leads to a topic: the cycle! A comparison of 4 charts, hoping to clarify!
Daily lines can be used for auxiliary judgments of short-term support and resistance levels (M5)
The 20-day line is generally the default indicator in the crypto market; its feedback is more timely, and it can show two obvious trends of rising and sideways, which are the stages mentioned earlier, stages 1 and 2.
M20:
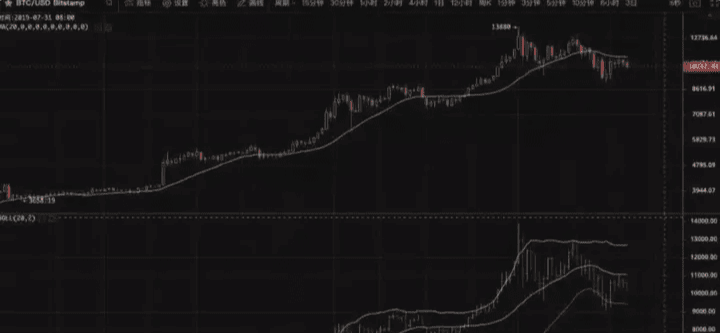
60 and 90-day lines: these are relatively long-term moving averages, and in the Boll indicator, they are also long-term moving averages, used for judgment over a large cycle. From the 60-day line, we can see that it hit the middle band without effectively breaking it, while the 90-day line has not yet retested the middle band. Using different cycles in your trading system, the same drop may result in completely different operations.
Level up by defeating monsters
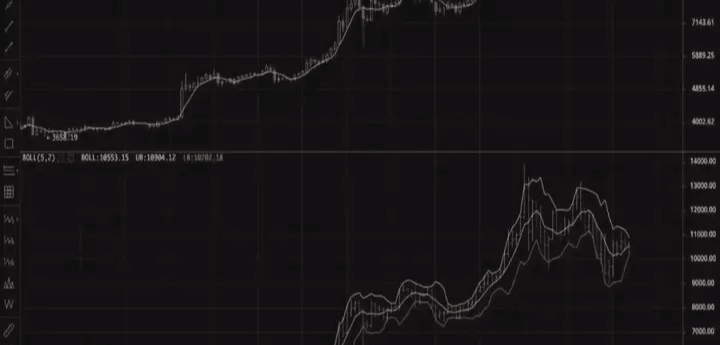
In this chart, the 30-day moving average shows 3 obvious resistance and support levels, and now it bounces back after hitting the middle band. The white middle band and the purple lower band serve as one resistance and one support, respectively. We need to understand our operating level, which requires a process of reviewing and observing to grasp well. When the level of this 30-day line matches our trading system, the middle and lower bands can provide us with a point, and the shape of the opening will also provide directional guidance, which will be a good basis for our judgment.
Practical application of the BOLL indicator
The Boll indicator is designed based on the statistical model of 'standard deviation,' which provides an intuitive price range derived from this mathematical model. The indicator draws three lines on the graph, where the yellow line is the price resistance line, and the purple line is the price support line. There is also a white line between these two lines, which is the average price line, while the remaining alternating red and green lines represent the price line.
The judgment of the Bollinger 'trumpet mouth' is a unique interpretation method of the BOLL indicator; it is the only main character!
The Bollinger 'trumpet mouth' refers to the special shape similar to a trumpet formed when the upper and lower Bollinger lines significantly expand or converge from two opposite directions during the price movement.
According to the different running directions and positions of the Bollinger upper and lower lines, we can further divide the 'trumpet mouth' into three types: opening trumpet mouth, closing trumpet mouth, and tight trumpet mouth.
"Trumpet mouth" shape is something we first mentioned; the Boll indicator has 'trendiness' and 'shape,' which are our visible trends and shapes. Let's also look at how the Boll middle band moves together with everyone to see how Boll responds to price changes in terms of 'trend' and 'shape.'
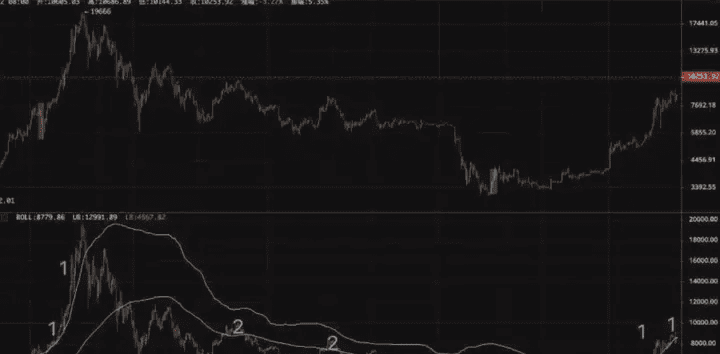
Taking the daily Boll (90, 2) as an example, the 90 indicator mentioned above is naturally a large cycle indicator. Therefore, the backtesting here is also of the daily level large cycle—operating 2-3 times a year.
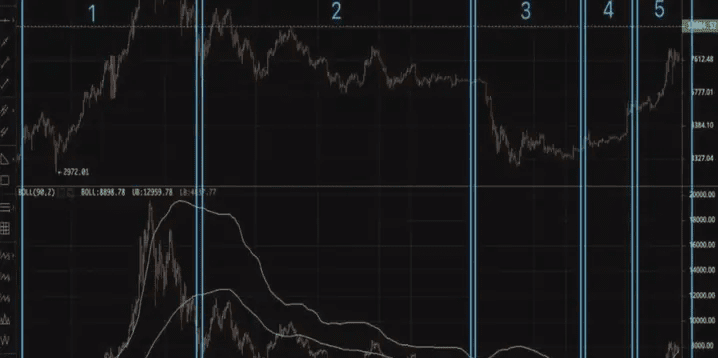
"1" Part continues the entire trend of 2017, with a very wide opening. Combined with other indicators, there is a severe technical indicator divergence. In the latter part of "1," the slope of the middle band declines and shows a trend of flattening, and the price just falls to the middle band.
"2" Part is a repair of the entire upward trend, and the price has also fallen below the Boll middle band. There were two attempts to break through the middle band, and when the price attempts to break through the Boll middle band, we need to combine this with other cycles. In the latter half of "2," the opening narrows, and the price line has been suppressed by the middle band for over 70 days, which is a signal of a downward change.
"3" Part follows the event price drop of BCH, the opening widens, after reaching the bottom, the price enters a sideways trend, during which the price line gradually moves from the Boll lower band towards the middle band.
"4" Part has been in a sideways trend for about 40 days, the Boll indicator flattens, but if you look at this segment from a smaller cycle, you will see small details that indicate a change in trend. I hope you can backtest this segment against other cycles and can clearly sense from the 'patterns' that there is weak power maintaining the price trend upwards, and the price has consistently stayed above the middle band, accompanied by a final increase in volume, presenting an upward trumpet shape, indicating a change, forming the '5' part's shape.
"5" After the surge at the beginning of this year, after the first surge, the Boll shows a widening direction, and the Boll middle band has already tilted upwards. Combined with other technical indicators, one can boldly buy.
The Boll indicator has a lagging characteristic; how to minimize this lag? By using the cycles mentioned in the first sharing to compensate. Finding the collaborating points in different cycles can allow for more accurate judgments.
There is a very foolish method for trading cryptocurrencies, but this method can basically slowly eat away all profits.
There is a very foolish method for trading cryptocurrencies, but this method can almost eat up all the profits; learn it slowly. First of all, when trading cryptocurrencies, we should never do three things.
The first thing is to never buy when the price is rising; be greedy when others are fearful and fearful when others are greedy. Be able to buy when the price is falling and make this a habit.
The second point is to never over-leverage your positions.
The third point is to never go all in; being all in makes you very passive, and the market is not lacking in opportunities. The opportunity cost of being all in can be very high.
Additionally, let's talk about the six rules for short-term cryptocurrency trading.
The first point is that after the price has been consolidating at a high position, there is usually a new high. And after consolidating at a low position, there is usually a new low, so we need to wait until the direction of the change becomes clear before we act.
The second point is to avoid trading during sideways markets; most people lose money in cryptocurrency trading because they can't do this simplest thing.
The third point is that when choosing K-lines, when a bearish candle closes, we buy on the daily line. When a bullish candle closes, we sell.
The fourth point: the decline slows down, the rebound is also slow, and the decline accelerates the rebound.
The fifth point is to build positions according to the pyramid buying method, which is the only constant in value investing.
The sixth point is that when a currency continues to rise, after a sustained decline, it will inevitably enter a sideways state. At this time, we do not need to sell everything at this high position, nor is it necessary to buy in fully at the low position. Because after consolidation, it will inevitably face a change. If it changes downwards from a high position, then it is necessary to clear the positions in time; in short, it is essential to take timely action.
Still the same saying, if you don't know what to do in a bull market, click on Aze's avatar to follow for bull market spot planning, contract passwords, and free sharing.


