From entering the crypto world with 5 to making 10 million, then going into debt of 8 million, then making 20 million, and now achieving financial freedom, I mainly mastered contract trading skills. Trading contracts in the crypto space is like playing with your heartbeat; it's thrilling and more exciting than a roller coaster.
Today, I will share a free summary of my years of trading experience, hoping it can help everyone!
I think we are neither in a bull market nor a bear market; we are in a middle phase.
In the short term, the next few months seem more like a bear market, as there is currently a downward trend, and it hasn't dropped to the bottom yet; it may continue to go down.
However, in the long run, the next 1-2 years will likely be a bull market, as countries will 'print money to rescue the market,' leading to an increase in financial assets.
Why clarify bull and bear markets?
Because this directly determines how we operate.
The past two years have been a bull market (with significant gains). Everyone has become accustomed to 'buying whenever there is a slight dip.'
However, in a bear market, prices can continue to fall. When bottom fishing, you must calculate how much money you have on hand and avoid going all in at once.
You should never recklessly bottom fish altcoins; otherwise, you might end up losing so much that you won't have any pants left.
So how do we judge bull and bear markets?
Many people guess bull and bear markets by looking at price fluctuations; this is not wrong, but it is not entirely correct.
Just because the price rises does not mean it is a bull market; similarly, a drop does not necessarily indicate a bear market.
Several conditions are required for a bull market:
1. Money is abundant: most countries worldwide are injecting liquidity, and the amount of money in the market is increasing, leading to rising financial assets.
2. Borrowing money without interest: interest rates are extremely low, even close to zero.
3. The central bank starts printing money: for example, buying government bonds and directly injecting money into the market (quantitative easing).
4. The economy is improving: everyone has jobs, companies are making money, and they are willing to invest.
5. The dollar is worthless: the U.S. dollar index (DXY) is declining.
6. The government issues red envelopes: implementing policies to stimulate the economy.
Among these conditions, the most important is the significant liquidity injection, as it will drive other conditions to occur.
For example, when the U.S. injects liquidity, interest rates drop, money in the market increases, and the economy improves.
But what about now? The U.S. has just begun to cut interest rates (meaning borrowing costs are slightly lowered), with three cuts totaling only 1% (100 basis points), and the current interest rate is still 4.5%, which is considered high historically.
Moreover, the U.S. central bank is still 'reducing its balance sheet' (pulling money back), which is contrary to the 'liquidity injection' desired in a bull market.
So, it is not a bull market where 'money is abundant enough to spend freely.'
So what is the current situation?
Right now, it's a 'half-baked' state.
Some popular items (like U.S. stocks and Bitcoin) are being traded vigorously and rising quickly, but they are not stable; they can also fall quickly.
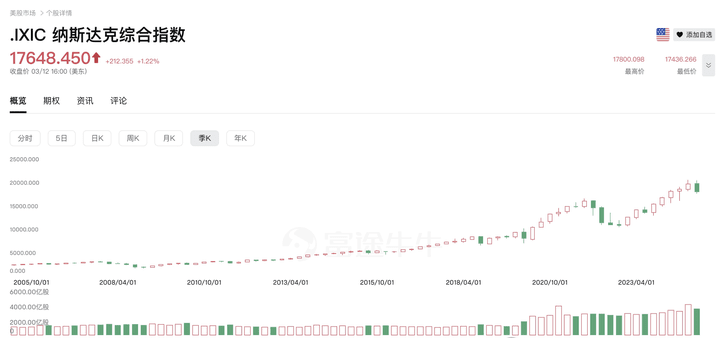
U.S. stocks remain in a high-level oscillation trend and may continue to wash out positions.
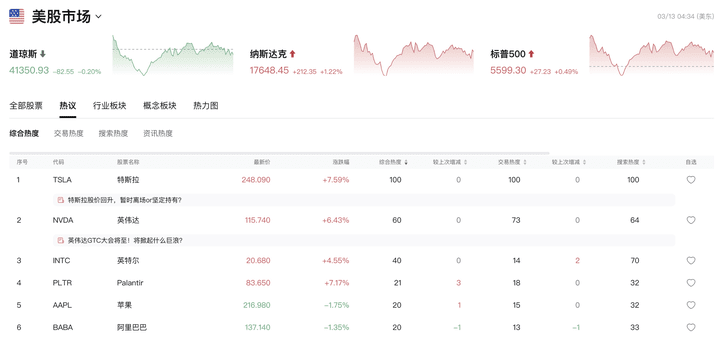
In the short term, if the U.S. economy deteriorates (for example, poor GDP data), U.S. stocks may continue to decline.
For U.S. stocks to rise, it’s not about AI revolutions or Trump’s presidency; it must rely on the Federal Reserve (the U.S. central bank) injecting liquidity.
Injecting liquidity means printing money and lowering interest rates, making borrowing cheaper. Only when the market has money can it rise.
But the Federal Reserve does not inject liquidity casually; they will wait until the U.S. economy is truly struggling (recession) or until everyone is sufficiently scared (market panic), and asset prices have plummeted before intervening to rescue the market.
Therefore, whether it's U.S. stocks or Bitcoin, the current prices have not yet dropped to a level that 'reflects a recession'; the Federal Reserve has no reason to inject liquidity.
For example, U.S. stocks just broke below the price from November 5 when Trump was elected, and only then did the 'tide recede.'
Bitcoin is still much higher than before, indicating that the influx of funds from Trump has not completely faded, let alone reflecting a recession.
The market may need to fall a bit more; only when it has dropped sufficiently will the Federal Reserve step in to rescue the situation, and that’s when it can rise.
However, in the long run, over the next 2-3 years, the Federal Reserve will definitely inject liquidity, and the U.S. stock and cryptocurrency markets will likely experience another bull market.
When is the safest time to bottom fish?
1. Look for liquidity signals:
American banks can lend more (SLR activation) or the central bank stops taking money (stopping balance sheet reduction). These are all signs of liquidity injection.
If the economy does not collapse, I would choose to buy at that time.
2. Look at the Bitcoin price:
Currently, Bitcoin is fluctuating around $83,000.
If it drops to 70,000-75,000, I would choose to buy a little in batches.
70,000 USD is a psychological barrier.
If the U.S. economy does not collapse, it might drop to around 70,000.
If it really collapses, it may continue to drop to around 60,000.
Therefore, it is essential to manage your position well; don’t go all in, and keep some money available for additional purchases.
No one can predict the future; being alive is more important than anything.
3. Look at economic data:
The latest dot plot released by the Federal Reserve on March 20 is crucial; it will determine how many rate cuts there will be this year.
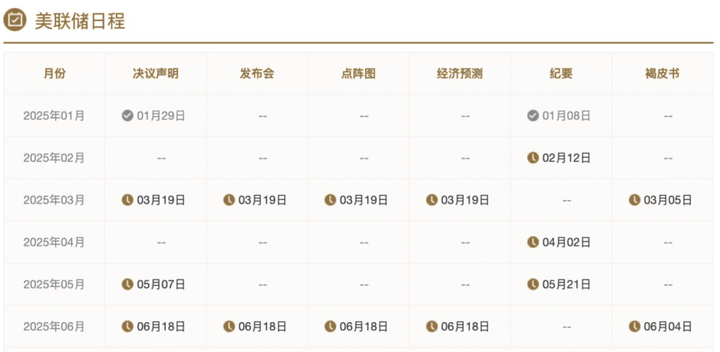
Additionally, if April's data shows a decline in the U.S. economy (negative GDP growth), the market may panic, and the U.S. stock and cryptocurrency markets could continue to fall, making it a good opportunity for bottom fishing.
Summary
Currently, it is neither a bull market nor a bear market; it is in a middle phase.
In the short term, the market may continue to experience oscillations over the next few months, washing out some weak hands, which will test everyone's mentality. It is recommended to watch more and act less; just lay low.
However, in the long run, the next 1-2 years are likely to be a bull market, as the Federal Reserve will definitely inject significant liquidity.
As long as liquidity is injected, most financial assets will rise, and that’s when the bull market will come.
As someone who has experienced three rounds of bull and bear markets, I can tell you that the following three points are the things you absolutely cannot do in the cryptocurrency space.
1: Don't touch contracts, don't hold positions, don't chase after hype coins.
2: The worst thing to do is to frequently buy and sell, chasing highs and cutting losses.
3: The worst thing to do is to put all your coins in one wallet address or exchange; it's even more dangerous than trading with leverage in futures.
Next, I will bring you pure practical content, the things you should do the most in the cryptocurrency space.
Share five steps to understand K-line language and seize the golden signals before a bull market explosion!
Step 1: Look at the size of the K-line entity.
As shown in the chart below: categorized by size, we divide K-line entities into three types: wide, narrow, and medium.
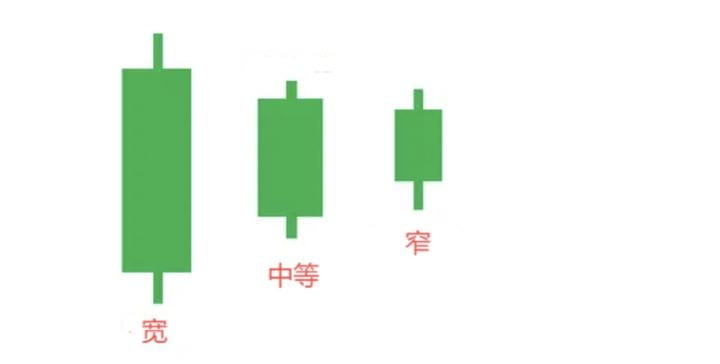
The size of the entity is relative; there is no specific measurement point because when we look at different time cycles, the point numbers may vary greatly. What we need to know here is:
When the entity part is wide, it indicates strong current momentum; when the entity part is narrow, it indicates weak current momentum.
When several consecutive K-lines in the same direction have increasingly longer entities, it indicates that the momentum in that direction is strengthening; conversely, the momentum in that direction is weakening.
There is also a special case where the entity of the K-line suddenly expands compared to the medium-sized K-line entity, indicating an increase in market volatility. The increase in volatility serves as a strong auxiliary signal for verifying reversals.
From the above, we can see that when judging the market environment, we need to compare different K-lines. Therefore, the reference for comparison is very important. In practice, we can compare the current K-line with the following several references:
The previous K-line, the most recent swing point K-line, and the K-line at the last swing point.
Step 2: Look at the length of the shadows.
Longer shadows usually indicate that the price once reached a certain level but failed to hold those levels and underwent significant corrections. This often implies that there is considerable buying or selling pressure at the levels touched by the shadow.
Logically speaking, the appearance of shadows often indicates that the price may fluctuate in the opposite direction of the shadow, suggesting an imminent reversal. However, in practice, this cannot be generalized.
Taking the downtrend as an example, when the price approaches a key support level, the lower shadow suddenly enlarges, indicating increased volatility and finding strong buying support below. If this situation happens after a prolonged trend, a reversal may be imminent.
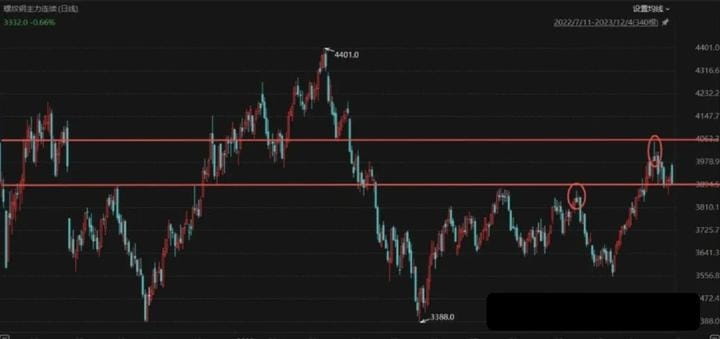
Conversely, if an upper shadow encounters resistance nearby, it may signal a decline. The chart below shows the trend of rebar futures, where we can see that when the price reached two key resistance levels, forms with upper shadows appeared, followed by a price reversal.
However, after a long upward trend, if multiple K-lines with long lower shadows appear continuously, the price may choose to move downward (at least in the short term).
For example, in my market analysis in October, I pointed out that gold prices might plummet, and indeed, on October 8, gold prices welcomed a significant bearish candle and tested the support at $2,600.
Step 3: Comparison of entity and shadow.
Taking bearish candles as an example, when the closing price is close to the upper 30% of the K-line, it indicates that the price has tested the lower area but was pulled back by bulls, indicating a bullish signal.
When the closing price is at the 50% position of the K-line, it means that bears still hold the advantage, but bulls have started to enter.
When the closing price is below the opening price, and the closing price is within the lower 30% of the K-line, it means that the bears are still relatively strong, and the market remains bear-dominated.
When the closing price is below the opening price, but the entity formed by the opening and closing price is in the middle of the K-line, especially when the entity part is relatively short, a doji star will form, indicating that the market is in a state of indecision.
Step 4: Trading volume.
Wyckoff analyzed the relationship between trading volume and price and summarized the following rules:
1. Law of supply and demand: when demand exceeds supply, prices must rise to meet that demand; conversely, when supply exceeds demand, prices will fall.
2. Causal law: small trading volume only leads to small price fluctuations; if the cause is significant, the effect will also be significant. Conversely, the same is true.
3. The law of effort and result: every price fluctuation must have a corresponding reason. If trading volume does not show a corresponding relationship with price fluctuations, then other reasons may be affecting the market.
Combining the above three laws, we will discuss the K-line and trading volume together.
When the price rises with a strong bullish candle, we also need to see an increase in trading volume, indicating that a large amount of capital is entering, and the price rise is valid.
But if the price rises with a strong bullish candle while the trading volume does not increase and is below average, this is a warning signal: the rise may not be sustainable. It could be an opportunity for bulls to escape.
So what happens when the K-line shrinks? According to the causal law, when the K-line becomes smaller, the trading volume should also decrease. However, there are always exceptions; the trading volume may also increase when the K-line shrinks. In this case, there are usually two interpretations:
Either professional institutional funds are selling, or the price has reached the end of the upward phase. Even if not, it may indicate an imminent consolidation.
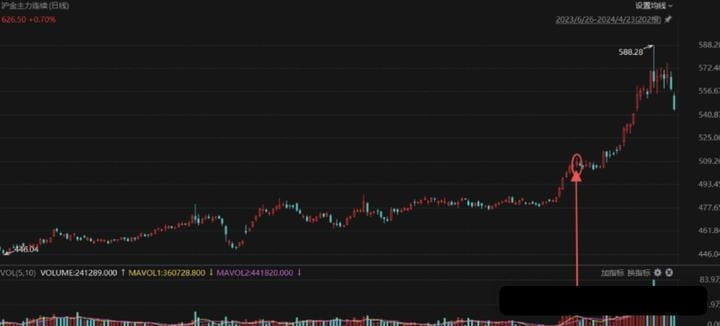
The chart below shows the main continuous contract of Shanghai gold from the previous period. You can see that after a round of price increase, at the position indicated in the oval area, trading volume suddenly surged to a six-month high, but the price fluctuation range clearly narrowed, leaving behind a doji star, and then the price entered a half-month consolidation trend.
Moreover, when the price is about to break through the consolidation range, professional institutional funds buy at the top of the range in the form of high selling and low buying, which may also lead to a decrease in K-line size but an increase in trading volume.
Step 5: Look at the relative movements of the two K-lines.
No tree stands alone; after mastering the content related to a single K-line, we can start with two K-lines to deduce the possible trend of the third K-line. Whether the trend of the third K-line ultimately validates our deduction or refutes it, it holds significant value for our trading.
The reason for using two K-lines to deduce the trend of the third K-line is closely related to the 'market exists trend' hypothesis in technical analysis. In fact, not only technical analysis but also fundamental analysis to some extent uses this hypothesis. For example, in fundamental analysis, consecutive declines in GDP data over two quarters are defined as an economic recession.
In technical analysis, when we see two consecutive K-lines moving in the same direction, regardless of whether these two K-lines are bearish or bullish, or one of each, as long as their highs and lows are rising, we say that the market is in an uptrend. Conversely, this indicates a downtrend.
In addition to the direction of the trend, the strength of the trend is also equally important.
When judging trends, we should also observe whether the length of the second K-line has increased. How significant is the pullback of the second K-line? If the second K-line is longer and the pullback is smaller, we say that the trend is becoming stronger. If the K-line lengthens but the pullback also increases, we say that the trend is weakening.
Of course, not all K-lines are equal. Taking U.S. stocks as an example, although trading occurs from 9:30 AM to 4:00 PM, the majority of trading volume usually occurs in the hour before the market closes, while the trading volume during the lunch break is very low. Therefore, K-lines during the lunch break may be classified as inactive K-lines.
After understanding the trend direction and strength, we will add the concept of 'testing.'
The high and low points of the K-line are natural support and resistance. Taking the upward trend as an example, if K-line 1 is a bullish candle, and K-line 2 tests the low of K-line 1 after opening but then rises again, closing with a bullish candle, then even though the high and low points are declining, it may still be a bullish signal.
Conversely, if K-line 1 is a bullish candle, and K-line 2 is a bearish candle that fails to test the high of K-line 1, closing below 50% of the entity of K-line 1, even if the high and low points are rising, we should be cautious: the trend may reverse or slow down.
In addition, prices will also form inside bars, engulfing bars, etc. The former indicates that the market is indecisive and waiting for a new direction, while the latter expresses increased volatility.
Learn in the market.
In the five steps above, I introduced key points for interpreting price behavior from various angles such as K-line entities, shadows, and trading volume. Next, we will find a market chart to review these key points from real market movements.
Taking rebar futures as an example, mainly because trading volume is relatively easy to find. In international spot gold, crude oil, and other CFD contracts, trading volume data is relatively scarce, but we can refer to domestic futures trading volume. Of course, even in the absence of trading volume, our judgments based on K-lines themselves are also very meaningful.
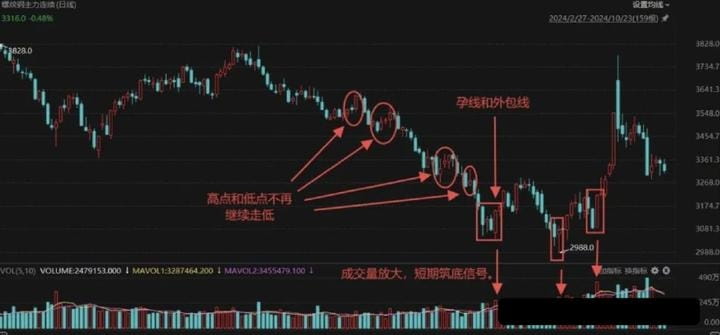
In the chart above, the trend I selected is in a downward trend. In the several oval areas I marked, you can see that the price once showed a gradual increase. Except for the first oval area, we found that although the high and low points of the price gradually rose, their K-line sizes were still much smaller compared to the bearish candles from the earlier decline. Therefore, in this case, most did not show a significant rebound.
However, in the bottom rectangular area, the situation changed significantly. The price first formed an inside bar, and then formed an engulfing bar. Here we will use the knowledge introduced earlier to explain this rebound:
First, look at high and low points: K-line 1 continues the previous downward trend, K-line 2 tests the low of K-line 1 but does not break it, forming an inside bar. K-line 3 shows reduced volatility, and K-line 4 tests the low of K-line 3 but closes above the high of K-line 3.
Now looking at volatility: the length of K-line 4 has clearly increased, almost the longest one in this round of decline (including bearish candles), indicating that volatility has significantly amplified.
Finally, look at the trading volume: the volume corresponding to K-line 4's bullish candle clearly increased, almost reaching the highest level in the past five months.
After considering the above points, we can see that the price has experienced a relatively large rebound, but it is not yet a reversal. A true reversal should start from the second rectangle and the third rectangle.
In the second rectangle, we will look at K-line 2 from four angles:
First, look at the length; the length of K-line 2 has significantly increased compared to the previous bearish candles, which is a strong signal of a potential reversal.
Next, look at the shadows and the entity and their relative positions. A longer lower shadow appearing after a downward wave suggests a possible price reversal. Additionally, a smaller entity, especially if it closes in the top 30-40% of the K-line, indicates bullish sentiment.
Then look at the test; the price tested the low of K-line 1 and eventually rebounded, closing above 50% of the entity of K-line 1.
Finally, look at the trading volume; the volume further increased, refreshing the trading volume peak in the first rectangular area.
We can use the same logic to interpret the reversal in the third rectangular area:
First, look at the length; the length of K-line 2 has significantly increased, which is the first signal that a reversal may be effective.
Next, look at the shadows and entities; K-line 2 has almost no shadows, close to a full-body K-line, indicating that the bullish theory has not yet been fully released. Meanwhile, compared to K-line 1, both the high and low points are gradually rising, signaling an upward trend.
Finally, look at the trading volume; the trading volume has significantly increased, reaching nearly a three-year high.
 I am Ah Peng, having gone through multiple rounds of bull and bear markets, with rich market experience in various financial fields. Here, I penetrate the fog of information to discover the real market. More opportunities for wealth passwords, find truly valuable opportunities, and don’t miss out on regrets!
Ah Peng only engages in real trading; the team still has positions to add, so speed up to #九月加密市场能否突破? $BTC $ETH.


