I sincerely hope to share the experiences I have accumulated over the years with everyone, so that you can learn useful strategies for yourselves.
1. Strictly limit the risk of a single trade, the proportion of capital must not exceed 10%. For beginners, it is more appropriate to keep it within 2%-5%. Ensuring the safety of capital is the foundation of trading.
2. Once you enter the market, do not hastily close your position due to impatience. Market changes take time to manifest. As long as there is no clear reverse signal, you should firmly uphold your judgment, maintaining confidence and patience.
3. The trading plan is the guideline for action and must be strictly followed, avoiding excessive trading. Any impulsive behavior beyond the plan may lead to unbearable consequences.
4. When the trading direction is correct and profits are generated, promptly adjust the take profit and stop loss levels to lock in some profits while retaining the opportunity for greater returns until a trend reversal occurs.
5. Be sure to set a stop loss point before entering the market, and do not cancel it casually after entering. The entire trading process is a process of risk management, and the stop loss point is the last line of defense to protect oneself.
6. Even if the trading progresses smoothly, do not easily add costs. Increasing positions often magnifies risks, and once the trend reverses, the losses will be difficult to estimate.
7. The conversion between long and short positions requires precise timing and deep technical analysis skills; non-professionals should not attempt it casually to avoid losses due to misjudgment.
8. When trading goes smoothly, remain alert and avoid casually increasing positions. At this time, the mindset can easily relax, leading to blind confidence, which greatly increases the probability of making mistakes.

I have been trading for 10 years, from losing sleep to now earning millions a month, all relying on stubbornly sticking to a simple method:
[Three survival rules]
One,
Capital iron rule: Survive first, then talk about making money.
Positioning strategy: Use 10,000 of 100,000 principal for testing each time (total position ≤20%)
Single stop loss: If losses exceed 2000 yuan (2% of total funds), immediately cut losses to survive.
Leverage Zone: Newbies should not use leverage / Experienced ≤10% (80% reduction in liquidation risk)
Two,
Core strategy: Focus is key to victory.
One-sided targeting: Only choose one side (success rate increases by 60%)
Mechanical operation: 3% stop loss line + 5% take profit point (strictly executed, survival rate doubles)
Golden period: The highest win rate in the first two trades each day (win rate drops 40% after more than 3 trades)
Three,
Deadly taboos: 90% of losses are due to these
Counter-cyclical increase: each time you add a position, the liquidation risk is multiplied by 3
High-frequency trading: Transaction fees eat up 50% of profits
Floating profits turning into losses: 93% of liquidations start from 'wait a bit more'
[Practical case breakdown]
Bloody case: 100,000 principal → zero in 3 days
Day 1: Full position opening 10x long (misuse of leverage)
Day 2: Buy on dip to average down (violating the positioning strategy)
Day 3: Continue to hold positions until liquidation (ignoring stop loss)
Correct demonstration: 100,000 stable increase
Strategy: 20,000 base capital + 3% stop loss + 5% take profit
Operation: Two definitive trades per week
Result: Average monthly 8% profit (annualized 151% compound)
[Expert's secret code]
Three do's and three don'ts: Do invest spare money, do have iron discipline, do not go all in on one side, do not hold on to positions, do not block both ends.
Ultimate warning: Contracts are not a casino! Those who use 1 year's living expenses to earn 3 years' returns ultimately become harvested leeks.
Remember: Use spare money, maintain discipline, and survive!
100U rolled to 10,000U! The optimal solution for small funds to fight back, three strategies help you break through:
First phase: 100U courageously passing three stages
In the initial stage, use only 100U each time, targeting hot cryptocurrencies for speculation while strictly setting stop loss and take profit points.
The goal is to achieve a three-step jump: 100U → 200U → 400U → 800U
The maximum number of attempts is three! Because in the crypto circle, luck is indispensable; even if a all-in style gamble can profit nine times, one liquidation may turn all efforts to nothing.
If you successfully pass the three stages, the principal can smoothly roll from 400U to 1100U, you can enter the next stage
The stop loss and take profit methods for this stage:
Take profit: Set a fixed profit target ratio. When the price of hot coins rises by 20%, decisively take profit, turning 100U of principal into 120U.
Stop loss: To control risk, set a strict stop loss ratio. Once the price of hot coins drops by 10%, immediately stop loss and exit, even if the price rises later, do not look back.
Second phase: Three strategies launch simultaneously
When the principal reaches 1100U, adopt the following three strategic combinations to comprehensively enhance investment efficiency and safety:
Ultra-short order (fast attack and quick strike)
Trading level: 15 minutes
Trading targets: Only select Bitcoin (BTC) and Ethereum (ETH)
Advantages: Potential returns are high.
Risk: High risk, suitable for participating with a small position (10%-20% of the invested principal each time).
Strategy single (stable profit)
Trading level: 4 hours
Leverage usage: 10x leverage, each input amount controlled around 15U
Investment strategy: Use profits to dollar-cost average into Bitcoin (BTC), fixed weekly investment
Advantages: Risks are within controllable range, helping to gradually accumulate principal trend positions (medium to long term)
Trading level: Daily or weekly level.
Investment strategy: Patiently wait for a suitable entry point and set a high profit-loss ratio (such as 1:3).
Advantages: Once the trend is captured, the returns are substantial, especially suitable for operations in significant trends.
Notes: Stay calm, patiently wait for opportunities, and avoid frequent operations.
Finally share the buying points of the 'seven bottom patterns'!!! Each sentence is essential, recommended to collect!!
One, double peak reversal
Double peak reversal refers to the formation of two peaks at the price top or bottom, namely double tops and double bottoms, commonly referred to as 'M' shaped and 'W' shaped reversals.
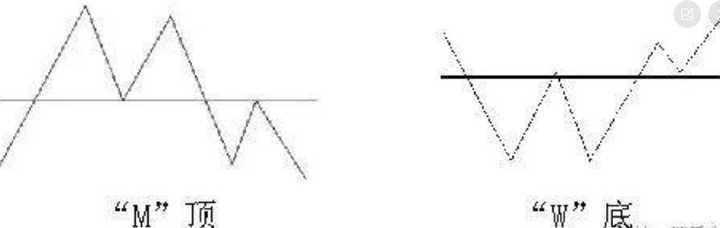
The double peak reversal pattern does not necessarily indicate a price reversal; it may also rise supported by the support line during the price's return to the neck line. The price moves within the area between the support line and the previous two high points, forming multiple patterns such as triple tops, triangles, etc., but this possibility is small.
The farther apart the two peaks are, the longer the duration of the formation of the two tops and bottoms, the greater the potential for a double top reversal in the future, and the more intense the volatility after the reversal.
The rise (fall) after the breakthrough of the double peak pattern is 1-3 times the height of the neck line of the pattern itself.
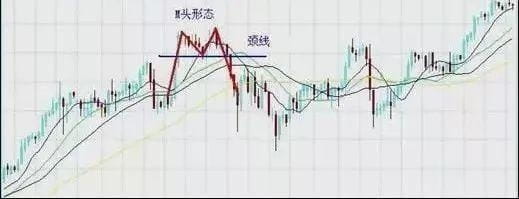
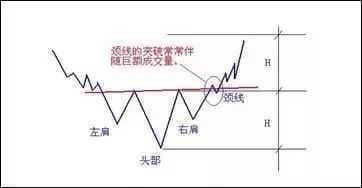
Two, head and shoulders top
This is a long-term trend reversal pattern that usually appears at the end of a bull market.
The head and shoulders reversal pattern has three peaks, with the middle peak higher than the other two, which is called the head. The left and right peaks are lower and are referred to as shoulders.
When the head and shoulders top neck line is broken, it is a real sell signal. Although the price has fallen significantly compared to the highest point, the downward trend is just beginning, and investors who haven't sold should continue to sell.
When the neck line is broken, we can predict to what level the price will fall based on the minimum drop measure of this pattern. The method is to draw a vertical line from the highest point of the head to the neck line, then from the point where the right shoulder breaks the neck line, measure the same length downwards. The price measured is the minimum downward movement of that stock.
Example:
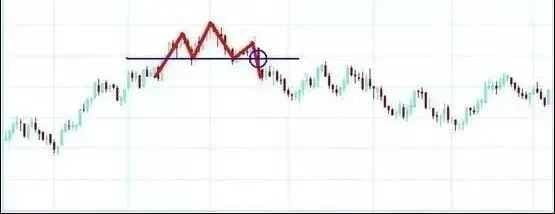
[Blue circle indicates reference sell signal]
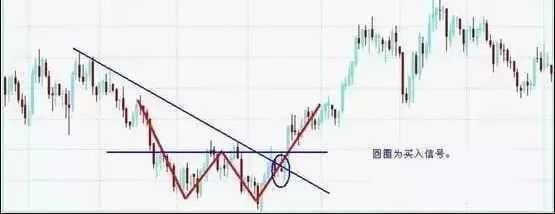
Three, head and shoulders bottom
(1) The shapes of head and shoulders top and head and shoulders bottom are quite similar.
(2) When the head and shoulders bottom neck line breaks, it is a real buy signal. Although the price has risen significantly compared to the lowest point, the upward trend is just beginning, so investors who are buying should continue to pursue. The minimum measure of the upward movement is to draw a vertical line from the head's lowest point intersecting the neck line, then from the right shoulder breaking the neck line point, measure the same height upward. The measured price is the minimum upward movement of the stock.
Moreover, when the neck line resistance is broken, there must be a significant increase in trading volume; otherwise, it may be a false breakout. However, if trading volume gradually increases after the breakout, the pattern can be confirmed.
(3) Generally speaking, head and shoulders bottom patterns are flatter, thus requiring a longer time to complete.
(4) After breaking the neck line, there may be a temporary pullback, but it should not fall below the line. If the pullback falls below the neck line or if the price falls back at the neck line level and cannot break the neck line resistance, and also falls below the head, this may indicate a failed head and shoulders bottom pattern.
(5) The head and shoulders bottom is one of the most powerful predictive patterns. Once confirmed, the upward movement is often greater than the minimum upward movement.
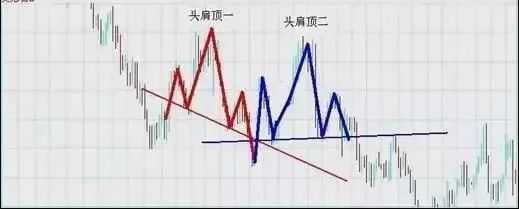
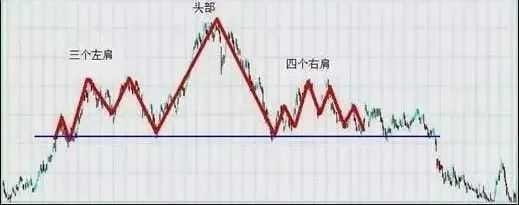
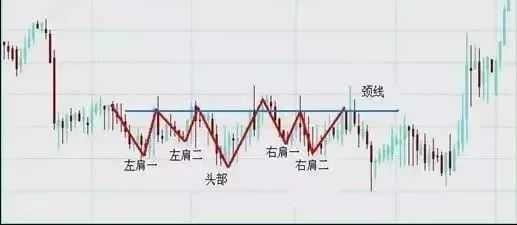
The head and shoulders reversal pattern has many special shapes, namely composite head and shoulders patterns. The analysis method is the same as that of head and shoulders reversal patterns. Below are several common shapes listed for everyone to deepen their impression.
Four, triple tops (bottoms)
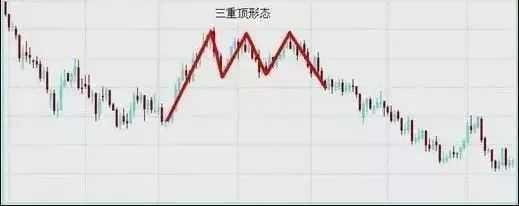
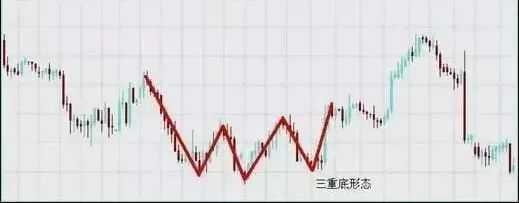
Any head and shoulders pattern, especially when the head exceeds the shoulders not by much, can be called a triple top (bottom) pattern. The triple top pattern is also very similar to the double top, only with one more top, and each top is spaced apart and deep. The triple bottom is the inverted triple top, and the analytical meaning is the same.
Fifth, circular bottom (top)
The price shows a solitary increase. It keeps rising, but each high point doesn't rise much before falling back. First, the new high is higher than the previous point, and then the rebound point is slightly lower than the previous point, connecting the short-term high points forms a circular top. The trading volume will also show a circular shape.
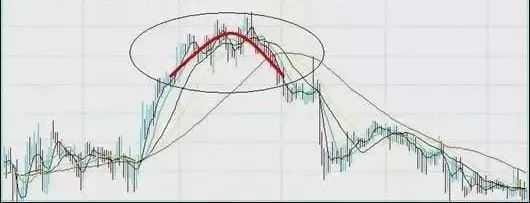
(1) Sometimes when the circular head forms, the price does not immediately fall but develops horizontally, creating a wandering area known as the cup handle. Generally, this cup handle will quickly break out, and the price will continue to develop towards the expected downward trend.
(2) Circular reversal occurs at both the top and bottom of the price, with similar shapes but opposite meanings.
At the bottom, it shows a solitary decline in price. Initially, the selling pressure gradually diminishes, leading to a continuous decline in trading volume, but the buying force remains hesitant. Thus, even though the price is declining, it does so slowly and subtly, with the trend curve gradually approaching a flat level.
At the bottom, buying and selling forces achieve a balance, resulting in only a very small trading volume. Then demand starts to increase, and prices rise, ultimately allowing buyers to fully control the market, resulting in a significant price increase and a breakthrough upward trend.
In terms of trading volume, it initially decreases slowly to a level, then increases again, forming a circular bottom. This pattern indicates that a significant bull market is imminent. Investors can enter at the initial surge of the circular bottom.
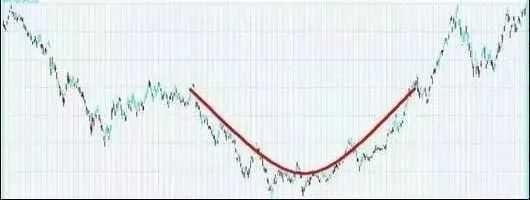
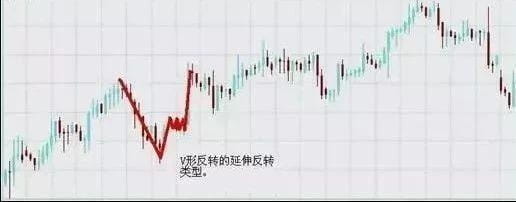
Sixth, V-shaped reversal and extended V-shaped reversal
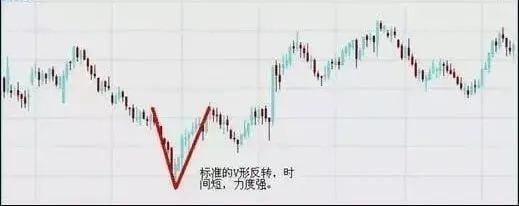
Downward phase: The left downward trend of the V shape is usually very steep and lasts for a short period.
Turning point: The bottom of the V shape is very sharp, and generally, the time to form this turning point is only three or two trading days, during which the trading volume significantly increases at this low point. Sometimes, turning points appear during panic trading days.
Rebound phase: The price then rises from the low point, and the trading volume also increases.
When the price breaks through the top of the extended V-shaped range, there must be an increase in trading volume; when it breaks below the bottom of the inverted extended V-shaped range, trading volume does not need to increase.
Pattern meaning:
Due to the strong selling power in the market, prices stabilize and continue to decline. When this selling force disappears, the buying force completely controls the market, resulting in a dramatic rebound in price, almost recovering all losses at the same speed as the decline; thus, the price movement on the chart forms a V-shaped trajectory.
The inverted V-shaped situation is just the opposite, as the market's optimistic sentiment causes prices to rise continuously, but an unexpected factor reverses the entire trend, with sellers dropping at the same speed as the rise, forming an inverted V-shaped trajectory. This pattern is usually caused by unforeseen factors and some informed investors.
Seven, expanding reversal type (trumpet shape)
After a period of rising, the price falls, then rises and falls again, with the rising high points being higher than the previous and the falling low points also lower than the previous low points. The entire pattern starts with narrow fluctuations, then expands both upwards and downwards. If we connect the highs and lows, we can draw a mirror-reflected triangle shape, which is the trumpet shape.
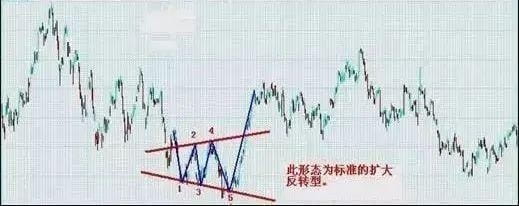
In terms of trading volume, the trumpet shape maintains high and irregular trading during the formation of the entire pattern. The trumpet shape is divided into rising and falling types, with the same meaning.
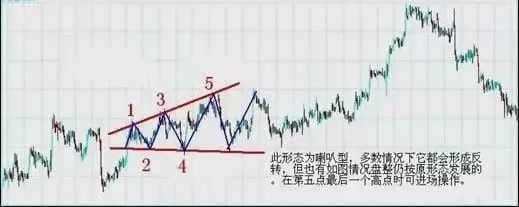
A standard trumpet shape should have three high points and two low points. Each of the three high points is higher than the last, while the two low points are lower than each preceding one; when the price falls back from the third high point to a lower point than the previous low, the establishment of the pattern can be assumed. Like the head and shoulders top, the trumpet shape belongs to the 'five-point reversal' pattern, therefore a gentler trumpet shape can also be regarded as a head and shoulders style trend with a higher right shoulder and a downward inclined neck line.
The trumpet shape is caused by investor impulses and irrational emotions, so it rarely appears at the bottom of a bearish market. The reason is that after a period of decline, investment willingness weakens, making it impossible to form this pattern in a depressed market atmosphere.
I am Ah Peng, having experienced multiple rounds of bull and bear markets, with rich market experience in various financial fields. Here, I penetrate the fog of information to discover the real market. Grasp more opportunities for wealth passwords, find truly valuable opportunities, and don't miss out and regret!
Ah Peng only does real trading, the team still has spots to jump in, hurry up #九月加密市场能否突破? $BTC$ETH

