🚀 Trader’s Eye Technical Analysis on ENA/USDT (4H Timeframe) 🚀
Currently, ENA/USDT is trading around 0.6702, showing signs of a potential bullish setup after consolidating within a defined range. Let’s break down the structure:
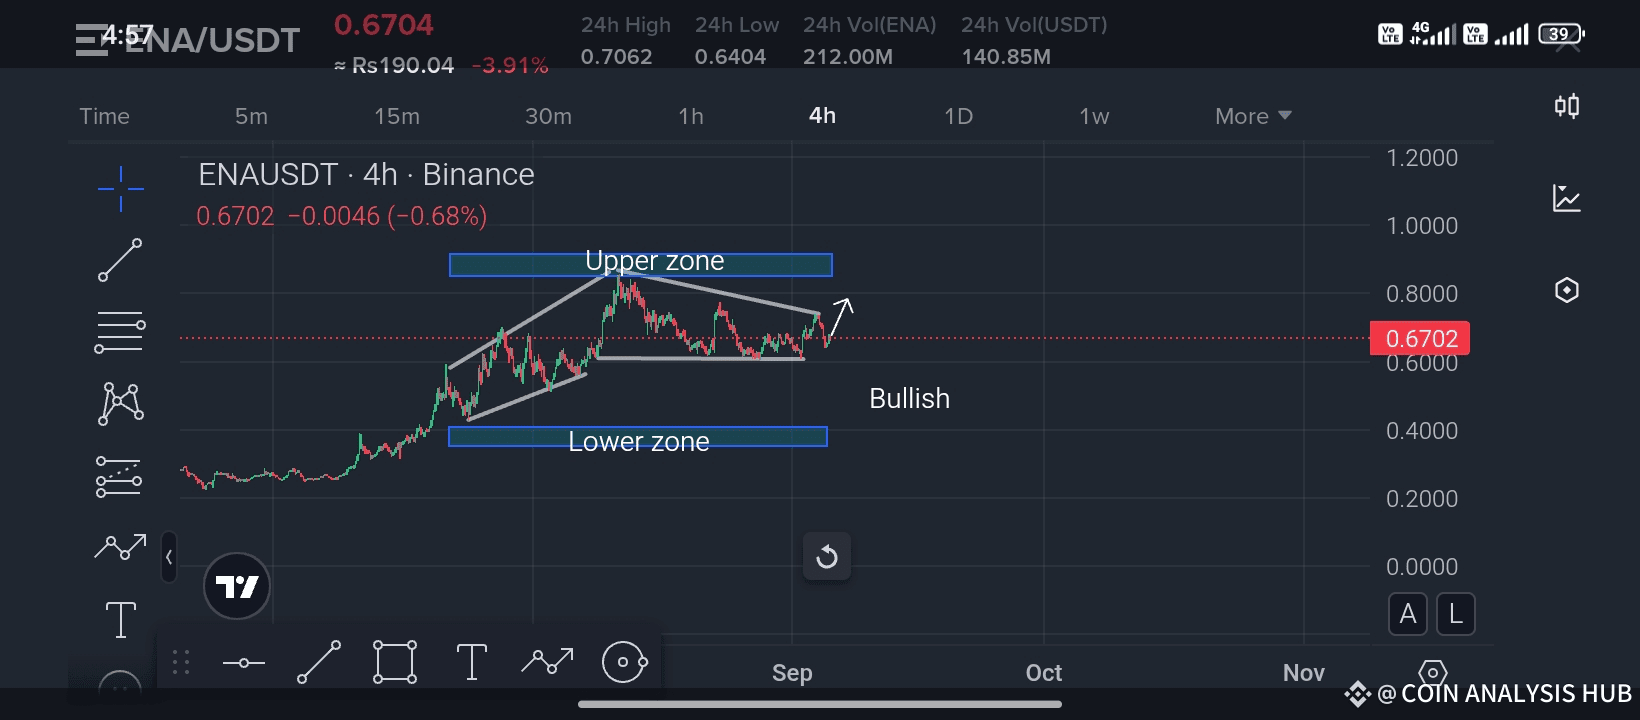
📊 Chart Observation:
Price has been moving inside a channel formation, bouncing between the upper zone (resistance) and lower zone (support).
The lower zone has been tested multiple times and is acting as a strong demand area.
After a correction from the upper zone, price is now attempting to push upward, indicating a potential breakout scenario.
The structure suggests that bulls are gradually regaining strength, and a move towards the upper zone could be the next target if momentum sustains.
🔥 Bullish Outlook:
As long as price holds above the lower zone, the bias remains bullish. If ENA/USDT breaks above near-term resistance, we could see momentum accelerating, targeting 0.75 – 0.80 levels in the coming sessions.
⚠️ Key Levels to Watch:
Support (Lower Zone): ~0.62 – 0.64
Resistance (Upper Zone): ~0.78 – 0.80
Breakout Point: A strong close above 0.70+ could trigger bullish continuation.
💡 Trader’s Tip:
Always wait for confirmation before entering. A breakout with strong volume is the safest entry. Manage your risk with stop-loss placement just below the support zone to protect capital.
✅ If you find this analysis useful, LIKE 👍, SHARE 🔄, and FOLLOW ✅ my channel for more real-time trader’s eye catching technical updates. Your support helps us grow and bring you more high-quality analysis every day!
#ListedCompaniesAltcoinTreasury
Best of luck 🤞 🍀 🤞
