Every morning, I first take my child to school, then come home to make breakfast. After eating, it's about 9:00; I turn on the computer and summarize yesterday's transaction records into my trading system, looking for opportunities. I operate several cryptocurrency trades simultaneously, usually around ten. From 9:30 to 10:50, I am generally the busiest, while the afternoon is less busy with fewer trading opportunities. If trading is thin, I won't stare at the computer and will rest my eyes.
In the afternoon, I generally go to the park or woods to run, then pick up my child from school, return home, and sometimes cook dinner myself or order takeout.
In the evenings, I usually just place some trades, spending more time sharing and answering questions. I also write reviews! If trading is thin or there's a one-sided decline with few trading opportunities, I drive to remote mountains or ponds to fish. As long as there’s mobile signal, I can trade on Binance while fishing, which is quite enjoyable. In short, it’s all about freedom.

In cryptocurrency investment, maintaining liquidity in the account, i.e., 'having coins in the market, money in the account, and cash in the pocket,' is an important safeguard against market uncertainty. Never go all-in; allocate funds reasonably, and master risk control. This not only stabilizes investment mindset but also effectively controls risks. Using spare cash for investment rather than borrowed capital is the foundation of investing. Master basic operational skills and thought processes, develop the habit of recording and summarizing, and treat the high and low data from each operation as valuable experience, gradually cultivating the ability to filter information and make decisions.
In addition to solid technical skills, I also adhere strictly to the following six rules: grasp the elements of successful investment!
As long as retail investors achieve the following six points, turning 100,000 into 5 million is not difficult. These six points seem simple, but very few can truly accomplish them. Here are the 'six rules' for guaranteeing success in the cryptocurrency world, helping you navigate the market with ease!
1. Understand stop-loss and take-profit; trading cryptocurrencies is for profit, not for holding indefinitely. When the position trends incorrectly, decisively sell to avoid unnecessary losses. In the cryptocurrency world, don't be greedy when making profits and don't hesitate when facing losses.
2. Do not pursue absolute highs and lows; the market always has lower lows and higher highs, which are difficult for ordinary people to accurately grasp. We just need to buy in the bottom area and sell in the top area, capturing the big trend.
3. Volume and price must perfectly match; rising without volume or new highs without volume often signal that the main force is offloading or that the rise is exhausting. It's better to miss out than to chase volume, avoiding becoming a bag holder.
4. Be quick to react; when the market has good news, quickly identify relevant sectors and projects. If you miss the first tier, promptly position in the second tier to achieve good returns.
5. Learn to rest; the main rising wave of cryptocurrency prices is very short, while the rest of the time is often volatile or in correction. Seize the main rising wave and learn to rest during other times to avoid losses from frequent trading.
6. A crash is the biggest good news; market crashes often harbor greater opportunities. When others are greedy, be fearful; when others are fearful, be greedy. When the market crashes, do not panic; choose quality assets to build positions in time and wait for a rebound.
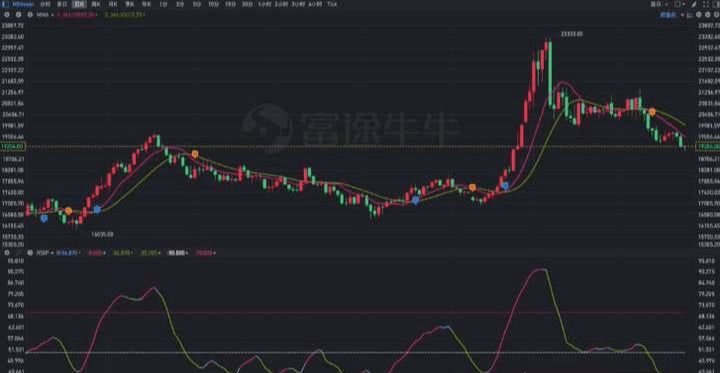
Bitcoin has skyrocketed, reviving some previous trading strategies. The simplest and most intuitive may be this MACD trading strategy dubbed 'the semi-divine strategy of the cryptocurrency world' which claims to yield four hundred times in a year.
It’s actually simple; it’s just about looking for opportunities of continuous divergence in MACD.
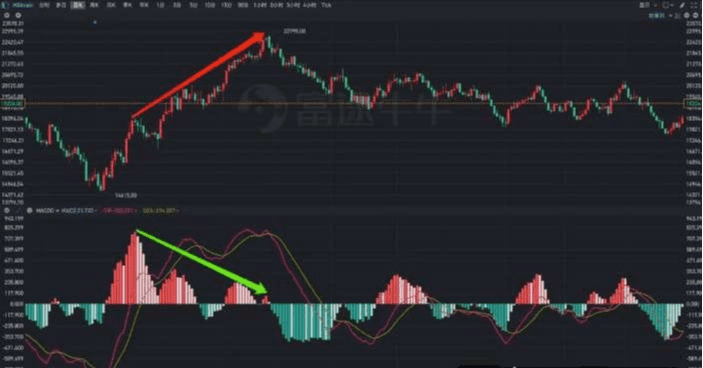
The image above is a very good example, fully illustrating the two core points of this trading strategy: continuity and divergence.
What constitutes continuity?
MACD is above the zero axis, and after reaching a peak, it does not drop below the zero axis, but rises again to produce another peak, or drops below the zero axis and quickly crosses back above to create a peak; this is called continuity.
What constitutes divergence?
The peaks of MACD are gradually decreasing, but the stock price is gradually rising, meaning the trend of MACD is inconsistent with the trend of the stock price, which is known as divergence.
Of course, inconsistent trends can be divided into two situations: when the indicator declines while the stock price rises, it is called a top divergence; when the indicator rises while the stock price declines, it is called a bottom divergence. #Bitcoin whale movements
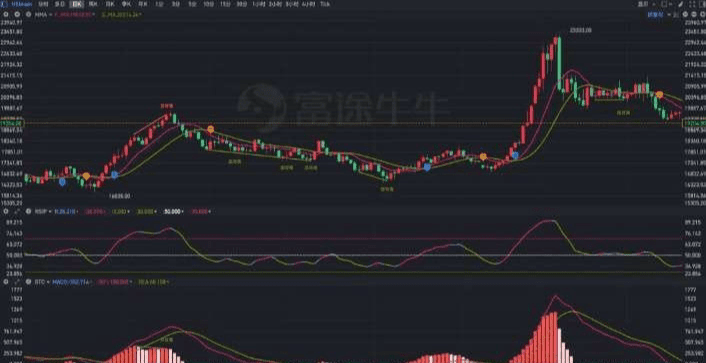
The image above is an example of top divergence; similarly, for the Hang Seng Index, a bottom divergence had already appeared before the trend began at 924.
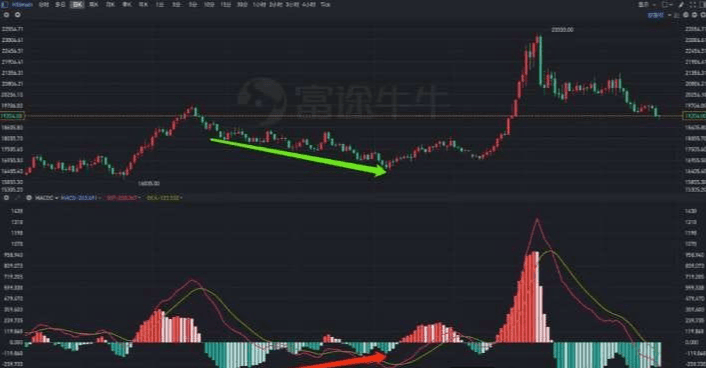
The semi-divine trading strategy is to seek these opportunities of continuous divergence in the MACD indicator.
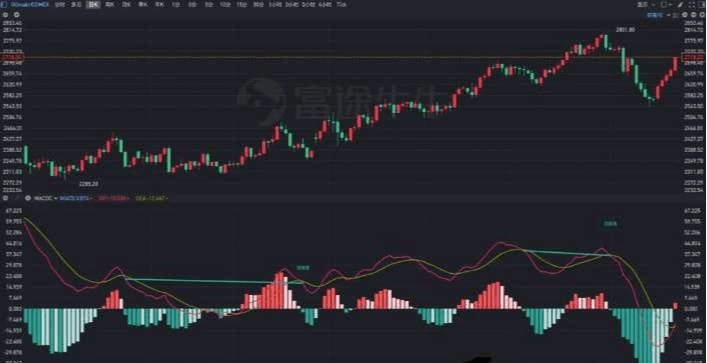
First, modify the MACD's default first two parameters from 12 and 26 to 13 and 34, then look for continuous divergences with significant differences between peaks and valleys, shorting at top divergences and going long at bottom divergences, and applying ATR with a parameter of 13 for stop-loss.
Causes of Divergence
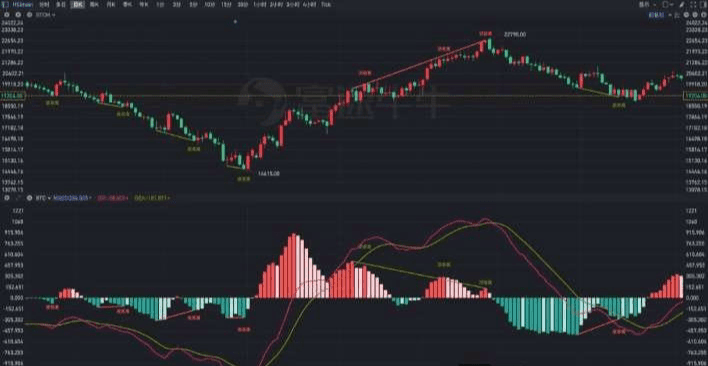
From the two screenshots above, it can be seen that shorting at a top divergence and going long at a bottom divergence are indeed good opportunities. Everyone can test this strategy on the assets they are interested in to see if it can capture some significant opportunities.
During this process, there may be two issues: first, the platform's native MACD indicator only includes fast and slow lines and a histogram, without adding divergence recognition, making it very inconvenient to verify the effectiveness of divergence signals when backtesting historical data; second, after backtesting data, it is likely to find that divergence signals are very effective, but bottom divergence is relatively more effective than top divergence.
How to solve the problem of identifying divergence signals will be discussed later. First, let’s analyze the causes of divergence and why bottom divergence signals are more effective. #Musk plans to establish the American Party
First, we need to look at the code of the MACD indicator to analyze the logic of its construction.
DIF: EMA(C, 12) - EMA(C, 26), COLORRED;
That's right, the original MACD indicator is that simple; implementing the so-called 'king of technical indicators' MACD only requires three lines of code.
The first line calculates the difference between two different time period moving averages based on the closing price and displays it as a curve;
The second line takes the average of the difference between the two moving averages calculated in the previous step and displays it as a curve;
The third line calculates the difference between the two and magnifies it, then displays it as a bar chart.
Thus, even if we have not studied the design principles of the MACD indicator, we can analyze the causes of divergence just from its code.
If a top divergence occurs, meaning the peaks of MACD are decreasing while the stock price is rising and making new highs, this indicates that the value of MACD is declining.
The value of MACD is obtained by subtracting DEA from DIF, hence it indicates that the gap between DIF and DEA is narrowing.
DEA is the average of DIF, indicating that DIF is gradually decreasing or the increase is slowing. Simultaneously, due to the smoothing effect of DEA, DIF's narrowing increase may still cause DEA to rise, leading to a reduction or even reversal in the difference between the two.
DIF is the difference between two moving averages of different periods. As DIF gradually shrinks or the increase slows, it indicates that the difference between the two moving averages is decreasing. The short-term moving average is sensitive, while the long-term moving average is smooth, hence the narrowing difference can be seen as the slope of the short-term moving average beginning to approach that of the long-term moving average.
The slopes of the short-term and long-term moving averages begin to converge, which could be due to two reasons: the stock price has fallen or the increase is small. The condition for a top divergence is that the stock price is still rising and making new highs, so the narrowing difference between the two actually indicates a diminishing increase, meaning a stagnation where the price cannot rise further. #Spot and contract strategies
The cause of bottom divergence can similarly be deduced to be a stagnation in falling; it cannot fall further.
After a long period of volatility, once a trend is formed, it is difficult to reverse. After a top divergence appears, some profit funds may cash out, but those who didn’t believe it at first and are just starting to believe are now entering the market. Although momentum has weakened, the trend remains, and after a top divergence, there can still be top divergences, potentially resulting in higher price peaks.
Similarly, after a bottom divergence appears, it is also possible to form lower lows. However, compared to rising, falling often takes a shorter time and a larger amplitude. Especially after several rounds of panic release, people become numb to negative news, and it feels like there’s no further drop possible. At this point, the remaining participants are mostly steadfast holders, coupled with the psychological advantage of buying at low levels, which often triggers a strong rebound, making bottom divergence signals more likely to realize.
Identifying Divergence
When the stock price makes a new high while the indicator does not, it is a top divergence, indicating a weakening of the bullish trend strength, and the market may reverse at the top; when the stock price makes a new low while the indicator does not, it is a bottom divergence, indicating a weakening of the bearish trend strength, and the market may reverse at the bottom.
Since it is a 'possible reversal,' it indicates a left-side trade. If trading contracts, it is understandable why the semi-divine strategy can achieve such high returns.
Of course, since it is a left-side trade, there could be situations where 'there are tops within tops, bottoms within bottoms, and divergence followed by divergence.' Thus, the semi-divine trading strategy specifically includes ATR-based stop-losses to avoid trading contracts against strong trends, which could lead to complete losses or liquidation risks.
It has both entry signals and stop-loss rules, which logically constitutes a fairly complete trading strategy. But the problem is, if we rely on the naked eye to identify continuous divergences in MACD, the efficiency will likely be very poor.
Although there are related indicators in TradingView to assist trading, there are few toolbox-like indicator tools in domestic trading software. Most just have flashy names, creating the illusion that one can make a guaranteed profit simply by trading based on indicator signals.
However, we all know that for different markets, different assets, and different times, the trading signals issued must be treated differently.
In a strong trend market, the KDJ indicator may remain in the overbought or oversold range; in a volatile market, the moving average indicators may frequently show golden and death crosses. Relying completely on a single signal may lead to losing everything after a period of time.
Therefore, technical indicators should actually be regarded as auxiliary tools, with their main function lying in improving efficiency. For example, if we can achieve automatic recognition of this pattern through technical indicators for continuous divergence in MACD, it would help us better grasp such opportunities.
There are three key points in recognizing divergence: triggering mechanism, time range, and judgment method. In previous articles, we have introduced a simple method for recognizing divergence.
This identification method is very simple, using MACD's golden and death crosses as the triggering mechanism, taking two golden/death crosses as the time range, and judging whether divergence has occurred based on the trends of DIF and stock prices at the time of golden/death crosses.
This actually belongs to a kind of opportunistic method; under normal circumstances, it can still be used roughly, but if you want to rely on the semi-divine trading strategy to identify signals, it is clearly incorrect.
For example, continuous top divergence refers to several gradually decreasing peaks, with no retracement to below the zero axis, or if there is a retracement below the zero axis, it only involves a few bars.
Therefore, its triggering mechanism requires first finding the peaks and then looking back at the previous peak's position, checking if there is any part below the zero axis between the two peaks, and if so, checking whether the number of bars below the zero axis exceeds the threshold; finally, judging if both peaks are descending while the corresponding stock price is still rising.
Similarly, continuous bottom divergence requires first finding a valley, then looking back to the previous valley, checking for any part above the zero axis between the two valleys, and if so, checking whether the number of bars above the zero axis exceeds the threshold; finally, judging if both valleys are ascending while the stock price is still declining.
Comparing to the screenshots given at the beginning of the article, we no longer need to manually draw lines to measure whether continuous divergence has occurred. Instead, we can use custom technical indicators to identify whether MACD has diverged in the sub-chart and connect peaks and valleys, while connecting the corresponding high or low prices of MACD's peaks and valleys in the main chart, making it easy to recognize divergence at a glance.
Of course, since it is a custom indicator, the conditions for continuous divergence can be set according to personal preferences; for example, whether two or three peaks and valleys must appear consecutively, the number of bars below the zero axis between peaks, and how much the difference between consecutive peaks and valleys needs to reach can all be adjusted.
Identifying Trends
Trading strategies based on divergence will enter the market when the trend has not been fully confirmed, exhibiting the characteristics of left-side trading. Therefore, stop-loss based on ATR is indispensable as an important part of the semi-divine trading strategy.
However, we can completely combine other technical indicators to further reduce the potential risks brought by left-side trading. MACD measures the strength of the trend, while the trend itself can naturally be measured using moving average indicators.
Generally speaking, most trends are identified based on the crossover of short-term and long-term moving averages. However, there is a significant issue: if the two time parameters are too close, the two moving averages may frequently cross, resulting in a lot of invalid signals; if the two time parameters differ too much, the timing of entry and exit will be seriously delayed.
Therefore, we can adopt this method: choose a personal favorite time parameter, and then select different moving average algorithms to obtain the fast and slow lines.
For example, we first calculate MA10 using the closing price and then calculate EMA10 of MA10, thus simulating the calculation principles of DIF and DEA to obtain two fast and slow lines. Then, we can set buy and sell signals based on the crossovers of these two lines.
Of course, this method, compared to traditional dual moving averages, although it only has one time parameter, inevitably faces the issue of filtering out invalid signals.
Most of the time, the market is in a state of volatility, so we can use whether it is overbought or oversold as a filter for moving average crossover signals.
For example, when the golden cross occurs for the dual moving averages, if the RSI indicator's value is in the range of 50-70 (above 70 is considered severely overbought, do not chase highs) and is rising, it is considered an effective long signal; when the dual moving averages show a death cross, if the RSI indicator's value is in the range of 30-50 (below 30 is considered severely oversold, do not chase lows) and is falling, it is considered an effective short signal.
At the same time, further restrictions can be placed on candlesticks, requiring the lowest price to be above the fast line when going long and the highest price to be below the fast line when going short. This way, the effect shown in the image below can be achieved.
Optimization and Iteration
Thus, we have constructed a trading strategy using the most basic technical indicators: moving averages, RSI/KDJ, and MACD.
For traders who are very patient and can trade contracts, options, or futures in pursuit of win rates, they can patiently wait for the appearance of continuous MACD divergence signals. Other traders can engage in short-term trades based on moving average crossovers filtered by RSI signals.
Moreover, the start of a trend must trigger a crossover of the dual moving averages, while the end of a trend often forms a MACD divergence.
Therefore, by combining them, we can observe when to take profits based on moving average crossover signals after going long or short using divergence signals; and after entering the market using left-side divergence signals, we can then use moving average crossover signals for right-side confirmation.
Thus, this is actually a complementary system; however, there is still significant room for improvement in terms of signal priority, compatibility of short-term and long-term trading, historical data backtesting, and parameter optimization.
Welcome to all cryptocurrency friends to provide more feedback during the use of indicators, so we can further optimize and iterate.
The current market is just at the bottom-building stage. If you have no direction, remember to follow my lead; standing on the shoulders of giants can save you ten years of detours!
I am Old Chen; follow me consistently, and I believe you will avoid many detours! I only share the most practical cryptocurrency trading tips. Thank you for your likes; I wish you success in the crypto world!
$ETH $BTC #现货黄金创历史新高


