📊 SOL/USDT Technical Analysis – 4H Chart (Traders’ Insight) 📊
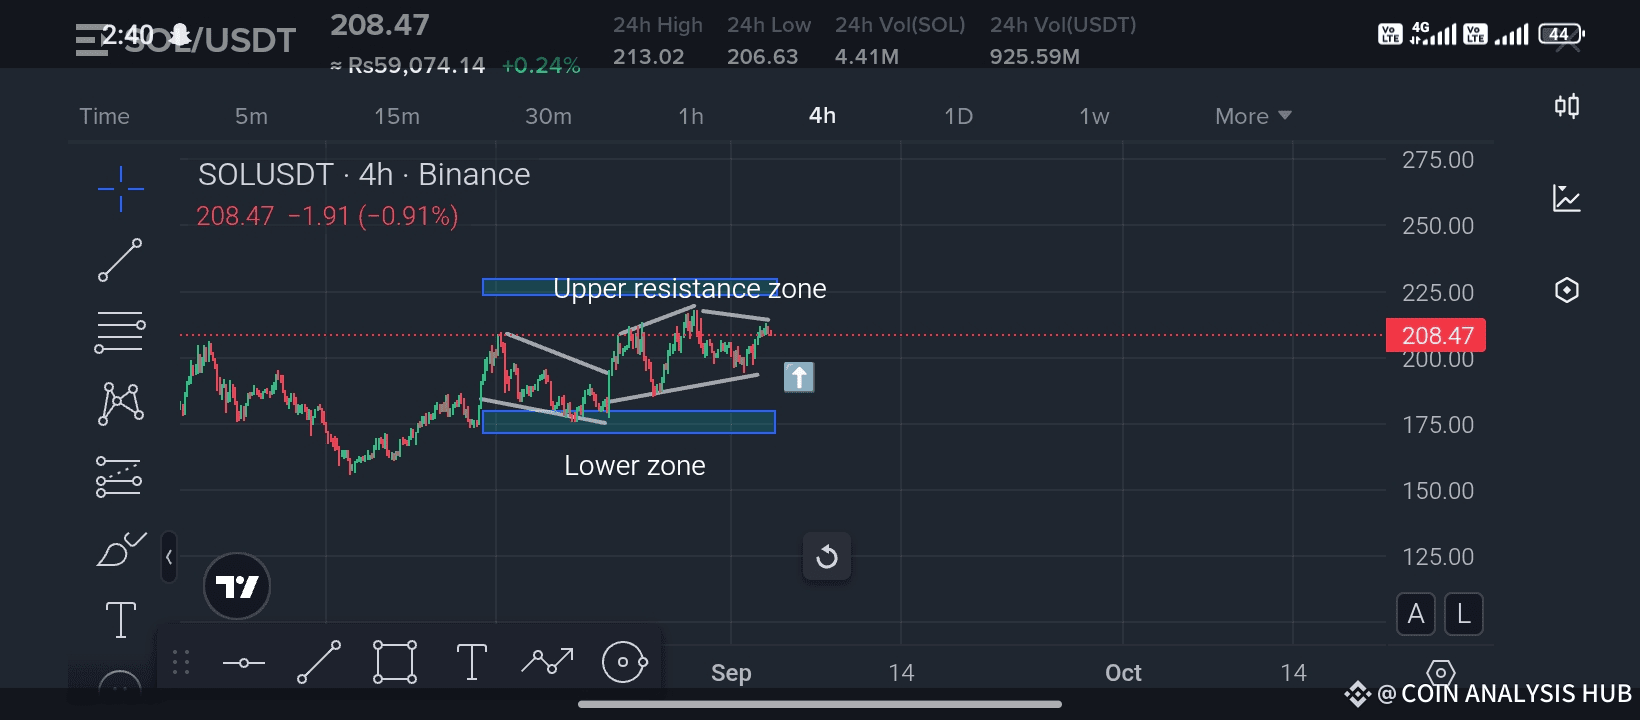
Currently, SOL is trading at $208.47, showing some consolidation after a recent rejection near the upper resistance zone. Let’s break this down from a trader’s technical perspective:
🔹 Upper Resistance Zone (~220–225):
This level has been tested multiple times, but SOL faces selling pressure each time it approaches this area. A strong breakout above this zone could ignite momentum and push SOL toward higher levels like $240–250.
🔹 Lower Zone (~185–190):
This area is acting as a safety net for buyers. Each dip into this zone is met with demand, showing strong accumulation.
🔹 Current Setup:
Price is moving within a tight wedge structure, compressing between support and resistance. Such consolidation often leads to a strong breakout move. Traders should keep a close eye on whether SOL breaks above 215–220 (bullish trigger) or falls below 200–195 (bearish pressure).
📈 Trading Outlook:
If SOL breaks above 220 with volume, expect a bullish continuation toward $240+.
If SOL loses support around 200, price may retest the lower demand zone near 185–190 before another bounce attempt.
💡 Trader’s Tip:
Always trade with confirmation – entering too early without a breakout can lead to false moves. Smart traders wait for price to show strength with volume before riding the trend. Risk management is the real edge – set your stop-loss wisely.
🔥 If you found this analysis valuable, don’t forget to LIKE, COMMENT, and SHARE this post. Your support helps this channel grow and keeps me motivated to bring you more real-time technical updates. Let’s keep winning together! 🚀
#ListedCompaniesAltcoinTreasury
Best of luck 🤞 🍀 🤞
