Making 100,000 from 10,000 in the crypto world is too easy; I can make more than this profit with just a few trades!
If your account is below 1 million and you want to profit in the short term in the cryptocurrency market, there is indeed a timeless trading strategy that is also a proven 'foolproof technique.' Small investors can easily understand and apply it; it is pure practical advice! There is no need to worry about whether you can learn it. If I can seize this opportunity, so can you. I am not a god, just an ordinary person. The difference is that others have overlooked this method. If you can learn this method and take it seriously in your future trades, it can help you earn an extra 3 to 10 percentage points daily.
In the cryptocurrency world, many newcomers may not know how to interpret the BOLL indicator techniques, and those who understand it only grasp it bit by bit. Few can discern details and technical patterns. As the saying goes, 'master one technique, conquer all,' mastering a technical analysis that one can comprehend is not difficult. The challenge lies in the reluctance to learn. Trading cryptocurrencies is for oneself, not for others. If you are willing to invest more effort to master it thoroughly, trading will not be as difficult as you imagine.
In addition to solid techniques, I also strictly adhere to the following six ironclad rules.
1. Select strong cryptocurrencies, using the 60-day line as a guide.
When trading cryptocurrencies, focus on those that perform strongly. If you are unsure, consider observing the 60-day moving average (the 60-day average line). When the price is above the 60-day line, it is a good time to consider buying or adding positions; once the price falls below the 60-day line, you should decisively exit. This tactic is often very effective.
2. Enter at low levels, avoid chasing highs.
When encountering cryptocurrencies that have risen more than 50% overnight, never rush to chase the highs, as this can easily lead to panic. Instead, choose to enter at lower levels, which carries relatively less risk and potentially greater returns.
3. Capture signals before a big rise
Before a significant rise in cryptocurrency prices, there are usually some signals. For instance, the prices may fluctuate within a relatively narrow range, possibly between 10% and 20%, while trading volume significantly decreases. At this time, you can slowly buy at lower levels, and you will likely catch the upcoming upward move.
4. Keep up with the new market hotspots
Whenever a new market hotspot emerges, the first few days are often very hot. This is a great time to seize profit opportunities. You can follow the flow of large funds to easily achieve profits.
5. Stay calm during bear markets.
Once in a bear market, control your hands and do not act rashly for at least six months. In unfavorable market conditions, reduce your operations and learn to rest. True experts understand the importance of resting at the right time.
6. Regular review and adjustment of strategies.
Every week, review your trading records, but focus not on how much money you've made, but on whether your trading strategy is correct. If the strategy is correct, stick with it; if it is wrong, adjust it in a timely manner. After several months, your cryptocurrency trading journey will become increasingly stable.
So how to successfully trade cryptocurrencies? Once a person enters the financial market, it is difficult to turn back. If you are currently experiencing losses and are still confused, but plan to treat cryptocurrency trading as a second career, you must understand the 'practical techniques of the BOLL indicator.' Comprehending and understanding can save you a lot of detours. This is all based on personal experience and feelings, and I recommend saving it for repeated reflection!
Topic: Practical techniques of the BOLL indicator
The practical techniques of the BOLL indicator mainly unfold from its buy and sell signals and holding signals.
(1) Buy and sell signals
1. When the stock price's candlestick breaks upward through the upper band of the Bollinger Bands, and the TRIX indicator has also issued a low-level 'golden cross,' it indicates that the stock price is about to enter a mid to long-term upward channel. This is a buy signal issued by the BOLL indicator. Investors should buy stocks in a timely manner.
2. When the Bollinger Bands have been moving in a narrow range at low levels for a long time, and once the stock price's candlestick breaks above the upper band with volume, while the previously narrow Bollinger Bands suddenly open upward, it indicates that the stock price is about to exit the original horizontal channel and enter a new upward channel. This is also a buy signal issued by the BOLL indicator.
3. When the stock price's candlestick breaks downward through the middle line of the Bollinger Bands, and the TRIX indicator also sends out a 'death cross' at a high position, it indicates that the stock price is about to enter a mid to long-term downward channel. This is a sell signal issued by the BOLL indicator. Investors should exit the market as soon as possible.
4. After the Bollinger Bands have undergone a long period of high level narrow horizontal movement, once the stock price's candlestick breaks downward through the lower band of the Bollinger Bands, and the previously narrow Bollinger Bands channel suddenly opens downward, it indicates that the stock price is about to exit the original horizontal movement channel and enter a new downward channel. This is also a sell signal issued by the BOLL indicator.
1. The concept of the Bollinger Bands BOLL indicator.
The Bollinger Bands (Boll) indicator calculates the stock price's 'standard deviation' and then seeks the 'confidence interval' of the stock price. This indicator draws three lines on the chart, where the upper and lower lines can be viewed as the stock price's pressure line and support line, with an average price line between the two. The best parameter setting for the Bollinger Bands indicator is 20. Generally, the stock price will operate within the channel formed by the pressure and support lines.
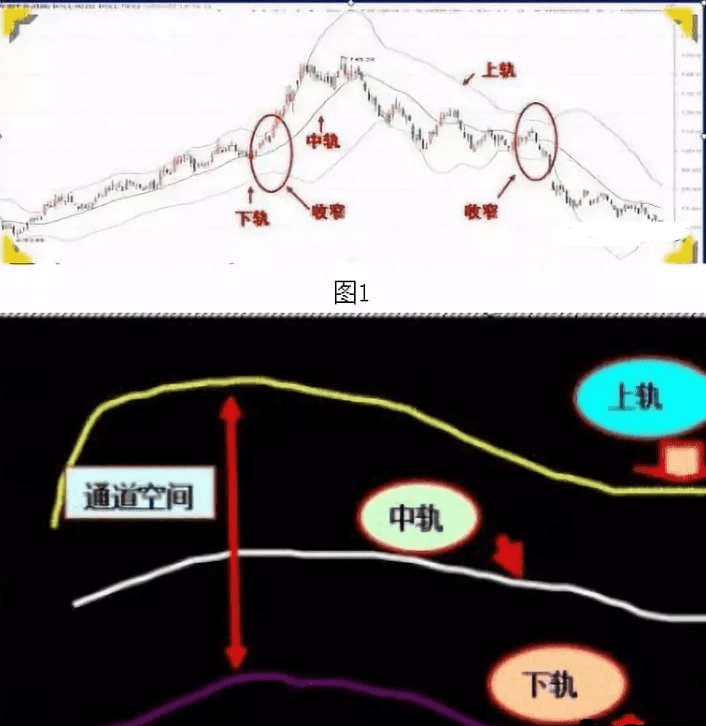
Figure 2
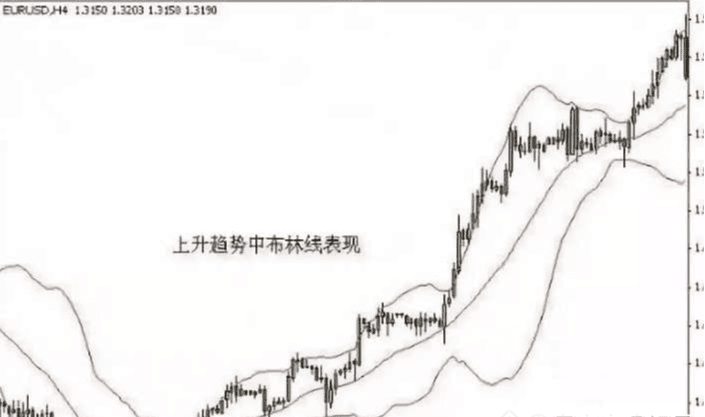
Figure 3
2. The functions of the BOLL indicator.
1. The Bollinger Bands can indicate support and resistance levels.
2. The Bollinger Bands can show overbought and oversold conditions.
3. The Bollinger Bands can indicate trends.
4. The Bollinger Bands have channeling functions.
Bollinger Bands are very effective and convenient to use due to their multiple functions. Once mastered, the signals are clear and the usage is flexible, making them popular among professional investors. They are also one of the most commonly used technical indicators in international financial markets.
3. Methods for using the BOLL indicator within the normal range.
The normal range typically allows the stock price to operate within a certain width, characterized by a lack of extreme rises or falls, maintaining a relatively balanced state. At this time, using the Bollinger Bands method is very simple.
1. When the stock price crosses the upper limit pressure line (dynamic upper limit pressure line, static upper limit pressure line BOLB1), it is a sell signal.
2. When the stock price crosses the lower limit support line (dynamic lower limit support line, static lower limit support line BOLB4), it is a buy signal.
3. When the stock price crosses upward through the middle boundary (static crossing from BOLB4 to BOLB3), it is an add position signal.
4. When the stock price crosses downward through the middle boundary (static crossing from BOLB1 to BOLB2), it is a sell signal.
4. The usage methods of the BOLL indicator in a unidirectional rising market.
In a strong market, stock prices continue to rise. Typically, the stock price operates between BOLB1 and BOLB2. When the stock price rises continuously for a long time, it breaks above BOLB1 and then falls below BOLB1 again, further breaking BOLB2, leading to a clear turning point from rising to flat. This is a sell signal.
5. The significance of the BOLL indicator's narrowing
1. After several waves of price decline, the stock price often transitions to a prolonged narrow consolidation. At this time, we find that the upper and lower limits of the Bollinger Bands are extremely small, becoming increasingly narrow and closer. During trading, the price differences between the highest and lowest prices are minimal, with little short-term profit space, often failing to even cover transaction fees. Trading is not active, and trading volume is sparse. Investors should pay close attention to this narrowing situation, as a significant trend may be brewing. Once trading volume increases and the stock price rises, the opening of the Bollinger Bands will widen, signaling the start of an upward trend.
2. If the Bollinger Bands at a high level have a severely narrowed opening, once the stock price breaks downward, an expansion of the Bollinger Bands will be inevitable.
6. The significance of the opening of the Bollinger Bands BOLL indicator
1. When the stock price rises from a low level through several waves, and the upper resistance line and lower support line of the Bollinger Bands open to the maximum extent but cannot continue to expand and instead begin to contract, this is a sell signal. Usually, the stock price closely follows with a significant decline or adjustment.
2. When the stock price has undergone several waves of significant declines, and the opening of the upper and lower limits of the Bollinger Bands cannot continue to expand, while the upper limit pressure line of the Bollinger Bands starts to contract from above, and the lower limit support line subsequently contracts from below, a downward trend will end.
7. Precautions for using the Bollinger Bands BOLL indicator
1. The parameters of the Bollinger Bands should not be set lower than 6. The static money dragon setting is usually 10; the dynamic money dragon setting is typically 20.
2. When using the Bollinger Bands, it is important to determine whether it is in a normal zone or an abnormal zone. In an abnormal zone, do not simply sell upon breaking the upper limit. Buy on breaking the lower limit.
3. Using the opening narrowing method can easily capture bull stocks at low levels, but at high levels or once the opening narrows, the stock price may break downward, often leading to significant downward potential.
4. The Bollinger Bands can be used in conjunction with other indicators for better results, such as trading volume, KDJ indicators, etc.
The usage of the funnel shape of the BOLL indicator
The usage methods of the Bollinger Bands BOLL indicator and the funnel shape are mainly based on the directional movements of the upper, middle, and lower lines of the Bollinger Bands to assess the stock price's trend. It can be divided into three situations: opening funnel, narrowing funnel, and closing funnel based on the movement patterns of the Bollinger Bands.
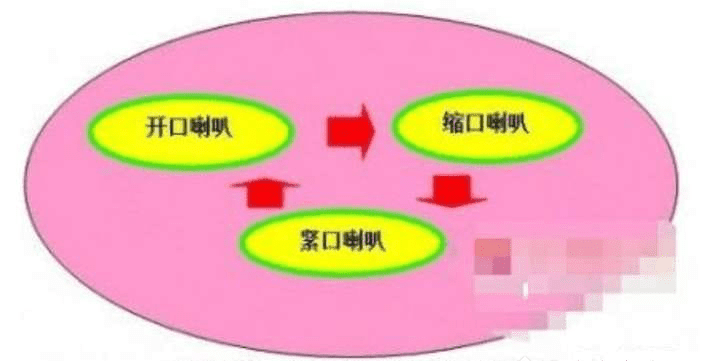
Figure 4
1. Opening funnel - acceleration upward phase
After the stock price has undergone a long-term downward consolidation, the upper and lower lines of the Bollinger Bands gradually narrow, and the distance between the upper and lower bands becomes smaller. As the trading volume gradually increases, the stock price suddenly experiences a rapid surge. At this time, the upper band of the Bollinger Bands sharply rises, while the lower band accelerates downward, forming a shape similar to a large funnel between the upper and lower bands. This is the opening funnel.
Once this occurs, it indicates the arrival of a major reversal trend. Such stocks, when they rise, will not just end with a 20% gain; at least a double return is required before one can withdraw. The analysis of Bollinger Bands also applies to the broader market.
Key points:
1. The greater the stock price decline, the longer the volume contraction consolidation platform, the greater the future potential.
2. The smaller the distance between the upper and lower bands, the greater the potential amplitude for future increases.
3. There must be significant volume at the opening.
4. Strong pullbacks cannot effectively break below the middle band.
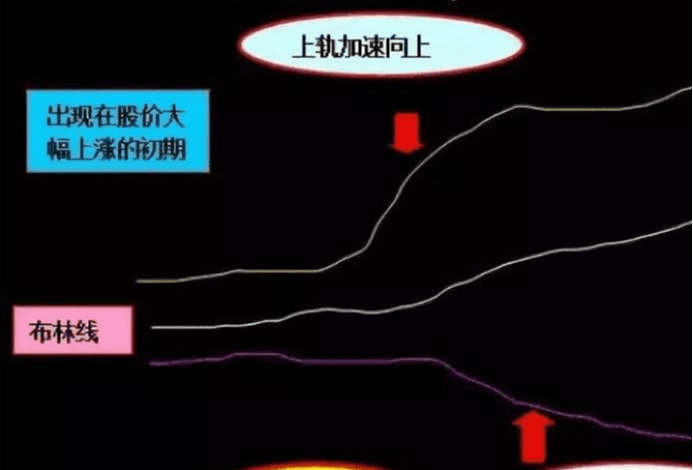
Figure 5
2. Narrowing funnel - acceleration downward phase.
After the stock price has experienced a short-term significant rise, the lower and upper lines of the Bollinger Bands gradually expand, and the distance between the upper and lower bands becomes larger. As trading volume gradually decreases, the stock price suddenly experiences a rapid decline at a high level. At this time, the upper band of the Bollinger Bands begins to turn sharply downward, while the lower band is still accelerating upward. This is the narrowing funnel.
The formation of a narrowing funnel at least indicates that the stock price has entered a downward trend. Once a large bearish candlestick effectively breaks through the middle band, it indicates that the short-term exit is necessary to avoid risks.

Figure 6
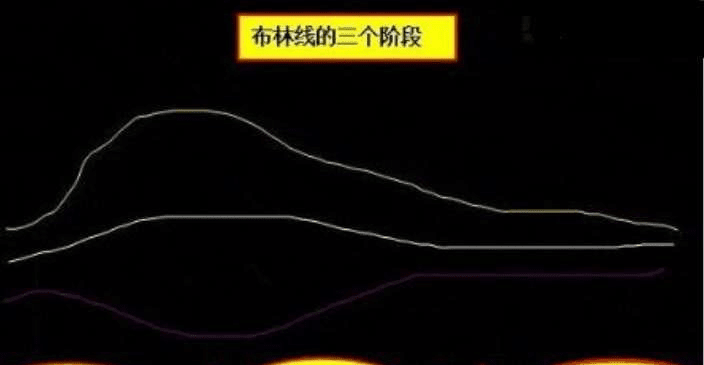
3. Closing method - horizontal consolidation phase
The closing funnel and the horizontal Bollinger Bands pattern are similar, appearing during the bottom formation phase, with clear characteristics that are easy to identify: the upper and lower bands of the Bollinger Bands start to converge toward the middle band, indicating that the adjustment is nearing its end.
The function of the BOLL indicator.
The Bollinger Bands indicator (BOLL) calculates the stock price's 'standard deviation' and then determines the 'confidence interval' of the stock price. This indicator draws three lines on the chart, where the upper and lower lines can be seen as the pressure line and support line of the stock price, and between these two lines is the average price line. It is best to set the parameters of the Bollinger Bands indicator to 20. Generally, the stock price will operate within the channel formed by the pressure and support lines.
Here we mainly talk about the predictive function of the Bollinger Bands indicator. Although indicators like KDJ and MACD can signal buy signals through upward crossovers at low levels or sell signals through downward crossovers at high levels, these indicators have a drawback: they can lose effectiveness or produce false signals during price consolidation, leading to losses for investors. Typically, during the consolidation phase, investors most want to know when the price will consolidate before a trend emerges. If stocks are bought too early and do not rise, the utilization of funds will decrease, and investors will also bear the risk of price declines. The Bollinger Bands indicator can play its magical role at this time, providing accurate indications for the end of consolidation, preventing investors from buying stocks too early.
General judgment standards for the BOLL indicator
(1) The significance of the upper, middle, and lower lines of the BOLL indicator
1. The movement range of the price channel formed by the upper, middle, and lower lines of the BOLL indicator is uncertain, as the upper and lower limits of the channel change with the stock price's fluctuations. Under normal circumstances, the stock price should always remain within the price channel. If the stock price deviates from the price channel, it indicates that the market is in an extreme state.
2. In the BOLL indicator, the upper and lower bands of the price channel indicate the highest and lowest price levels for safe operation. The upper, middle, and lower bands can all support the stock price's movement, while the upper line and middle line can sometimes exert pressure on the stock price's movement.
3. Generally, when the stock price is operating above the middle line of the BOLL, it indicates that the stock price is in a strong trend; when the stock price operates below the middle line of the BOLL, it indicates that the stock price is in a weak trend.
(2) The relationship between the upper, middle, and lower lines of the BOLL indicator
1. When the upper, middle, and lower lines of the Bollinger Bands are all moving upward, it indicates that the stock price's strong characteristics are very obvious, and the stock price will continue to rise in the short term. Investors should firmly hold their stocks or buy on dips.
2. When the upper, middle, and lower lines of the Bollinger Bands are all moving downward, it indicates that the stock price's weak characteristics are very evident, and the stock price will continue to decline in the short term. Investors should firmly hold cash and observe or sell on rallies.
3. When the upper line of the Bollinger Bands is moving downward while the middle and lower lines are still moving upward, it indicates that the stock price is in a consolidation state. If the stock price is in a long-term upward trend, it indicates a strong consolidation during the upward move, and investors can hold their positions or buy on dips short term; if the stock price is in a long-term downward trend, it indicates a weak consolidation during the downward move, and investors should primarily hold cash or reduce their positions on rallies.
4. The possibility of the upper line of the Bollinger Bands moving upward while the middle and lower lines move downward is very small.
5. When the upper, middle, and lower lines of the Bollinger Bands are almost simultaneously moving horizontally, it is necessary to assess the current trend of the stock price to make a judgment.
(1) When the stock price has been in a long-term downward trend and the three lines of the Bollinger Bands start moving horizontally, it indicates that the stock price is in the process of forming a bottom. Investors can start building positions in small amounts, and if the three lines diverge upward, they can increase their buying strength.
(2) When the stock price has previously been in a slight upward trend and the three lines of the Bollinger Bands begin to move horizontally, it indicates that the stock price is in a consolidation phase. Investors can hold their stocks for an increase or buy on dips short-term. Once the three lines diverge upward, they can increase their short positions.
(3) When the stock price has just experienced a significant decline and the three lines of the Bollinger Bands start moving horizontally, it indicates that the stock price is in a downward consolidation phase. Investors should mainly hold their positions and reduce their holdings on rallies. Once the three lines diverge downward, they should decisively exit the market.
(4) The possibility of the three lines of the Bollinger Bands moving horizontally at the top is extremely low.
(3) The relationship between the US line and the three lines of the BOLL indicator
1. When the US line breaks above the middle band of the Bollinger Bands from below, it indicates the emergence of strong characteristics in stock prices, and the stock price will rise. Investors should primarily buy stocks for the medium to long term.
2. When the US line breaks upward through the upper band of the Bollinger Bands, it indicates that the strong characteristics of the stock price have been established, and the stock price may experience a significant short-term increase. Investors should mainly hold stocks for a rise or buy short-term on dips.
3. When the US line breaks upward through the upper line of the Bollinger Bands, and the direction of movement continues upward, if the upper, middle, and lower lines of the Bollinger Bands also move upward simultaneously, it indicates that the strong characteristics of the stock market still persist, and the stock price will continue to rise in the short term. Investors should firmly hold their stocks until signs of a downturn appear in the direction of the US line.
4. When the US line has been moving upward for a period of time, if the direction of movement starts to turn downward, investors should be particularly cautious. Once the US line turns downward and breaks through the upper band of the Bollinger Bands, it indicates that the short-term strong trend may end, and the stock price may significantly decline in the short term. Investors should sell stocks and exit the market in a timely manner, especially for those stocks that have experienced substantial short-term gains.
5. When the US line breaks downward through the upper band of the Bollinger Bands, if the upper, middle, and lower lines of the Bollinger Bands also begin to move downward, it indicates that the short-term strong trend of the stock price is about to end, and the short-term trend of the stock price is also not optimistic. Investors should primarily reduce their holdings on rallies.
6. When the US line breaks downward through the middle band of the Bollinger Bands, it indicates that the previous strong trend has ended and a mid-term downward trend has formed. Investors should sell their stocks in a timely manner. If the upper, middle, and lower lines of the Bollinger Bands also move downward simultaneously, it further confirms this.
7. When the US line breaks downward through the lower band of the Bollinger Bands and continues downward, it indicates that the stock price is in an extremely weak trend. Investors should primarily hold cash and observe, avoiding buying stocks.
8. When the US line is consistently above the middle line and moves upward together with the middle line, it indicates that the stock price is in a strong upward process. As long as the US line does not fall below the middle line, investors can continue to hold their stocks.
9. When the US line is consistently below the middle line and moves downward with the middle line, it indicates that the stock price is in a weak downward process. As long as the US line does not reverse upward and break through the middle line, cautious investors can observe.
The special analytical methods of the BOLL indicator.
The analysis of the 'funnel' of the Bollinger Bands is a unique assessment method of the BOLL indicator. The so-called 'funnel' of the Bollinger Bands refers to a special shape similar to a funnel formed during the price movement process, where the upper and lower bands of the Bollinger Bands expand or contract significantly from two opposite directions relative to the middle band. Based on the different directions and positions of the upper and lower bands, we can further classify the 'funnel' into three types: opening funnel, closing funnel, and narrowing funnel.
(1) Opening type funnel
The opening funnel shape often appears at the beginning of a short-term surge in stock prices. It requires two conditions to form:
1. Stock prices must undergo a long period of horizontal consolidation at medium to low levels. The longer the consolidation time, the smaller the distance between the upper and lower bands, and the greater the potential future rise.
2. When the Bollinger Bands start to open, there must be a significant increase in trading volume.
(2) Closing-type funnel
The closing-type funnel shape often appears at the beginning of a stock's sharp decline. Although the formation does not require specific trading volume, it must meet one condition: the stock price has undergone a significant short-term rise beforehand. The greater the rise, the larger the distance between the upper and lower bands, the greater the potential future decline.
(3) Closing type funnel.
Closing-type funnel shapes appear at the end of a significant price drop. The formation conditions and confirmation standards are relatively lenient. As long as the stock price has undergone a long period of significant decline, with extremely reduced trading volume and the distance between the upper and lower bands becoming smaller, it can be recognized as the initial formation of a closing-type funnel. Once a closing-type funnel appears, investors can choose to observe and wait or build small positions.
The BOLL indicator consists of four lines: the upper band (UPPER), middle band (BOLL), lower band (LOWER), and price line. The upper band (UPPER) is represented by a yellow line; the middle band (BOLL) is represented by a white line; the lower band (LOWER) is represented by a purple line; the price line is represented by the US line and is light blue.
Buying techniques
(1) Generally, when the stock index drops from the upper band back to the lower band, or rises from the lower band back to the upper band, it indicates a gradual exhaustion of the strong upward momentum into a general oscillation momentum, because there is a need for consolidation after breaking through the resistance level.
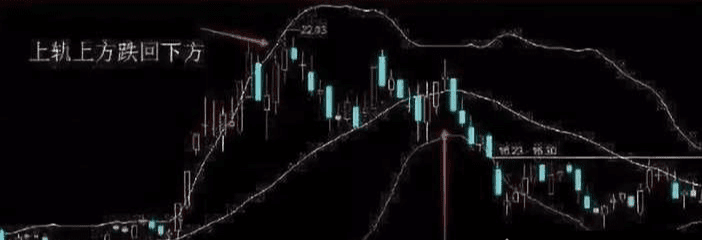
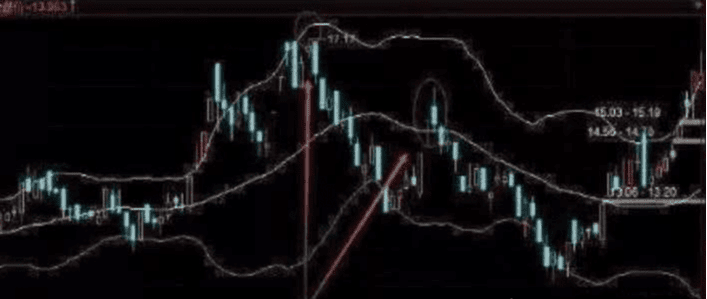
At this time, if prices rise again to create new highs or fall to new lows but cannot effectively return to the strong area, it indicates that the first type of buy and sell point has appeared. As shown in the image below, if new highs are created and touch the upper band but do not return to the strong area, it indicates a sell point, and consideration should be given to reducing positions or selling.
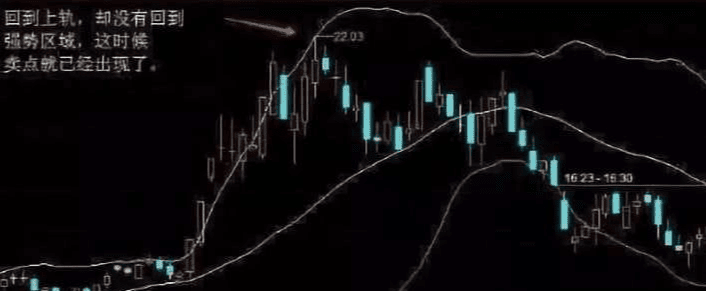
2) Considering that indicators may have delays, the first buy and sell points are not necessarily accurate. We can wait for the first pullback to rise again, or after a rebound, observe the Bollinger Bands to respond. At this time, the turning points of the upper and lower bands often become the biggest resistance and support for the index, helping us identify suitable buy and sell points.
However, this is just a simple theory.
If we combine the buy and sell points indicated by BOLL with the MACD indicator for verification, the accuracy rate is almost 99% once they resonate. If we also incorporate the central level and trend, we can achieve 100% accuracy.
This concludes the sharing for this article!
No matter how diligent a fisherman is, he will not go out to sea in stormy weather, but will carefully guard his boat. This season will eventually pass, and sunny days will come! Follow Lao Chen, who teaches you both fishing and the art of fishing. The cryptocurrency market is always open, and only by going with the flow can one have a smooth life. Save this and keep it in mind!
$ETH $BTC #现货黄金创历史新高


