Let me share my story: from a loss of 3 million to a profit of over 40 million, this is not just a financial success but also a significant improvement in mindset, strategy, and execution.
If you are also confused in the cryptocurrency world, remember: investing is a marathon, not a sprint. Rather than chasing short-term profits, it is better to settle down and learn true value. May my story + technology inspire you.
Investing is a game of human nature.
If you cannot control your emotions, you cannot become a consistent winner in the market. Perhaps if you are not careful, you will be eliminated by the market.
In fact, trading is simple; the complexity lies in human nature. Excellent speculators are always waiting, always patient, waiting for the market to confirm their judgments.
Remember, do not fully trust your judgment until the market itself confirms your view.
Quietness is both a sedimentation of time and an ability to generate wealth.
When first entering the market, everyone's heart is on fire, filled with passion, because this is a golden world where everyone longs for the chance to become rich overnight.
When facing setbacks, most of us build a bookshelf filled with books on how to trade, reading them from beginning to end, day after day, carefully.
When trading has not improved, looking at these accumulated trading methods fills my heart with doubt, accompanied by memories of trading and loneliness.
Perhaps day by day, year by year, I am no longer the 'youth' who just entered the market. Later, I found that the longer I traded, the more knowledge I gained, and the heavier and more tedious it felt.
Unload your burdens, make yourself light; this is suddenly the most desired thing after trading for many years. Because of the time spent along the way, returning makes you begin to feel quiet. #Spot Gold Hits an All-Time High
Many experts in the cryptocurrency world realize after enlightenment that trading coins is quite simple, while many retail investors believe that those who make money in trading coins have done so through countless hours of learning and losses. It’s normal for them not to want to teach others, and the shared insights are often not core! I understand this; in fact, I have worked hard to share core experiences, but even if they understand it, they may not necessarily believe it, and even if they believe it, it’s very difficult to implement. When the timing is right, enlightenment will come naturally.
So how to trade coins well? Once a person enters the financial market, it is difficult to turn back. If you are currently losing but still confused and plan to treat trading coins as a second career, you must understand the 'candlestick strategy.' Understanding it deeply can save you from taking many detours, all based on personal experience and feelings; I recommend saving and repeatedly contemplating it!
Candlestick charts are one of the most commonly used and intuitive technical analysis tools in financial markets. They not only present price movement trends but also reveal the underlying emotions and trends of the market through various candlestick combinations, helping investors more accurately predict future price movements.
In this article, we will delve into some common candlestick patterns and analyze the market psychology and potential trend signals these patterns reflect. Whether you are a novice in candlestick analysis or an experienced trader, mastering this foundational knowledge will play an important guiding role in your trading decisions. #Strategy Increase Bitcoin holdings
What are Candlestick Patterns?
Candlestick patterns are formed by two or more candlesticks. As price fluctuations settle over time, they form one candlestick after another, and when two candlesticks are combined, it creates a candlestick pattern. However, it is important to note that not just any two candlesticks combined constitute a candlestick pattern.
Only when specific candlestick combinations come together can they be called candlestick patterns. These specific combinations represent the overall emotional signals of the market, used to identify potential trends and imminent trend changes. Candlestick patterns effectively compensate for the shortcomings of individual candlesticks, which are easily affected by sudden events.
Generally, candlestick patterns are divided into two main categories:
Continuation Pattern
Reversal Pattern
Two candlesticks can bring us important reversal signals, such as engulfing patterns or harami patterns, indicating a sudden change in market sentiment. Three or more candlesticks can confirm reversal signals, such as morning stars or evening stars, and these patterns composed of multiple candlesticks have higher confirmatory power.
Continuation Candlestick Patterns
Continuation candlestick patterns refer to those that show the existing trend of the market may continue. These combinations typically appear in a clear trend, serving as signals for further trading.
For example, in an uptrend, even if there is a brief pullback, if the subsequent candlestick patterns indicate that the trend will continue to rise, this is a continuation pattern.
Continuation patterns can be divided into bullish and bearish types. Next, we will introduce what bullish continuation candlestick patterns and bearish continuation candlestick patterns are. #Listed Companies Hoarding Coins
Bullish Continuation Candlestick Patterns
How to view it?
In this section, we will introduce two continuously bullish trend continuation pattern combinations. When these combinations are observed, we can infer that the uptrend may continue to be bullish. These two pattern combinations are Three White Soldiers and Rising Three Methods.
1. Rising Three Methods
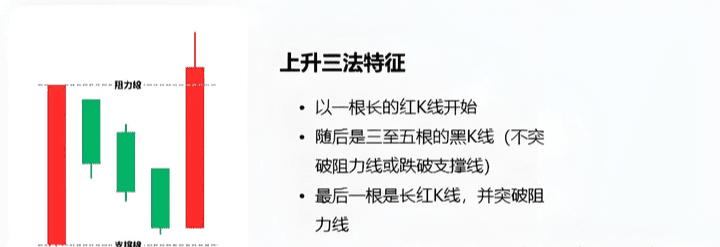
The Rising Three Methods reflect the contest between bulls and bears in the market. After the appearance of the first large bullish candlestick, bullish forces drive prices upward. The subsequent few small bearish or bullish candlesticks represent a short-term adjustment in the market, during which bearish forces attempt to suppress prices but are relatively weak.
When the last large bullish candlestick appears, it indicates that bulls have regained control, and prices are likely to continue rising.
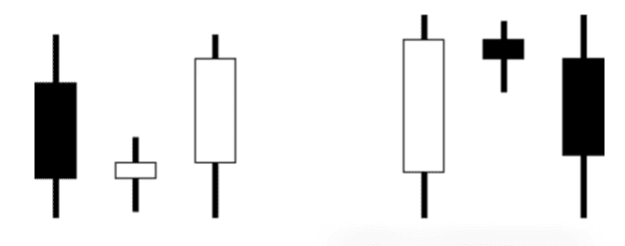
2. Bullish Separating Line
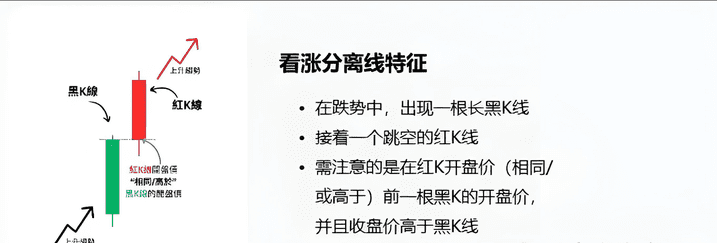
The bullish separation pattern reflects the contest between bullish and bearish forces in the market and the ultimate victory. In an uptrend, the first bearish candlestick indicates that bears are trying to suppress the market through a pullback, but it fails to sustain. The next day, bulls quickly counterattack, bringing prices back to the opening price of the previous day and pushing prices further up.
This indicates that bullish forces are very strong, market sentiment remains positive, and a short-term pullback will not change the upward trend of the market. This pattern often leads traders to feel that market sentiment remains optimistic, suggesting that the uptrend will continue.
Bearish Continuation Pattern
How to view it?
In this section, we will introduce two continuously bearish trend continuation pattern combinations. When these combinations are observed, we can infer that the downtrend still has signals to continue downward. These two pattern combinations are Three Black Crows and Falling Three Methods.
1. Falling Three Methods
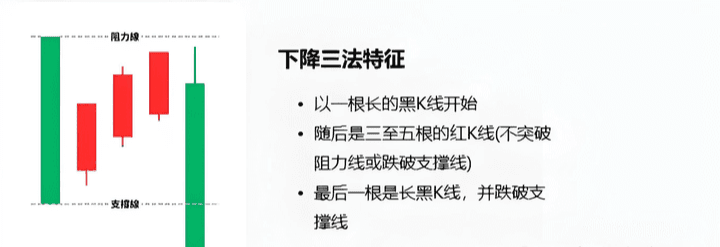
The Falling Three Methods reflect the contest between bulls and bears in the market. In a downtrend, bearish forces dominate, and the market experiences a brief rebound after a long bearish candlestick. However, this rebound lacks strong buying support, leading prices to fail to break through previous highs.
As the rebound ends, bearish forces strengthen again, prompting further price declines.
2. Bearish Separating Line
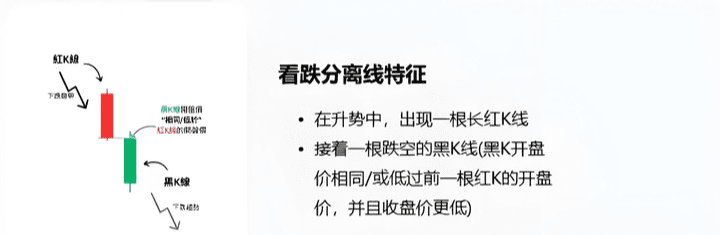
The bearish separation pattern reflects the dominant position of bearish forces in the market. The first bullish candlestick may mislead market participants into thinking the downtrend is about to end, with buying power temporarily strengthening, but the second bearish candlestick indicates that bears quickly regain control, and prices fall again.
This pattern usually makes traders realize that a brief rebound is merely a correction and does not change the overall downtrend. This pattern shows that market sentiment rapidly shifts from optimistic attempts to rebound to pessimistic, and prices are likely to continue falling.
Reversal Candlestick Patterns
Reversal candlestick patterns refer to those that indicate the market trend may be ending and about to enter a reversal trend. This type of combination usually appears in resistance or support zones on the chart.
If a reversal candlestick pattern appears on the chart during a downtrend and shows strong buying signals, it may indicate that the downtrend is about to end and turn upward.
Next, we will introduce what bullish reversal candlestick patterns and bearish reversal candlestick patterns are.
Bullish Reversal Candlestick Patterns
How to view it?
In this section, we will introduce six bullish reversal pattern combinations. When these combinations are observed, we can infer that the downtrend may have ended. These six pattern combinations are bullish engulfing pattern, piercing line, bullish harami, bullish separation pattern, tweezer bottom, and morning star.
1. Three White Soldiers
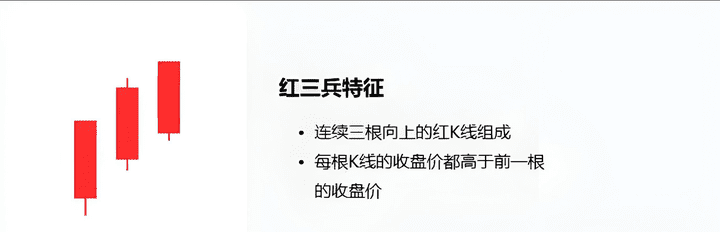
Three White Soldiers usually appear at the end of a downtrend, serving as a very strong reversal signal, indicating that market sentiment shifts from pessimism to optimism. When three consecutive bullish candlesticks appear, investors generally believe that the buying power in the market has begun to dominate, and bearish forces are gradually depleted, suggesting that the market may soon enter an uptrend.
2. Bullish Engulfing Pattern
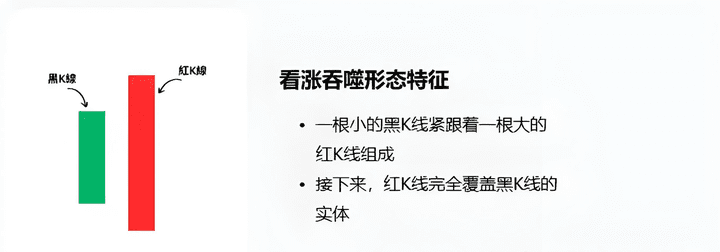
The bullish engulfing pattern reflects a rapid change in market sentiment. When the market is in a downtrend, the first bearish candlestick indicates that bears still hold the upper hand, and selling pressure is strong.
However, the bullish candlestick on the second day suddenly reversed the situation, significantly strengthening bullish forces, covering the previous day's losses, and closing at a price higher than the opening price of the previous candlestick, showing the bulls' regained control over the market.
3. Piercing Line
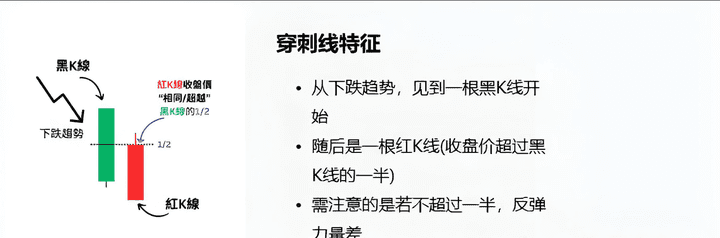
The Piercing Line reflects the contest between bulls and bears in the market. In a downtrend, the first bearish candlestick indicates that bearish forces are still strong, and market sentiment is generally pessimistic. However, the next day after the market opens, although prices initially continue to fall, bullish forces gradually strengthen, ultimately pushing prices higher and closing above the midpoint of the previous bearish candlestick.
This shows that bulls are beginning to take control of the market, bearish forces are weakening, and the market may soon reverse.
4. Bullish Harami
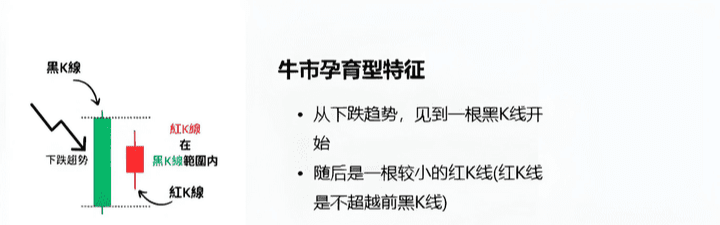
The bullish harami reflects the change in the balance of forces between bulls and bears in the market. In a downtrend, the first long bearish candlestick indicates that bears still dominate the market, and market sentiment is generally pessimistic. However, the appearance of the second small bullish candlestick indicates that the downward momentum is weakening, and bulls are beginning to enter the market, attempting to prevent further price declines.
Although the second candlestick is relatively small, its existence shows the market's hesitance, and the bearish forces are beginning to weaken. Such a pattern often indicates that the market may be about to reverse, especially at the end of a downtrend, where investor sentiment may gradually shift from pessimism to optimism.
5. Tweezer Bottom
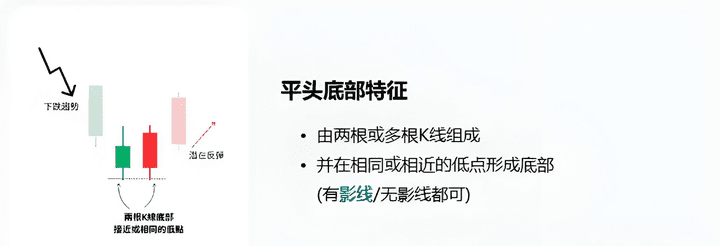
The Tweezer Bottom pattern reflects subtle changes in the balance of forces between bulls and bears in the market. In a downtrend, the first long bearish candlestick shows strong bearish power, and market sentiment is very pessimistic. However, the second candlestick, whether bearish or bullish, has its lowest price the same as or close to the previous day, indicating strong support at this price level, weakening bearish forces, and bulls beginning to enter the market, showing a decline in downward momentum.
This pattern often leads traders to feel that the market's decline is nearing its end, a support level may form, and prices may begin to rebound or reverse upwards.
6. Morning Star
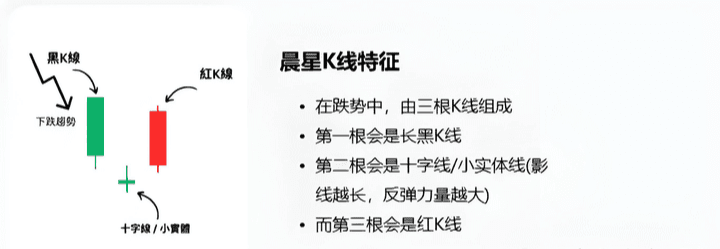
The morning star pattern reflects the gradual change in market sentiment. In a downtrend, the first long bearish candlestick represents strong bearish forces, and market sentiment is pessimistic. However, the second short candlestick indicates that the downward momentum is weakening, and the market enters a hesitative phase. The appearance of the third long bullish candlestick indicates that bullish forces are recovering, beginning to counterattack, and successfully pushing prices higher, shifting market sentiment from pessimistic to optimistic.
This pattern often leads market participants to feel that a reversal is imminent, especially when the morning star pattern appears in a clear downtrend or at a support level, indicating that the market may welcome a rebound or upward trend.
Bearish Reversal Candlestick Patterns
How to view it?
In this section, we will introduce six bearish reversal pattern combinations. When these combinations are observed, we can infer that the uptrend may have ended. These six pattern combinations are bearish engulfing pattern, dark cloud cover, bearish harami, bearish separation pattern, tweezer top, and evening star.
1. Three Black Crows
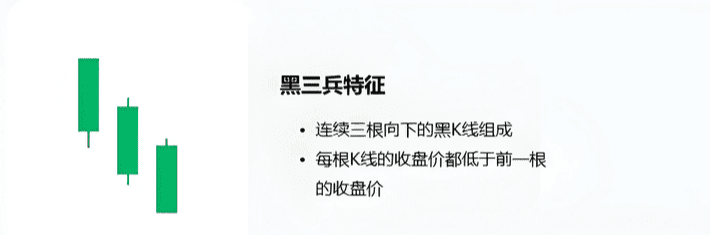
The Three Black Crows pattern reflects the gradual strengthening of bearish forces in the market. It usually appears at the end of an uptrend, and when three consecutive bearish candlesticks appear, it indicates that bullish forces are gradually depleted, market sentiment turns pessimistic, and bearish forces begin to dominate.
This pattern is regarded as a strong signal for a trend reversal, and investors should be cautious of the risks of a market downturn.
2. Bearish Engulfing Pattern
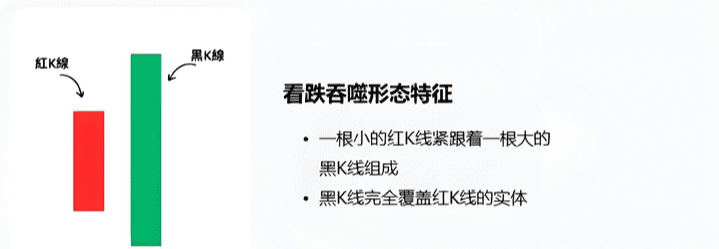
The bearish engulfing pattern reflects changes in the balance of forces between bulls and bears in the market. In an uptrend, the first bullish candlestick shows that bullish forces are still strong, and market sentiment is optimistic.
However, the second longer bearish candlestick suddenly reversed the situation, indicating that bearish forces began to dominate, strongly suppressing bullish forces, and prices plummeted sharply. This often causes market participants to feel worried, as it foreshadows a potential trend reversal.
3. Dark Cloud Cover
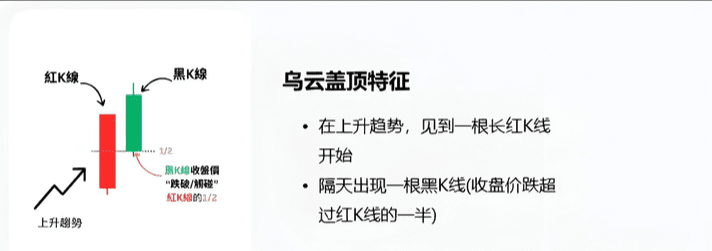
The Dark Cloud Cover pattern reflects a dramatic shift in the balance of forces between bulls and bears in the market. In an uptrend, the first long bullish candlestick indicates that bullish forces are still strong, and market sentiment is optimistic. However, the opening price of the second long bearish candlestick is higher, seemingly suggesting that bulls will continue to push prices up, but prices quickly fall on that day, breaking below the body of the previous candlestick.
This reversal pattern indicates a rapid strengthening of bearish forces, and bulls cannot maintain their advantage, leading market sentiment to shift rapidly from optimism to pessimism. Such situations often occur at the top of a trend, suggesting that the uptrend may end, and the market may enter a new downtrend.
4. Bearish Harami
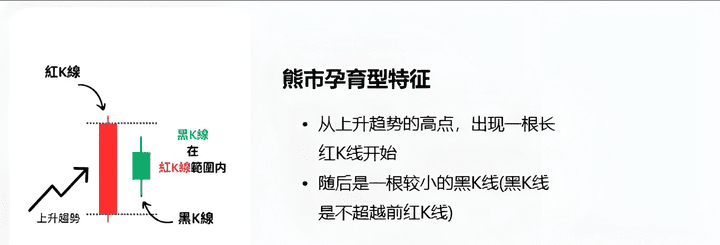
The bearish engulfing pattern reflects the changes in the balance of forces between bulls and bears in the market. In an uptrend, the first long bullish candlestick shows strong bullish power, and market sentiment is optimistic. However, the second small bearish or bullish candlestick indicates that bullish forces are beginning to wane, bearish forces are entering the market, and market sentiment becomes indecisive.
This pattern often leads market participants to feel that the uptrend may be nearing its end, and the market may be preparing for the next downturn.
5. Tweezer Top
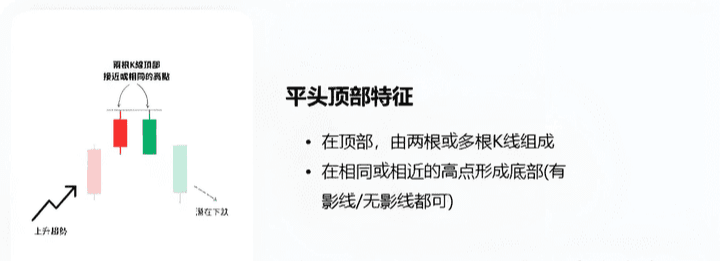
The Tweezer Top pattern reflects the shift of forces between bulls and bears in the market. In an uptrend, the first bullish candlestick indicates strong bullish power, and market sentiment is optimistic. However, the closing price of the second candlestick is the same as or close to the high of the first candlestick, indicating that bullish forces are facing resistance at high levels and are unable to push prices further.
This indicates that the market may have peaked, bearish forces are beginning to strengthen, and market sentiment is shifting from optimism to caution. This pattern often leads traders to feel that the market's upward trend might be coming to an end, and a downward phase may follow.
6. Evening Star
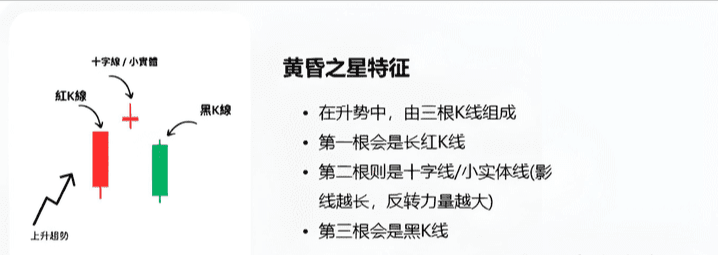
The Evening Star pattern reflects the changes in bullish and bearish forces in the market. In an uptrend, the first long bullish candlestick shows strong bullish sentiment. However, the second small candlestick indicates that market momentum is beginning to weaken, and investors' buying power is declining.
The appearance of a third long bearish candlestick marks a comprehensive strengthening of bearish forces, market sentiment quickly turns pessimistic, bullish forces are completely suppressed, and prices begin to fall sharply.
This pattern often leads traders to feel that the market's upward trend may be nearing its end, indicating a potential trend reversal.
By identifying and applying these patterns, you can gain early signals of potential price reversals, allowing you to formulate responsive trading strategies.
How to make candlestick patterns?
Applied to the chart
After understanding continuation and reversal candlestick patterns, we can further explore how to apply this knowledge to specific chart analysis.
1. Rising Three Methods and Three Black Crows
Next, let’s explore the differences between the 'Three White Soldiers' and the 'Rising Three Methods,' which are often inquired about. Although both patterns are bullish signals, their meanings and application strategies in the market differ.
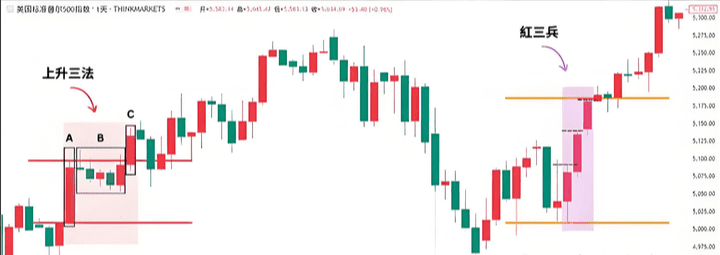
First, we can see the chart showing the 'Rising Three Methods' and 'Three White Soldiers' candlestick patterns.
As mentioned above, the 'Rising Three Methods' typically appear in an uptrend, experiencing a brief pullback after a period of increase, then breaking upward again.
In contrast, the 'Three White Soldiers' signify that buyers control the market. Three consecutive rising long bullish candlesticks, each closing price higher than the previous one, demonstrate the continuous control of buyers, driving the market to sustain upward.
In the Rising Three Methods, it is divided into three phases:
Phase One: Uptrend, showing a long bullish candlestick
Phase Two: Consolidation, showing five candlesticks (still within the range of the long bullish candlestick)
Phase Three: Again rising, breaking through the consolidation range, and a new long bullish candlestick appears
In the Three White Soldiers, three consecutive long bullish candlesticks appear. Each closing price is higher than the previous one, showing that buyers have firmly controlled the market over several trading days.
2. Falling Three Methods and Three Black Crows
As shown in the above figure, the 'Falling Three Methods' typically appear in downtrends, experiencing a brief rebound and consolidation after a period of decline, before breaking below support again.
The 'Three Black Crows' usually appear at the market top or when the uptrend is about to end. Composed of three consecutive long black candlesticks, it shows strong control by sellers. This continuous downward movement often foreshadows a pessimistic market sentiment, indicating a continuation of the downturn.
If you are also a tech enthusiast, consider this diagram:

The above are trading insights from 10 years of trading coins. After many ups and downs, these are heartfelt words of great enlightenment that I hope will be useful to everyone. Lao Chen's products are guaranteed to be high quality. There are beauties in the cryptocurrency world, unique and independent, with a soulful approach to trading!
Even the most diligent fisherman wouldn't go out to sea during a stormy season but would carefully protect his fishing boat; this season will pass, and a sunny day will surely come! Follow Lao Chen, who teaches you both how to fish and how to fish sustainably. The cryptocurrency world is always open, and only by going with the trend can you live a life that flows with it. Remember this and keep it close to your heart!
$ETH $BTC #现货黄金创历史新高
