25/09/01 BTC monthly line has not yet engulfed, short-term new lows may rebound, market panic looks for a rebound first
Bitcoin's new moon opening has not temporarily dropped below the July low of around 105000 support, and no engulfing pattern has formed for the monthly line. However, the weekly M-head has broken down, arriving in the lower area of concentrated chips, leading to extreme market panic. However, I feel that there are signs of approaching the stage low in the short term. The lowest spike at the hourly level was 107211, rebounding 2600 points before continuing to drop back to around 108600.
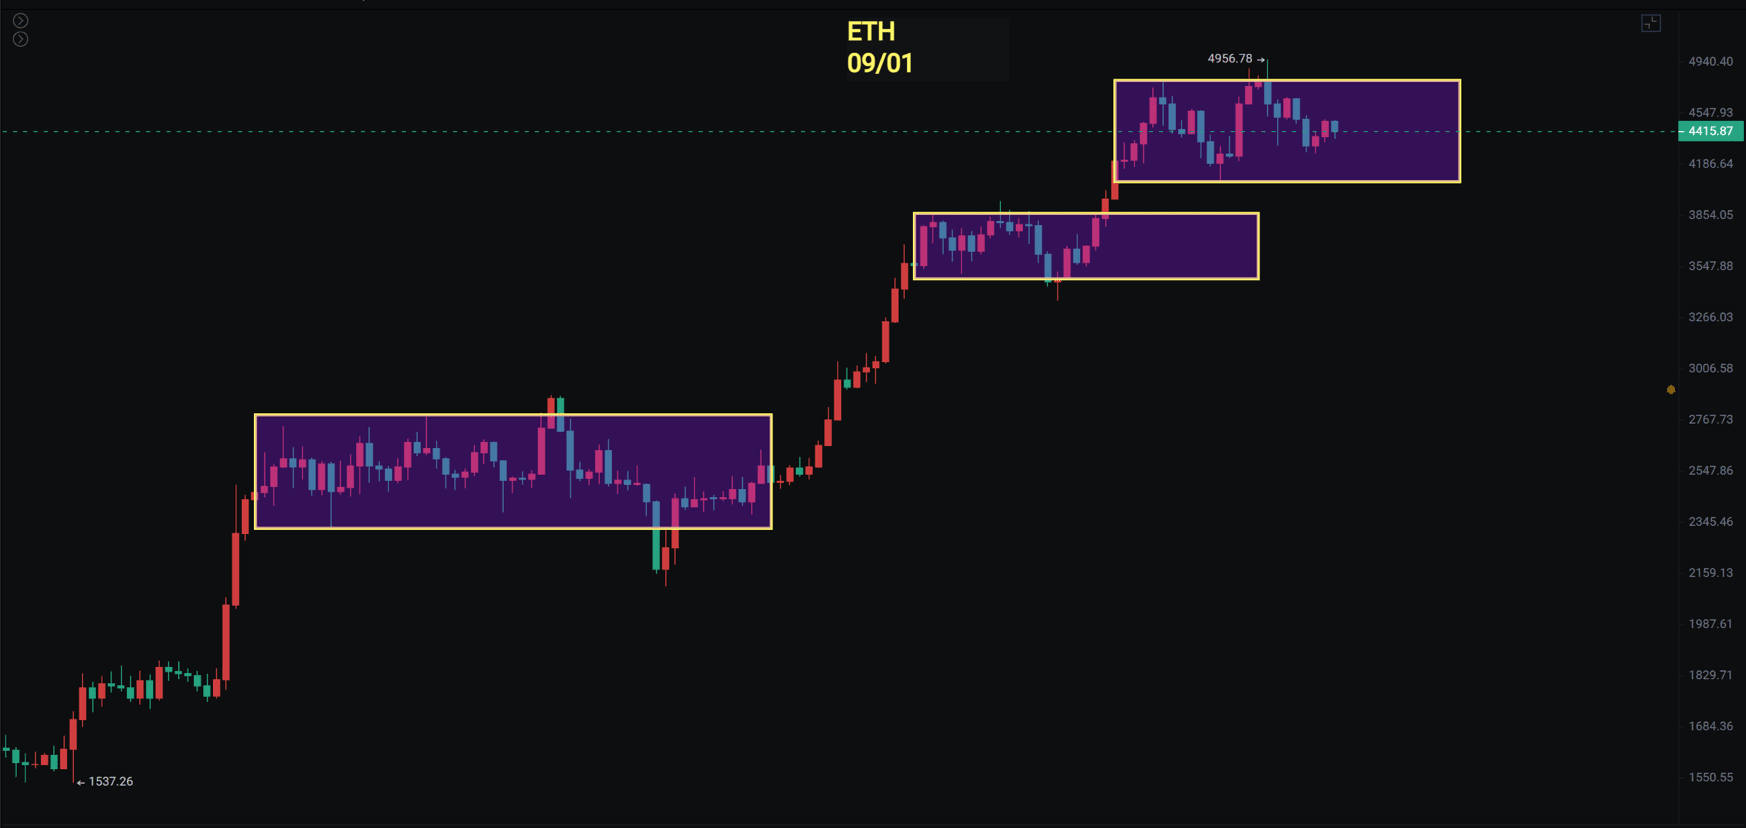
Ethereum's monthly line has formed a bullish line with upper and lower shadows. The daily line remains at the bottom of the large bullish line on August 22. 4060 and 4200 are important support levels for Ethereum. Although the daily rising support line has been temporarily broken, it can only be viewed as oscillating within a high-level box.
The highest spike for gold reached 3489, about 10 points from the high, while Bitcoin has been continuously dropping. Recently, the trends of these two have been opposite. Tonight, the US stock market is closed. Bitcoin has often dropped in the first week of the new moon since the beginning of the year, and with the upcoming interest rate cut before September 18, it cannot be ruled out that the market will first rise and then adjust. September itself is usually a bad month, but from late September to October, it typically rises. So there is no need to panic too much about whether 125,000 is the peak of this bull market; we need to observe the upcoming rebound situation. If this price level cannot be broken through, then we need to worry.
Bitcoin
Bitcoin has retraced 13.85% from its highest point. In a bull market, a drop of about 10% typically sees a rebound, or a drop of 30% will mark a low point. Declines do not happen all at once, and the same applies to rises.
The monthly line opening has not broken below the July low of 105000, and the engulfing pattern has not yet appeared. However, the first month of the new moon usually sees a drop. This Friday, there is non-farm data that needs attention.
The 4-hour chart broke below the previous low but quickly recovered, currently around 108900. Although it cannot be 100% certain that this is the stage low, it seems that there is no need to panic as it is relatively close to the stage rebound low. As long as 107210 is not broken, this can be considered as the low point for the rebound. Similarly, we need to pay attention to whether the descending channel can be broken. Short-term focus is on rebounds, with resistance at 110000 and pressure at 103500.
Support: 105000 to 107000
Resistance: 110000 to 113500 to 117500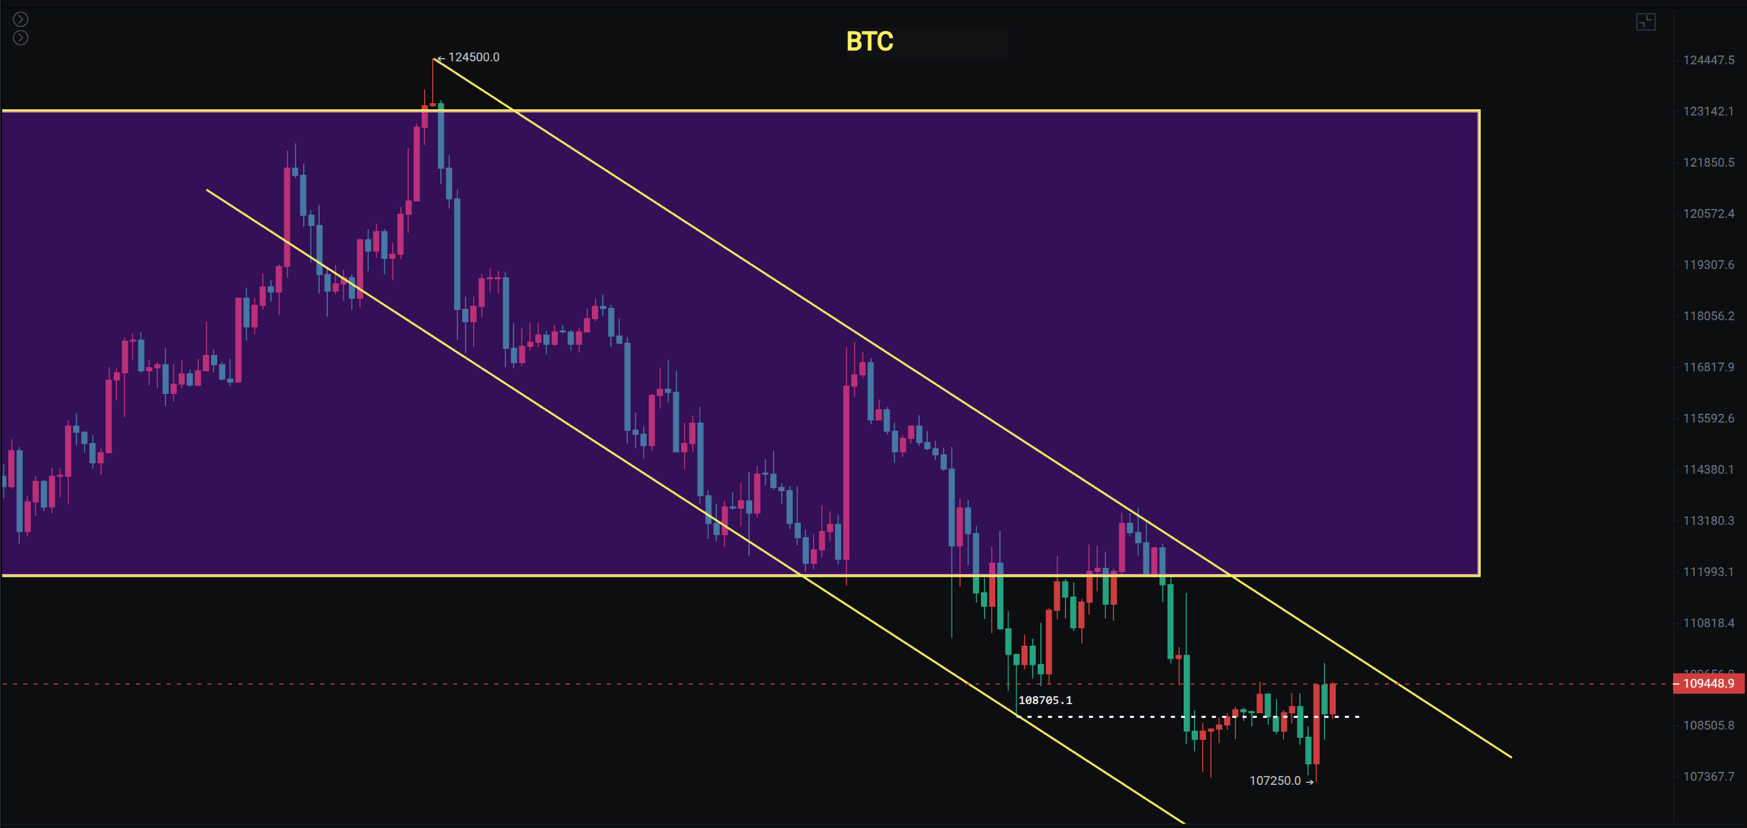
Ethereum
Ethereum's daily line shows a false break. The daily rising support line has been broken.
The three-day rebound has been suppressed by MA20. There is currently no break below the support around 4200 from the large bullish line on August 22, so there is no need to panic too much. It is possible to see oscillation within a high-level box.
On the 1-hour and 4-hour levels, despite my belief that Ethereum will follow Bitcoin for a rebound, the current position can only be used for short-term trades, and the cost-performance ratio is still not high. If there is a subsequent drop below 4060 and then a rebound, it can be considered for significant accumulation.
Support: 3900 to 4060 to 4200
Resistance: 4500 to 4665 to 4788